2467
Intravenous arachnoid granulation volumetrics relate to sleep impairment in patients with Parkinson disease1Neurology, Vanderbilt University Medical Center, Nashville, TN, United States, 2Radiology and Radiological Sciences, Vanderbilt University Medical Center, Nashville, TN, United States, 3Psychiatry and Behavioral Sciences, Vanderbilt University Medical Center, Nashville, TN, United States
Synopsis
Keywords: Neurofluids, Data Analysis, Arachnoid granulation, sleep, cerebrospinal fluid
Motivation: The high prevalence of sleep dysfunction in Parkinson disease (PD) leads to chronic dysregulation of the CSF circuits.
Goal(s): Hypotheses regarding arachnoid granulation (AG) hypertrophy in patients with PD and its relationship to sleep dysfunction were tested.
Approach: Sleep quality was assessed in PD patients. Using high resolution MRI and a novel deep-learning method, we assessed volumetrics measures of AG in the superior sagittal sinus.
Results: We found that increased AG volumetrics in PD are significantly correlated with an increase of self-reported sleep disturbance and diurnal sleepiness, as well as actigraphy-based metrics of decreased sleep efficiency and increased wake after sleep onset.
Impact: Findings suggest that sleep dysfunction plays a role intravenous AG morphology. This motivates future structural and functional imaging analysis of AG to understand how increased AG volume impacts patients with neurodegenerative proteinopathy and how dysfunctional sleep influences this relationship.
Introduction
The overall goal of this work is to assess the relationship between arachnoid granulation (AG) volumetric measures and sleep impairments presenting in PD using a non-invasive imaging technique.With the emergence of the glial-lymphatic (glymphatic) system paradigm1,2, cerebrospinal fluid (CSF) movement has been hypothesized to play a crucial role in subserving clearance, as well as nutrient delivery3. AG represent a hypertrophy of normal arachnoid villi and project from subarachnoid space into the lacuna lateralis and superior sagittal sinus4. The focus here is primarily on intravenous AG protruding into the superior sinus5,6. Intravenous AGs are hypothesized to regulate CSF egress7. Previous work has highlighted the importance of sleep in the regulation of the CSF and glymphatic circuits8,9. Sleep impairment is one of the most common non-motor symptoms in PD, affecting around 60-90% of the PD populations10 , and chronic sleep impairment dysregulates the CSF circuits. Consequently, we proposed to investigate volumetric measures of intravenous AG in PD assessed by the combination of a novel deep learning technique and high resolution MRI11. Using correlational analyses, we investigated the hypothesis that volumetric measures of AG positively correlate with the increase of sleep impairment.
Methods
All (n=25) participants with PD were scanned at 3-Tesla MRI. Clinical assessments. Cognitive impairments were assessed using the Montreal Cognitive Assessment (MoCA) and motor impairments assessed using the Mini Balance Evaluation Systems Test (MiniBEST)12, Universal Parkinson Disease Rating Scale (UPDRS)13, and Single Digit Modalities Test (SDMT)14. Patients were off medication for 16 hours prior to all assessment and image acquisition. Sleep assessments were conducted with the Patient-Reported Outcomes Measurement Information System (PROMIS)15, which this assesses sleep disturbance (SD) and sleep-related impairment (SRI). Sleep efficiency (SE%) and wake after sleep onset (WASO) were estimated using actigraph units (ActiGraph wGT3X-BT)16, taken from 11 patients who wore an actigraphy device between 3 and 82 days (μ = 22.9, Med = 18). MRI acquisition. 3D T1-weighted (TR/TE = 8.2/3.8ms, spatial resolution = 1x1x1 mm) and 3D T2-weighted MRI (TR/TE=2500/331 ms, spatial resolution = 0.78x0.78x0.78 mm) were acquired. Image processing. T2-weighted MRIs corrected for inhomogeneity field and aligned to the MNI template using affine registration17. AG were then automatically segmented using a novel deep learning technique inferring location of AG based on high resolution T2-weighted scans11. Brain volumes were estimated using T1-weighted scans fed to AssemblyNet18. AG measures. AG were characterized as total volume, number, mean volume, and maximum volume (i.e., volume of the largest AG detected per participant). Hypothesis testing. Relationships of AG measures with clinical and sleep assessments were assessed using Spearman-rank correlation. Analyses were normalized by total intracranial volume. All p-values are reported as corrected for false positive rate19 (pFDR).Results
Clinical assessments. Spearman correlations (Table 2) revealed a significant relationship between total AG volume in PD and MiniBEST (ρ = 0.48, pFDR = 0.02), but not MoCA (ρ = 0.14, pFDR = 0.92) or UPDRS ( ρ = -0.02, pFDR = 0.92). Sleep assessments. Total AG volume (Table 3) was significantly correlated with SD (ρ = 0.46, pFDR=0.01) and SRI score (ρ = 0.38, pFDR = 0.04). Correlation with SD and SRI scores were also significant with maximum AG volume (ρ = 0.49 and ρ = 0.40, pFDR <0.01 and pFDR = 0.02, respectively) and mean AG volume (ρ = 0.63 and ρ = 0.47, pFDR <0.01 and pFDR <0.01, respectively), but not AG number. Total AG volume was significantly related to SE% (ρ = -0.79, pFDR <0.01) and WASO (ρ = 0.67, pFDR = 0.02). SE% was highly negatively correlated with AG number (ρ = -0.72, pFDR = 0.02).Discussion and Conclusions
Increased total AG volume was positively correlated with SD and SRI scores, and actigraphy measures of sleep efficiency and WASO. Maximum and mean AG volume were also significantly correlated with SD and SRI, and AG number was significantly associated with SE%. Thus, we uncovered that sleep impairment relates to an increase in AG volume and number in a relatively cognitively preserved PD cohort. Potential explanations include AG hypertrophy due to impaired downstream clearance of CSF to dural venous sinuses or AG enlargement to facilitate increased CSF-mediated waste clearance of protein aggregation in PD. Chronic sleep dysfunction potentially contributes to CSF clearance inefficiency, as glymphatic clearance is greater during sleep20. Overall, the observed increase in AG volume could compensate for less effective fluid transfer from subarachnoid space to venous flow, and this may be negatively impacted by sleep inefficiency. As the CSF flow circuit is up-regulated during sleep, chronic sleep dysfunction might lead to dysregulation of the system, which cause increased volume of AG.Acknowledgements
This work was supported in part by the U.S. Department of defense under Grant W81XWH-191-0812 and by the National Institute of Health (NIH) under Grants R01AG062574, R01AT11456, K24AG064114, and the Huntington Disease Society of America Human Biology Project fellowship. Research reported in this publication was also supported by the National Institute on Aging of the National Institutes of Health under Award Number U01AG052564 and by funds provided by the McDonnell Center for Systems Neuroscience at Washington University in St. Louis. The HCP-Aging 2.0 Release data used in this report came from DOI: 10.15154/1520707.References
1. Iliff JJ, Wang M, Liao Y, et al. A Paravascular Pathway Facilitates CSF Flow Through the Brain Parenchyma and the Clearance of Interstitial Solutes, Including Amyloid β. Sci Transl Med. 2012;4(147). doi:10.1126/scitranslmed.3003748
2. Benveniste H, Liu X, Koundal S, Sanggaard S, Lee H, Wardlaw J. The Glymphatic System and Waste Clearance with Brain Aging: A Review. Gerontology. 2019;65(2):106-119. doi:10.1159/000490349
3. Veening JG, Barendregt HP. The regulation of brain states by neuroactive substances distributed via the cerebrospinal fluid; a review. Cerebrospinal Fluid Res. 2010;7(1):1. doi:10.1186/1743-8454-7-1
4. Trolard D. Les Lacunes Veineuses de la dura-mere. J Anat. 1892;38:28-56.
5. Brunori A, Vagnozzi R, Giuffrè R. Antonio Pacchioni (1665–1726): early studies of the dura mater. J Neurosurg. 1993;78(3):515-518. doi:10.3171/jns.1993.78.3.0515
6. Shah T, Leurgans SE, Mehta RI, et al. Arachnoid granulations are lymphatic conduits that communicate with bone marrow and dura-arachnoid stroma. J Exp Med. 2023;220(2):e20220618. doi:10.1084/jem.20220618
7. Grzybowski DM, Herderick EE, Kapoor KG, Holman DW, Katz SE. Human arachnoid granulations Part I: a technique for quantifying area and distribution on the superior surface of the cerebral cortex. Cerebrospinal Fluid Res. 2007;4(1):6. doi:10.1186/1743-8454-4-6
8. Kress BT, Iliff JJ, Xia M, et al. Impairment of paravascular clearance pathways in the aging brain: Paravascular Clearance. Ann Neurol. 2014;76(6):845-861. doi:10.1002/ana.24271
9. Xie L, Kang H, Xu Q, et al. Sleep Drives Metabolite Clearance from the Adult Brain. Science. 2013;342(6156):373-377. doi:10.1126/science.1241224
10. Schrempf W, Brandt MD, Storch A, Reichmann H. Sleep Disorders in Parkinson’s Disease. J Park Dis. 2014;4(2):211-221. doi:10.3233/JPD-130301
11. Hett K, McKnight CD, Eisma JJ, et al. Parasagittal dural space and cerebrospinal fluid (CSF) flow across the lifespan in healthy adults. Fluids Barriers CNS. 2022;19(1):24. doi:10.1186/s12987-022-00320-4
12. Franchignoni F, Horak F, Godi M, Nardone A, Giordano A. Using psychometric techniques to improve the Balance Evaluation Systems Test: the mini-BESTest. J Rehabil Med. 2010;42(4):323-331. doi:10.2340/16501977-0537
13. Goetz CG, Tilley BC, Shaftman SR, et al. Movement Disorder Society-sponsored revision of the Unified Parkinson’s Disease Rating Scale (MDS-UPDRS): Scale presentation and clinimetric testing results: MDS-UPDRS: Clinimetric Assessment. Mov Disord. 2008;23(15):2129-2170. doi:10.1002/mds.22340
14. Smith, A. Symbol Digit Modalities Test (SDMT). Manual (Revised). Los Angel West Psychol Serv.
15. Cella D, Yount S, Rothrock N, et al. The Patient-Reported Outcomes Measurement Information System (PROMIS): Progress of an NIH Roadmap Cooperative Group During its First Two Years. Med Care. 2007;45(5):S3-S11. doi:10.1097/01.mlr.0000258615.42478.55
16. Kripke DF, Mullaney DJ, Messin S, Wyborney VG. Wrist actigraphic measures of sleep and rhythms. Electroencephalogr Clin Neurophysiol. 1978;44(5):674-676. doi:10.1016/0013-4694(78)90133-5
17. Avants BB, Tustison NJ, Song G, Cook PA, Klein A, Gee JC. A reproducible evaluation of ANTs similarity metric performance in brain image registration. NeuroImage. 2011;54(3):2033-2044. doi:10.1016/j.neuroimage.2010.09.025
18. Coupé P, Mansencal B, Clément M, et al. AssemblyNet: A large ensemble of CNNs for 3D whole brain MRI segmentation. NeuroImage. 2020;219:117026. doi:10.1016/j.neuroimage.2020.117026
19. Benjamini Y, Hochberg Y. Controlling the False Discovery Rate: A Practical and Powerful Approach to Multiple Testing. J R Stat Soc Ser B Methodol. 1995;57(1):289-300. doi:10.1111/j.2517-6161.1995.tb02031.x
20. Reddy OC, Van Der Werf YD. The Sleeping Brain: Harnessing the Power of the Glymphatic System through Lifestyle Choices. Brain Sci. 2020;10(11):868. doi:10.3390/brainsci10110868
Figures
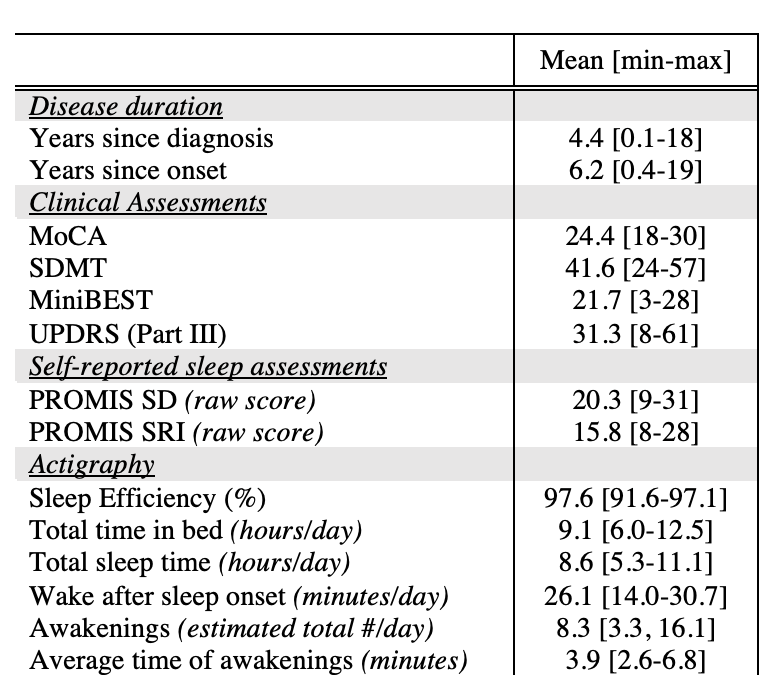
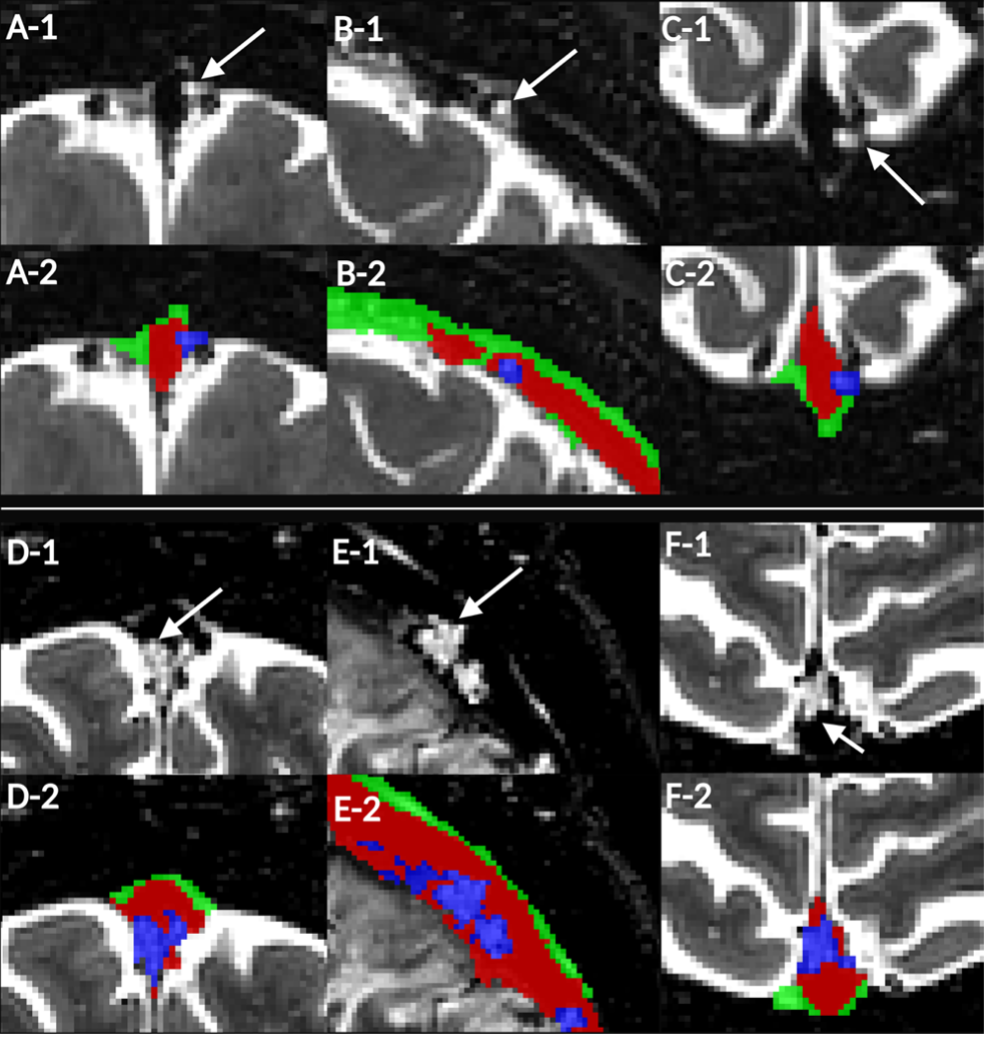
Figure 1. Small AG in Male, 70-year-old HC (total AG volume = 66.65 mm3) and large AG in Male, 67-year-old partient with PD (total AG volume = 454.65 mm3) on 3D T2-weighted MRI. (A-C) Much smaller AG in HC on MRI. (A2-C2) Delineation of AG, PSD, and venous lumen. Small AG in coronal (A1-2), sagittal (B1-2), and axial views (C1-2). (D-F) Giant AG in PD, supporting hypothesis of significant AG hypertrophy in PD. (A2-C2) Delineation of AG, PSD, and venous lumen. Giant AG in coronal (D1-D2), sagittal (E1-E2), and axial views (F1-F2). (D2-F2) Delineation of AG, PSD, and venous lumen.
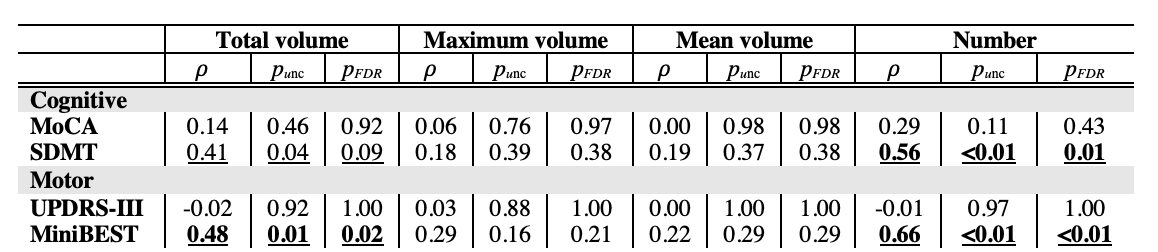
Table 2. Spearman correlations between AG measures and clinical assessment (MoCA, MiniBEST, UPDRS) in participants with PD. Significant relationships are highlighted in underlined bold. MoCA: Montreal Cognitive Assessment, SDMT: Symbol Digit Modalities Test, UPDRS-III: Universal Parkinson Disease Rating Scale part III, MiniBEST: Mini Balance Evaluation Systems Test.
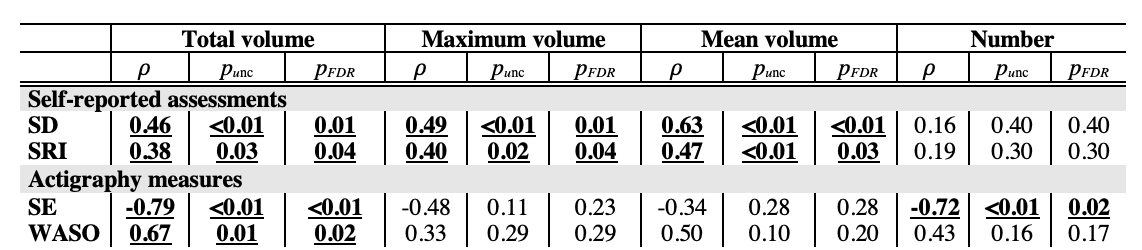
Table 3. Spearman correlations between AG measures and sleep assessments (PROMIS), as well as actigraphy data, in participants with PD. Significant relationships are highlighted in underlined bold. SD: Sleep disturbance, SRI: Sleep related impairment, SE%: Sleep efficiency, WASO: Wake after sleep onset.