2465
Visualization of iron and myelin cytoarchitecture in postmortem human brain using sub-millimeter multi-orientation chi- separation1Department of Radiology and Radiological Science, Johns Hopkins University School of Medicine, Baltimore, MD, United States, 2F.M. Kirby Research Center for Functional Brain Imaging, Kennedy Krieger Research Institute, Baltimore, MD, United States, 3Department of Pathology, Division of Neuropathology, Johns Hopkins University School of Medicine, Baltimore, MD, United States, 4The Richman Family Precision Medicine Center of Excellence in Alzheimer's Disease, Baltimore, MD, United States
Synopsis
Keywords: Susceptibility/QSM, Electromagnetic Tissue Properties
Motivation: While high-resolution quantitative susceptibility mapping (QSM) reveals unprecedented anatomical cytoarchitectures, delineation of certain substructures may be limited in regions containing both iron and myelin.
Goal(s): To demonstrate iron and myelin-specific anatomy inside human brain using sub-millimeter susceptibility source-separation (chi-separation).
Approach: Sub-millimeter multi-orientation QSM and chi-separation were obtained on postmortem human hemibrain at 7T. Capabilities of QSM, χpara and χdia contrasts for delineating neuroanatomy were compared.
Results: While iron-rich substructures like line of Gennari can be readily identified in QSM, χdia helps reveal small fibers including striatal tracts, perforant pathway and fibers in cortical/subthalamic area.
Impact: Sub-millimeter susceptibility source separation images can delineate neuroanatomical substructures in the human brain with increasing specificity to iron or myelin related cytoarchitecture.
Introduction
High-resolution magnetic susceptibility-sensitive MRI, including R2* and quantitative susceptibility mapping (QSM)1, show great promise to image subcortical and cortical substructures, especially at ultra-high field (7T/above)2, with two major underlying tissue susceptibility sources, i.e., iron and myelin3. Using QSM in ex-vivo animal study, detailed cytoarchitectures, e.g., striatal tracts in basal ganglia, have also been visualized4. However, in many brain areas, e.g., superficial white matter, paramagnetic iron and the diamagnetic myelin colocalize and give opposing effects on QSM signal5, which may limit the visualization of certain neuroanatomical substructures. Recent developments on magnetic susceptibility source separation6,7 have demonstrated the feasibility to separate individual contribution of paramagnetic (iron) and diamagnetic sources (myelin)6. In this study, the iron and myelin-specific maps, i.e., χpara and χdia maps (relative to water), obtained from postmortem human hemibrains at 7T using multi-orientation susceptibility source separation (chi-separation)8 are compared with multi-orientation QSM (COSMOS9) in their ability to reveal detailed iron- and myelin-based anatomical substructures.Materials and Methods
[Experiment setup]Two de-identified postmortem hemibrains with no obvious abnormalities were provided by the Johns Hopkins Brain Resource Center (HBS002: 55 y/o, female; HBS003: 57y/o, male). The hemibrains were fixed in 10% formaldehyde for more than 3 months before MRI.10,11 A container and four bases were designed and 3D-printed to acquire data at different brain orientations with little B0 field inhomogeneity (detailed procedures described in another abstract submitted this year).
[Data Acquisition]
MRI data were acquired on a 7T human MRI scanner. 3D multi-echo GRE (MEGRE) data were acquired with the following parameters: TR/TE/ΔTE=47/3/4ms, 5 echoes, flip angle=12°, resolution=0.5-mm-isotropic, scan time=17m 46s per orientation, max 12 brain orientations. For chi-separation, multi-echo spin-echo (MESE) was also collected at the reference orientation, with resolution=1-mm-isotropic, TR/TE/ΔTE=12069/12/12ms, 5 echoes, scan time=36m 36s.
[Processing]
The multi-orientation phase images were sequentially preprocessed with unwrapping12, echo combination13, and background field removal14, and subsequently, nonlinearly coregistered15 to compensate for gradient nonlinearity-related distortions. Multi-orientation QSM was reconstructed using COSMOS (CSF-referenced). In addition, R2* and R2 values were fitted using the MEGRE and MESE magnitude data and then used to calculate R2’ at each orientation. Using both R2’ and preprocessed phase maps, both the χpara and χdia maps were calculated using the multi-orientation chi-separation method8.
Results
QSM, χpara and χdia maps obtained from one sample (HBS003) showing the iron-rich deep gray matter region is demonstrated in Fig. 1. In this region, χpara and χdia allowed better delineation than QSM of the subnucleus of globus pallidus (GP), including external GP (GPe), internal GP (GPi) and two dense myelin-abundant lamina structures, i.e., medial medullary lamina (MML) and accessory medullary lamina (AML). MML is an important thin structure between GPe and GPi, being the main target of deep brain stimulation for Parkinson's disease16–18. χpara and χdia map also allowed GPi to be further divided into internal/external segments (GPie, GPii) by AML, which is challenging to visualize in QSM19. In addition, inside GP and Putamen, radial striatal tracts connecting putamen and thalamus, as shown in previous literature20, can also be better visualized in the χpara and χdia maps.Figure 2 shows comparisons of χpara, χdia and QSM maps in the visual cortex (HBS002). While the line of Gennari (LoG; yellow arrows), known to have abundant iron and myelin, can be readily identified in all three contrasts, QSM can only indicate a combined effect from both iron and myelin sources. A stronger LoG contrast in χpara than that in χdia is observed in LoG suggesting a more dominant role of tissue iron in its QSM contrast, consistent with previous report21. Similar comparisons were conducted in medium temporal lobe showing the entorhinal cortex (Fig. 3), where entorhinal-layer-II island, CA1 and CA2 of the hippocampus and the perforant pathway can be visualized. The perforant pathway connecting entorhinal cortex and hippocampus, which is an initial neurodegenerative region during Alzheimer’s disease22, can be better delineated in the χdia map.
In the subthalamic area (Fig. 4), the locations of the subthalamic tracts could also be better identified relative to the adjacent gray matter structures in χdia.
Comparisons of QSM versus χpara and χdia are further demonstrated with line profiles in different cortical areas (Fig. 5), including the primary visual cortex, hand knob of motor cortex, and precentral gyrus. The revealed iron and myelin cytoarchitectures are in general consistent with what is reported in the literature: both iron/myelin-abundant LoG21, iron-rich hand knob23, diffusive iron in precentral gyrus24,25.
Conclusion/Discussion
High resolution multi-orientation susceptibility source separation could further help delineate neuroanatomical substructures with enhanced specificity to tissue iron and myelin sources than QSM.Acknowledgements
This work is supported by NIH NIBIB (P41EB031771), the Richman Family Precision Medicine Center of Excellence in Alzheimer's Disease including significant contributions from the Richman Family Foundation, the Rick Sharp Alzheimer’s Foundation, the Sharp Family Foundation and others. Kenichi Oishi is a consultant for “AnatomyWorks” and “Corporate-M.” Peter van Zijl has research support from and technology licensed to Philips Healthcare and has also been a paid speaker. This arrangement is being managed by the Johns Hopkins University in accordance with its conflict-of-interest policies.References
1. Deistung A, Schäfer A, Schweser F, Biedermann U, Turner R, Reichenbach JR. Toward in vivo histology: A comparison of quantitative susceptibility mapping (QSM) with magnitude-, phase-, and R2⁎-imaging at ultra-high magnetic field strength. Neuroimage. 2013;65:299-314. doi:10.1016/j.neuroimage.2012.09.055
2. Duyn JH, Gelderen P van, Li TQ, Zwart JA de, Koretsky AP, Fukunaga M. High-field MRI of brain cortical substructure based on signal phase. Proc National Acad Sci. 2007;104(28):11796 11801. doi:10.1073/pnas.0610821104
3. Langkammer C, Schweser F, Krebs N, et al. Quantitative susceptibility mapping (QSM) as a means to measure brain iron? A post mortem validation study. Neuroimage. 2012;62(3):1593-1599. doi:10.1016/j.neuroimage.2012.05.049
4. Wei H, Xie L, Dibb R, et al. Imaging whole-brain cytoarchitecture of mouse with MRI-based quantitative susceptibility mapping. Neuroimage. 2016;137:107-115. doi:10.1016/j.neuroimage.2016.05.033
5. Duyn JH, Schenck J. Contributions to magnetic susceptibility of brain tissue. Nmr Biomed. 2017;30(4):e3546. doi:10.1002/nbm.3546
6. Shin HG, Lee J, Yun YH, et al. χ-separation: Magnetic susceptibility source separation toward iron and myelin mapping in the brain. NeuroImage. 2021;240:118371. doi:10.1016/j.neuroimage.2021.118371
7. Emmerich J, Bachert P, Ladd ME, Straub S. On the separation of susceptibility sources in quantitative susceptibility mapping: Theory and phantom validation with an in vivo application to multiple sclerosis lesions of different age. J Magn Reson. 2021;330:107033. doi:10.1016/j.jmr.2021.107033
8. Shin HG, Seo J, Lee Y, et al. chi-separation using multi-orientation data in invivo and exvivo brains: Visualization of histology up to the resolution of 350 um. ISMRM. 2022.
9. Liu T, Spincemaille P, Rochefort L de, Kressler B, Wang Y. Calculation of susceptibility through multiple orientation sampling (COSMOS): A method for conditioning the inverse problem from measured magnetic field map to susceptibility source image in MRI. Magnet Reson Med. 2009;61(1):196-204. doi:10.1002/mrm.21828
10. Dawe RJ, Bennett DA, Schneider JA, Vasireddi SK, Arfanakis K. Postmortem MRI of human brain hemispheres: T2 relaxation times during formaldehyde fixation. Magnet Reson Med. 2009;61(4):810-818. doi:10.1002/mrm.21909
11. Shatil AS, Uddin MN, Matsuda KM, Figley CR. Quantitative Ex Vivo MRI Changes due to Progressive Formalin Fixation in Whole Human Brain Specimens: Longitudinal Characterization of Diffusion, Relaxometry, and Myelin Water Fraction Measurements at 3T. Frontiers Medicine. 2018;5:31. doi:10.3389/fmed.2018.00031
12. Abdul-Rahman HS, Gdeisat MA, Burton DR, Lalor MJ, Lilley F, Moore CJ. Fast and robust three-dimensional best path phase unwrapping algorithm. Appl Opt. 2007;46(26):6623-6635. doi:10.1364/ao.46.006623
13. Wu B, Li W, Avram AV, Gho SM, Liu C. Fast and tissue-optimized mapping of magnetic susceptibility and T2* with multi-echo and multi-shot spirals. NeuroImage. 2012;59(1):297-305. doi:10.1016/j.neuroimage.2011.07.019
14. Wu B, Li W, Guidon A, Liu C. Whole brain susceptibility mapping using compressed sensing. Magnet Reson Med. 2012;67(1):137 147. doi:10.1002/mrm.23000
15. Tustison NJ, Cook PA, Holbrook AJ, et al. The ANTsX ecosystem for quantitative biological and medical imaging. Sci Rep. 2021;11(1):9068. doi:10.1038/s41598-021-87564-6
16. Krack P, Pollak P, Limousin P, et al. Opposite motor effects of pallidal stimulation in Parkinson’s disease. Ann Neurol. 1998;43(2):180-192. doi:10.1002/ana.410430208
17. Tisch S, Zrinzo L, Limousin P, et al. Effect of electrode contact location on clinical efficacy of pallidal deep brain stimulation in primary generalised dystonia. J Neurol, Neurosurg Psychiatry. 2007;78(12):1314. doi:10.1136/jnnp.2006.109694
18. Schönecker T, Gruber D, Kivi A, et al. Postoperative MRI localisation of electrodes and clinical efficacy of pallidal deep brain stimulation in cervical dystonia. J Neurol, Neurosurg Psychiatry. 2015;86(8):833. doi:10.1136/jnnp-2014-308159
19. Maruyama S, Fukunaga M, Fautz HP, Heidemann R, Sadato N. Comparison of 3T and 7T MRI for the visualization of globus pallidus sub-segments. Sci Rep. 2019;9(1):18357. doi:10.1038/s41598-019-54880-x
20. Schaltenbrand G, Wahren W. Atlas for Stereotaxy of the Human Brain. 2d, rev. ed. Stuttgart: Thieme; 1977.
21. Fukunaga M, Li TQ, Gelderen P van, et al. Layer-specific variation of iron content in cerebral cortex as a source of MRI contrast. Proc National Acad Sci. 2010;107(8):3834-3839. doi:10.1073/pnas.0911177107
22. Uchida Y, Onda K, Hou Z, Troncoso JC, Mori S, Oishi K. Microstructural Neurodegeneration of the Entorhinal-Hippocampus Pathway along the Alzheimer’s Disease Continuum. J Alzheimer’s Dis : JAD. 2023;95(3):1107-1117. doi:10.3233/jad-230452
23. Pallebage-Gamarallage M, Foxley S, Menke RAL, et al. Dissecting the pathobiology of altered MRI signal in amyotrophic lateral sclerosis: A post mortem whole brain sampling strategy for the integration of ultra-high-field MRI and quantitative neuropathology. BMC Neurosci. 2018;19(1):11. doi:10.1186/s12868-018-0416-1
24. Stüber C, Pitt D, Wang Y. Iron in Multiple Sclerosis and Its Noninvasive Imaging with Quantitative Susceptibility Mapping. Int J Mol Sci. 2016;17(1):100. doi:10.3390/ijms17010100
25. Stüber C, Morawski M, Schäfer A, et al. Myelin and iron concentration in the human brain: A quantitative study of MRI contrast. Neuroimage. 2014;93(P1):95 106. doi:10.1016/j.neuroimage.2014.02.026
26. Oishi K, Mori S, Troncoso JC, Lenz FA. Mapping tracts in the human subthalamic area by 11.7T ex vivo diffusion tensor imaging. Brain Struct Funct. 2020;225(4):1293-1312. doi:10.1007/s00429-020-02066-x
Figures
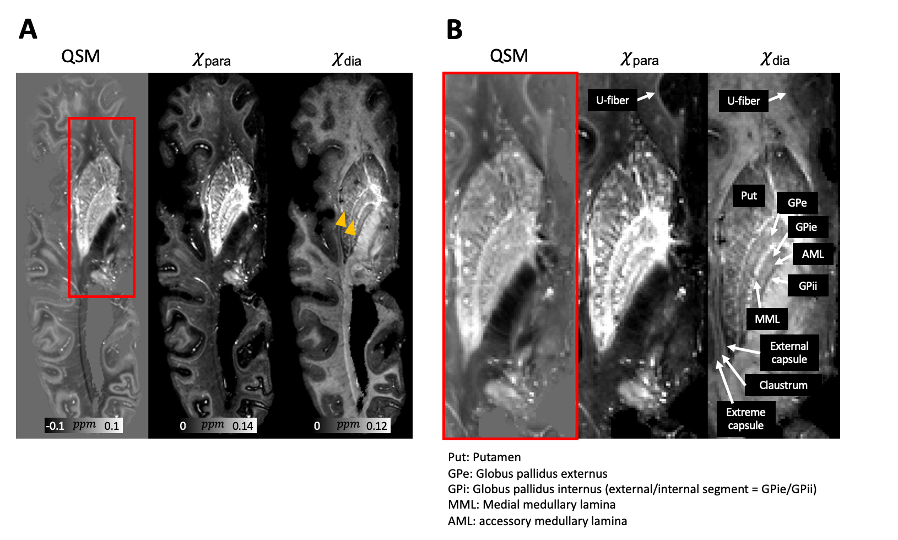
Fig. 1. (A) Multi-orientation QSM (COSMOS reconstruction from 12 orientations) obtained from a postmortem human hemibrain sample (HBS003), in comparison with the corresponding χpara and χdia maps calculated using multi-orientation chi-separation, showing the basal ganglia area. Striatal tracts composed of medium spiny neurons are better visualized in the χdia maps (yellow arrow heads). Zoom-in views of the red box area are shown in (B). Anatomical abbreviations are listed at the bottom of the figure.
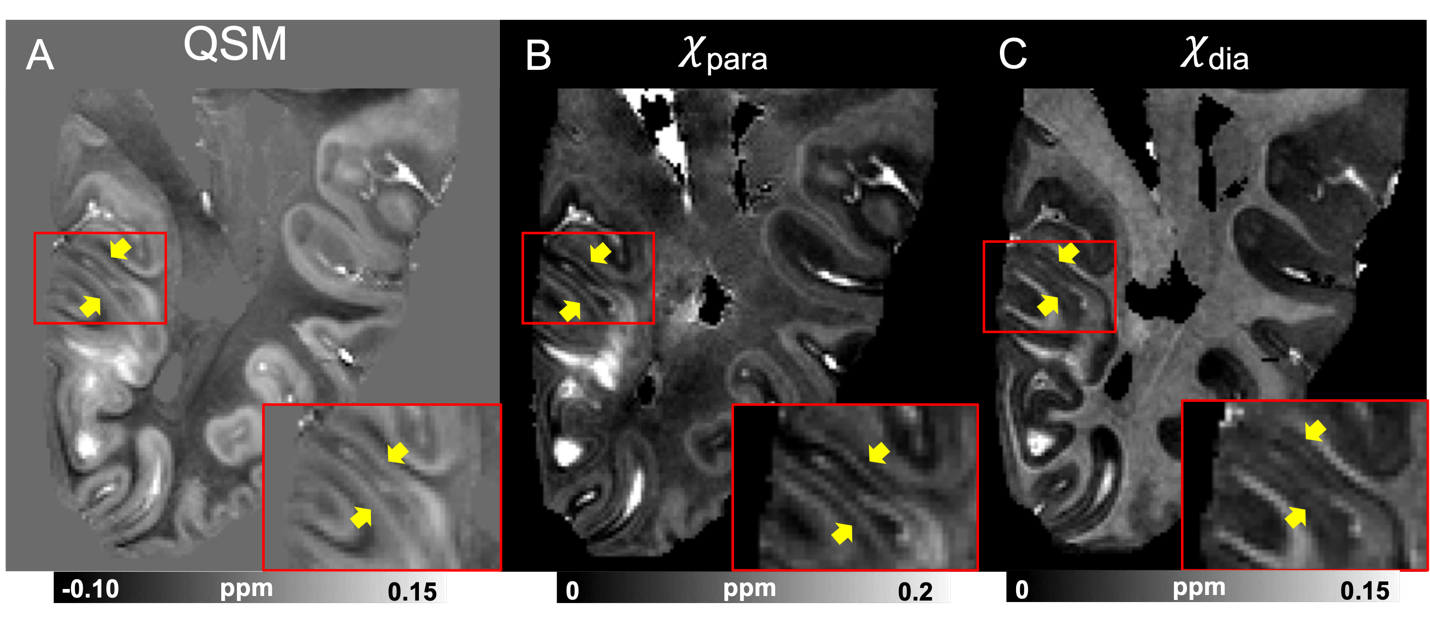
Fig 2. (A) Multi-orientation QSM (COSMOS reconstruction from 6 orientations) obtained from a postmortem human hemibrain sample (HBS002), in comparison with the corresponding χpara (B) and χdia (C) maps calculated using multi-orientation chi-separation, showing the visual cortex area. The red bounding boxes are zoom-in views to better visualize the line of Gennari (yellow arrows).
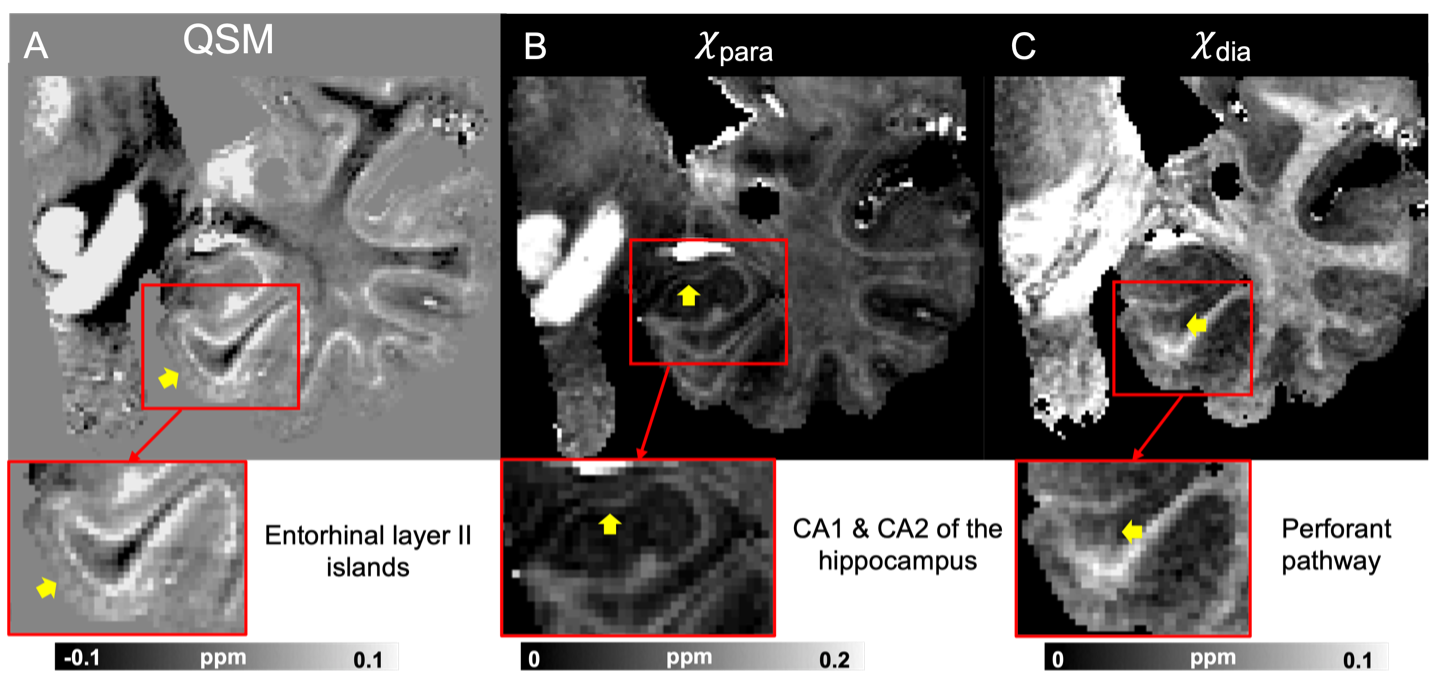
Fig 3. Multi-orientation QSM (A) and the corresponding χpara (B) and χdia (C) maps from the sample in Fig. 2 (HBS002), now in a coronal view, showing the entorhinal cortex in the medium temporal lobe. The red-bounded boxes are zoom-in views to better visualize the microstructures of interest (yellow arrows) including the entorhinal layer II islands (A), CA1 & CA2 of the hippocampus (B) and the perforant pathway (C). The perforant pathway can be better visualized in the χdia map.
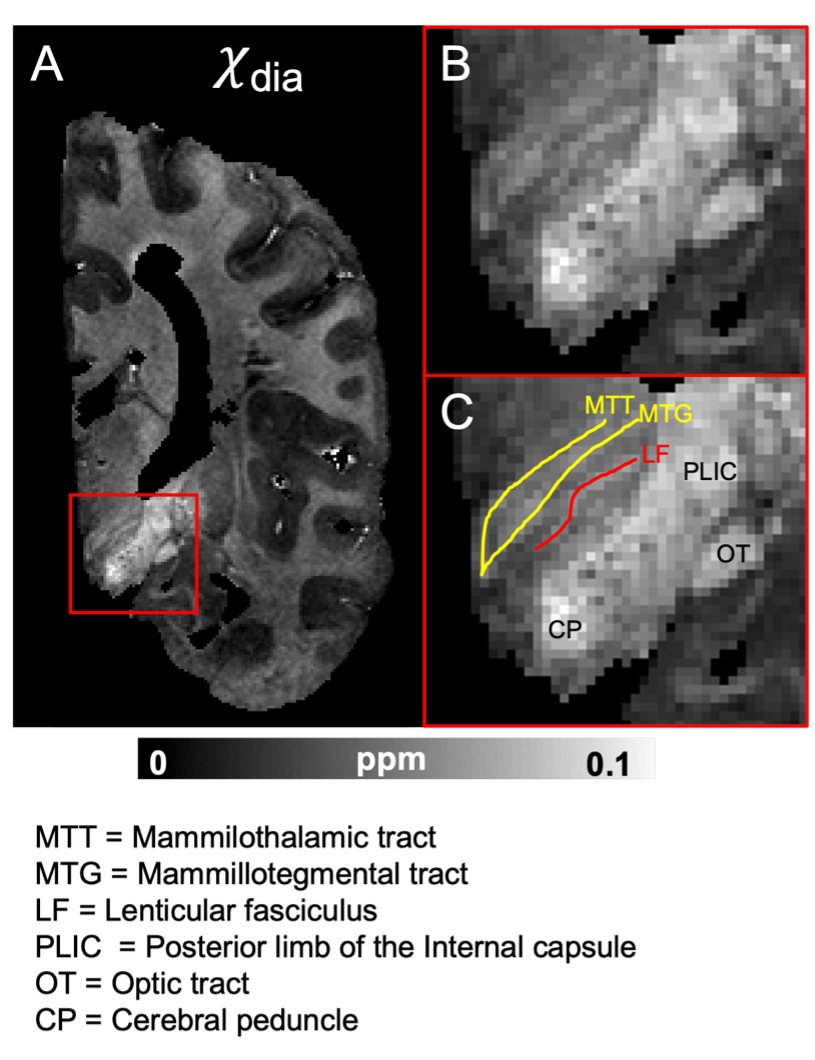
Fig 4. (A) χdia map from the sample in Fig. 2 (HBS002) in a coronal view showing the subthalamic area. The red-bounded boxes (B and C) are zoom-in views to better visualize the subthalamic area. Yellow lines in (C) indicate efferent fibers from the mammillary body to the thalamus including the MTT and MTG. Red line in (C) indicates the pallidothalamic connections. Anatomical abbreviations are listed at the bottom of the figure.
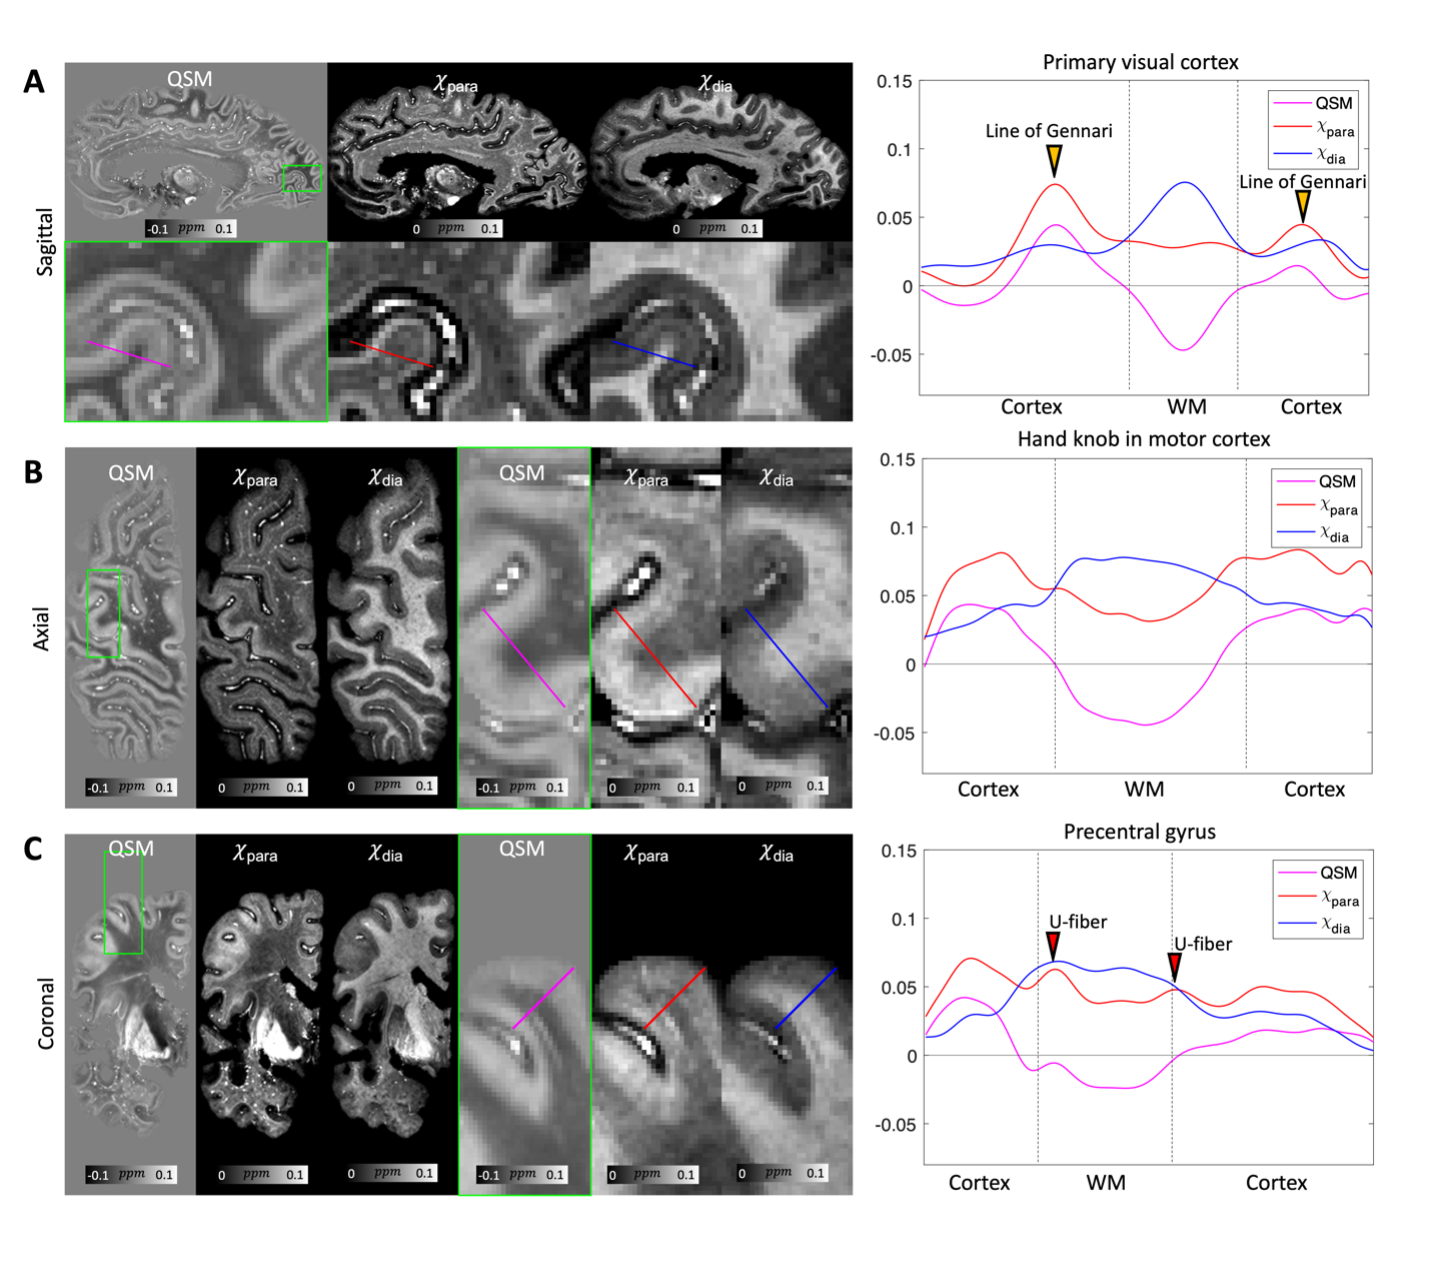
Fig 5. Comparison of multi-orientation QSM, χpara and χdia maps obtained from the sample in Fig. 1 (HBS003) in sagittal (A), axial (B) and coronal (C) views showing different cortical regions. Cortical line profiles of the QSM, χpara and χdia contrasts are shown on the right side illustrating the parameter variations across the primary visual cortex showing the line of Gennari (A), hand knob of motor cortex (B), and the precentral gyrus showing the iron-rich superficial white matter fibers (C), agreeing with previous histological observations21,23,25.