2462
Quantitative susceptibility mapping of brain iron predicts onset of mild cognitive impairment and cognitive decline1Department of Radiology and Radiological Sciences, Johns Hopkins University, Baltimore, MD, United States, 2F.M. Kirby Research Center for Functional Brain Imaging, Kennedy Krieger Institute, Baltimore, MD, United States, 3Department of Neurology, Johns Hopkins University, Baltimore, MD, United States
Synopsis
Keywords: Susceptibility/QSM, Quantitative Susceptibility mapping, cognitive decline
Motivation: Brain iron content may play an important role in the development of Mild Cognitive Impairment (MCI) and dementia due to Alzheimer’s Disease (AD).
Goal(s): To investigate the utility of baseline brain iron levels, measured by quantitative susceptibility mapping (QSM), to predict time to onset of symptoms of MCI and global cognitive decline among older adults with normal cognition at baseline.
Approach: Cox regression models and linear mixed models were used.
Results: Higher brain iron levels in entorhinal cortex and putamen were associated with an earlier time to MCI onset and greater global cognitive decline, independent of the volume and amyloid of those regions.
Impact: Brain iron deposition assessed by QSM MRI may help predict risk of MCI onset and cognitive decline among cognitively normal individuals.
Introduction
Prior evidence suggests that elevated brain iron levels, especially in the hippocampus, are associated with lower cognitive performance among cognitively normal older adults1, independent of the volume and amyloid of those regions. However, the potential of brain iron as predictor of cognitive decline over time and risk of MCI symptom onset remains unclear. This study investigated the effect of brain iron levels, measured with quantitative susceptibility mapping (QSM)-MRI, brain volume, and β-amyloid load on the time to clinical symptom onset of MCI, as well as on longitudinal prospective cognitive trajectories.Methods
Analyses included baseline MRI data from 158 BIOCARD study participants with normal cognition at the baseline.2,3 Among them, 91 participants (PET group) underwent 11C-PiB PET and distribution volume ratio (DVR) images were calculated.4 Participant received annual consensus diagnoses (i.e., cognitively normal, impaired not MCI, MCI, or dementia) and completed annual comprehensive neuropsychological assessments, from which a global cognitive composite score was calculated2 (mean clinical and cognitive follow-up time of 5 years (max = 7 years)).Participants were scanned on a 3T Philips scanner using a 3D multi-echo GRE sequence (TR/TE1/∆TE = 40/6/6 ms, 5 unipolar echoes, voxel size = 1×1×1 mm3). QSM processing involved best-path based phase unwrapping5, VSHARP-background field removal6 and SFCR+07. Twelve ROIs in superior-and-middle frontal gyrus (SMF), inferior and orbital frontal gyrus (IOF), parietal, temporary, occipital and entorhinal cortex (ENT), cingulate, amygdala, hippocampus, caudate nucleus, putamen and globus pallidus were automatically segmented based on T1 and QSM human brain atlases1.
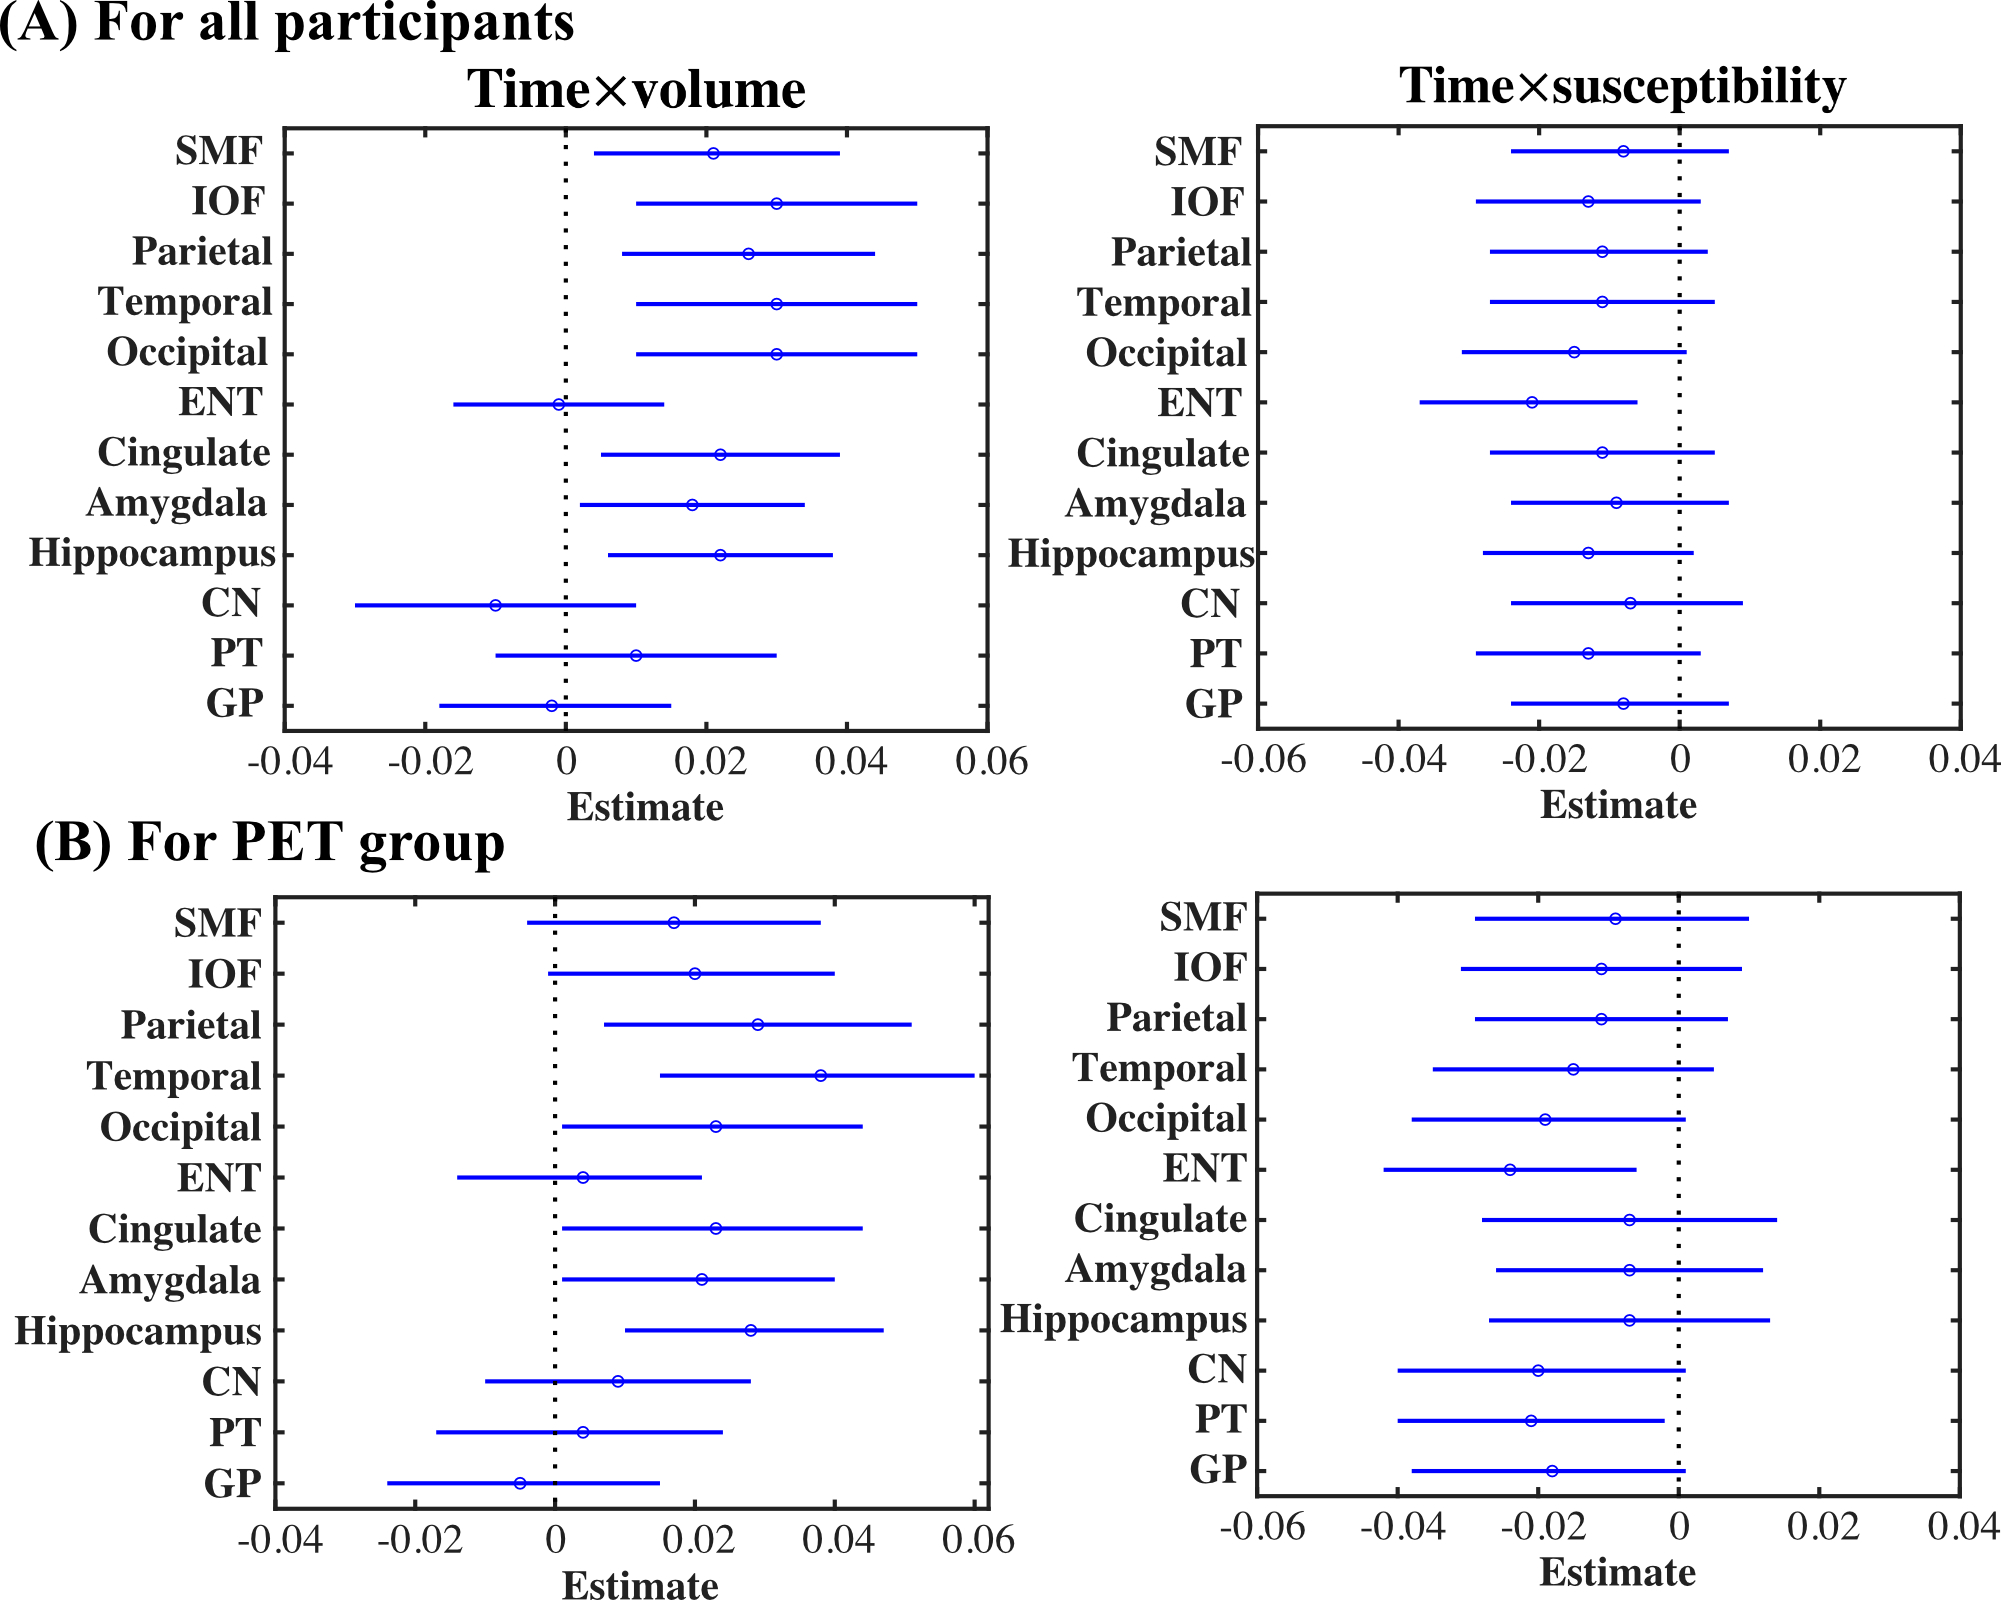
Cox regression models were used to examine the association between baseline MRI parameters (i.e., susceptibility, volume and DVR) and time to MCI symptom onset. Linear mixed models were used to test the association of susceptibility values and volumes with level and change in the global cognitive score over time. All models included terms of baseline age, sex, years of education, baseline volume and baseline susceptibility values. Linear mixed models additionally included a term for follow-up time, and the interaction (cross-product) of each predictor with time. All models were rerun in the PET group with baseline DVR as an extra predictor (and a DVR× time predictor in the mixed models). Benjamini-Hochberg corrections for 12 comparisons were performed with false discovery rate of 0.25.
Results
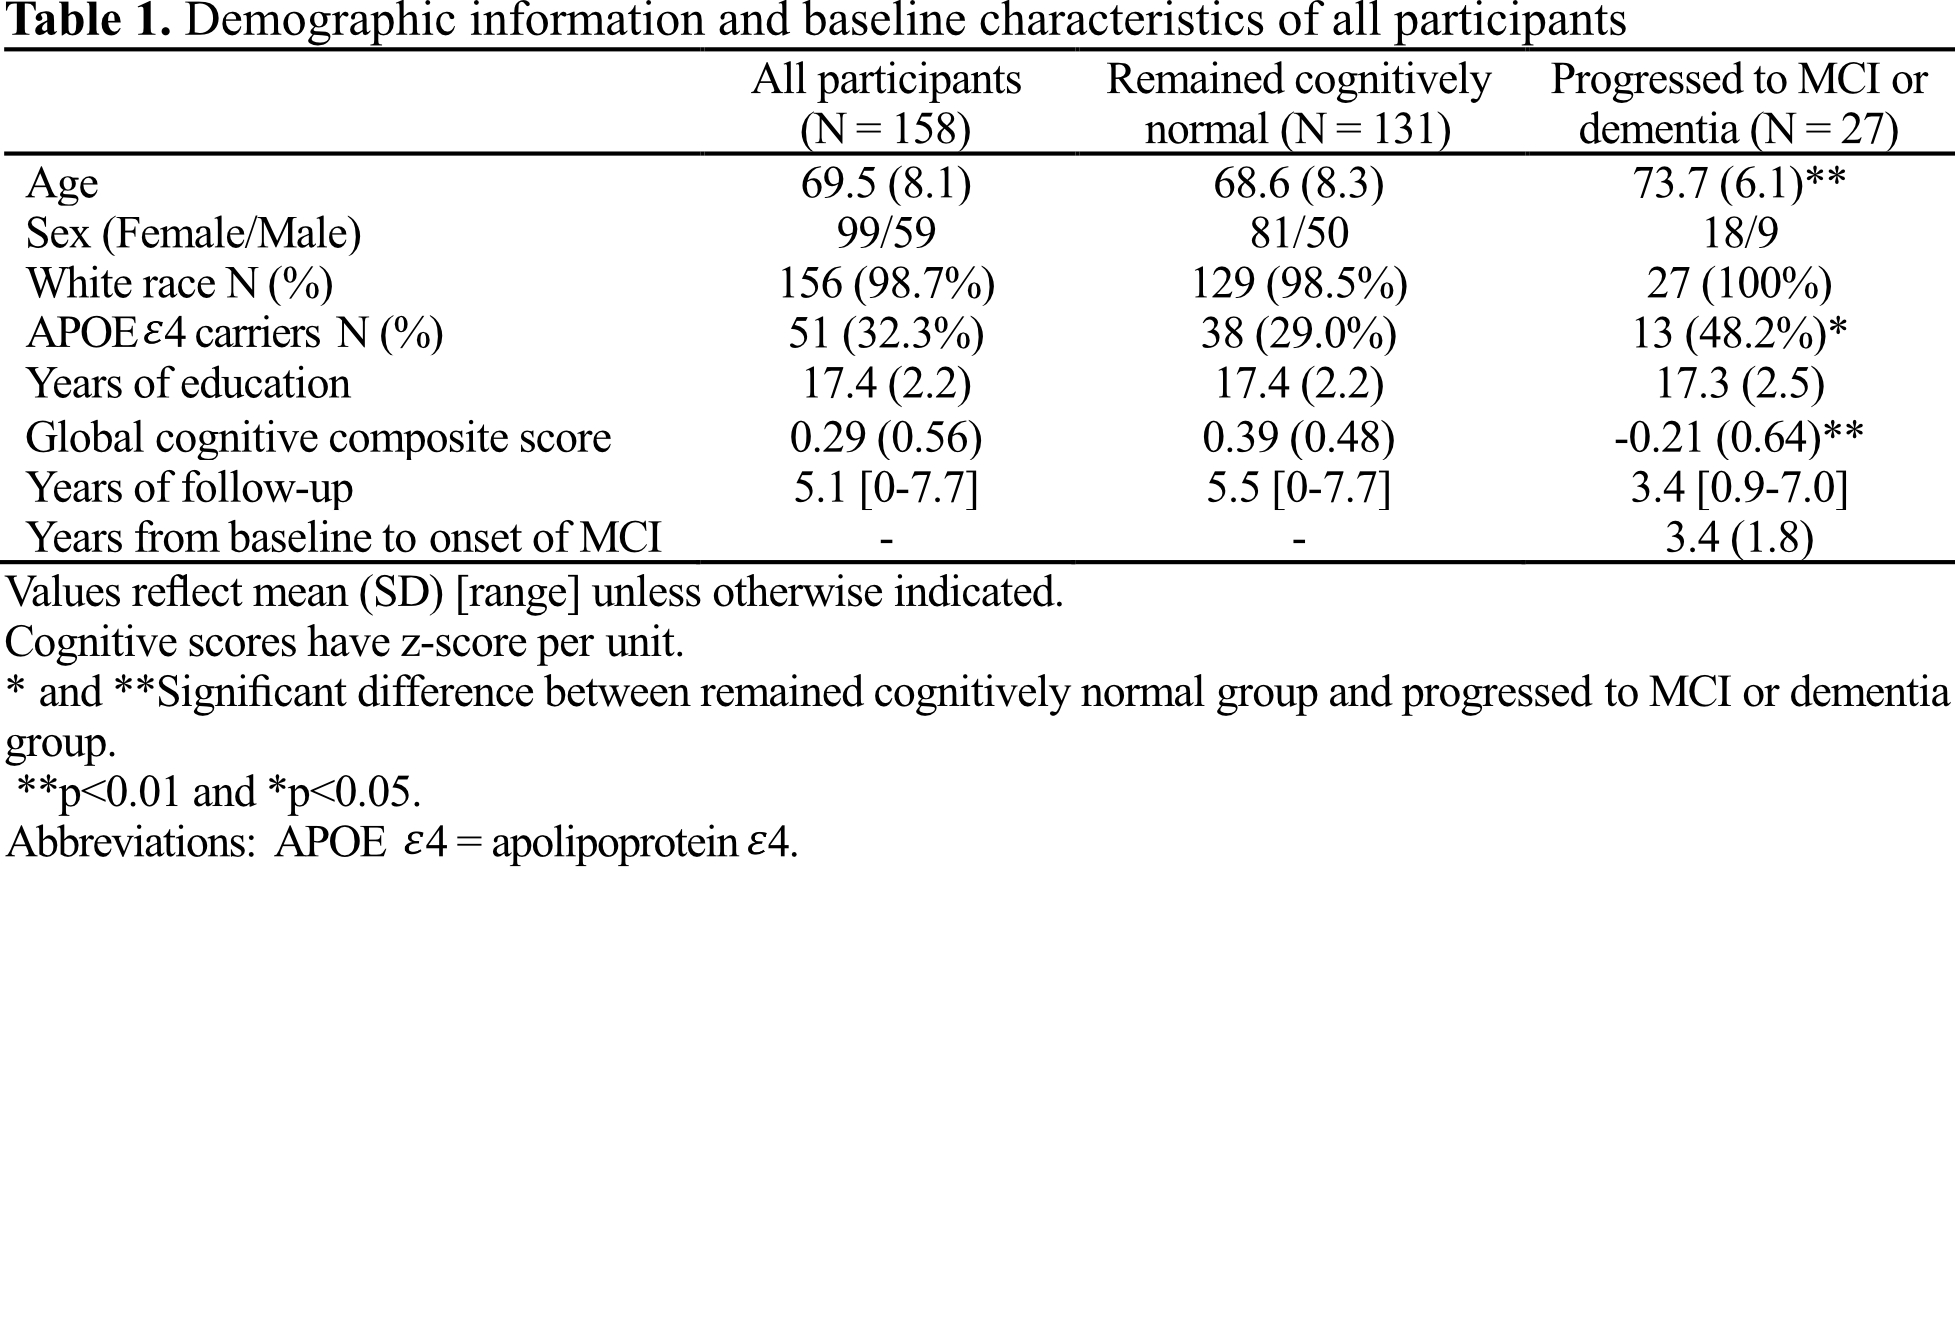
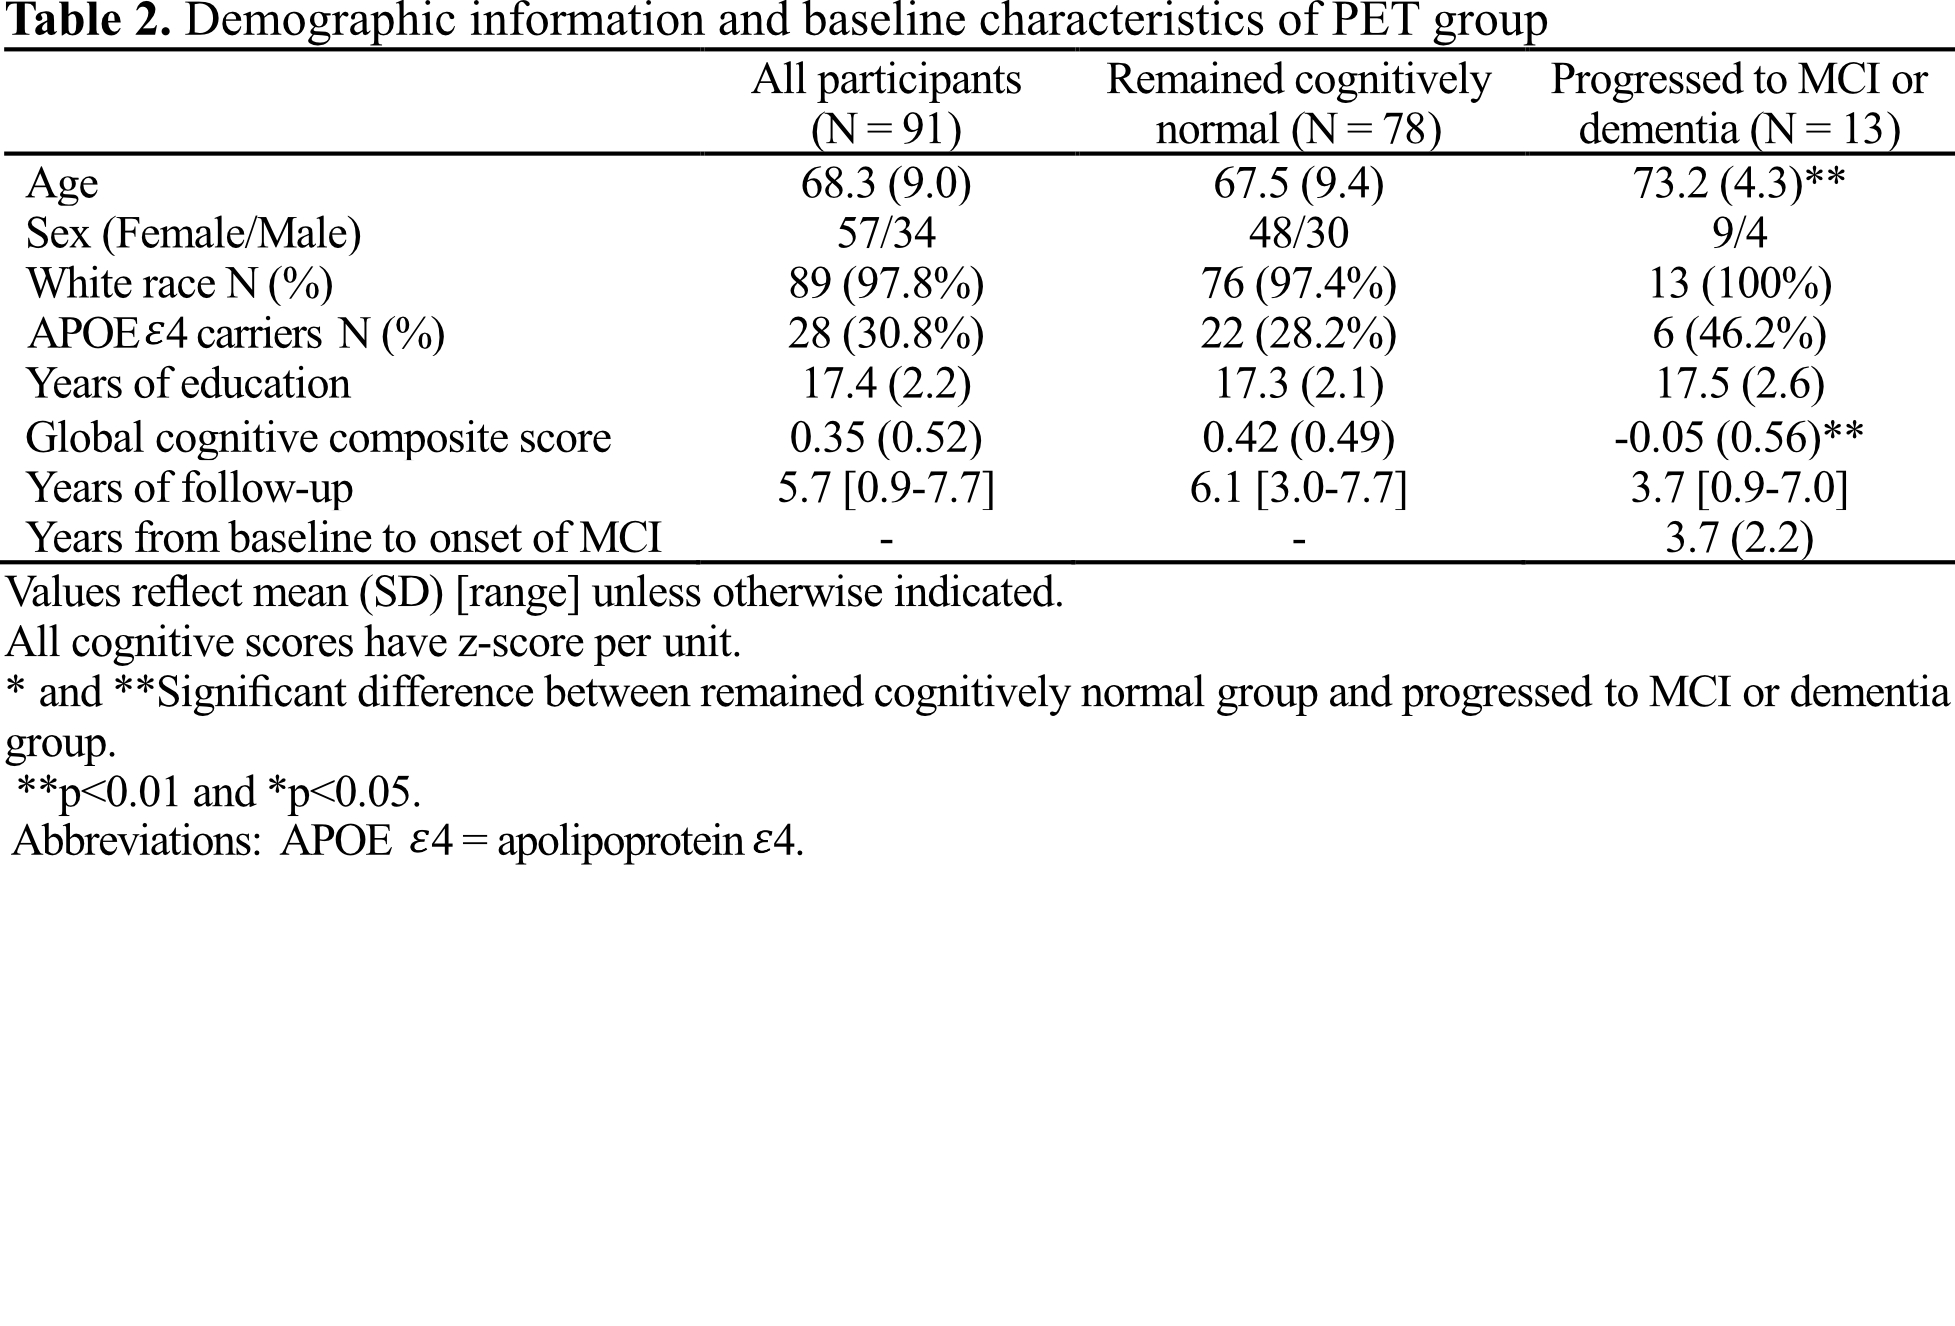
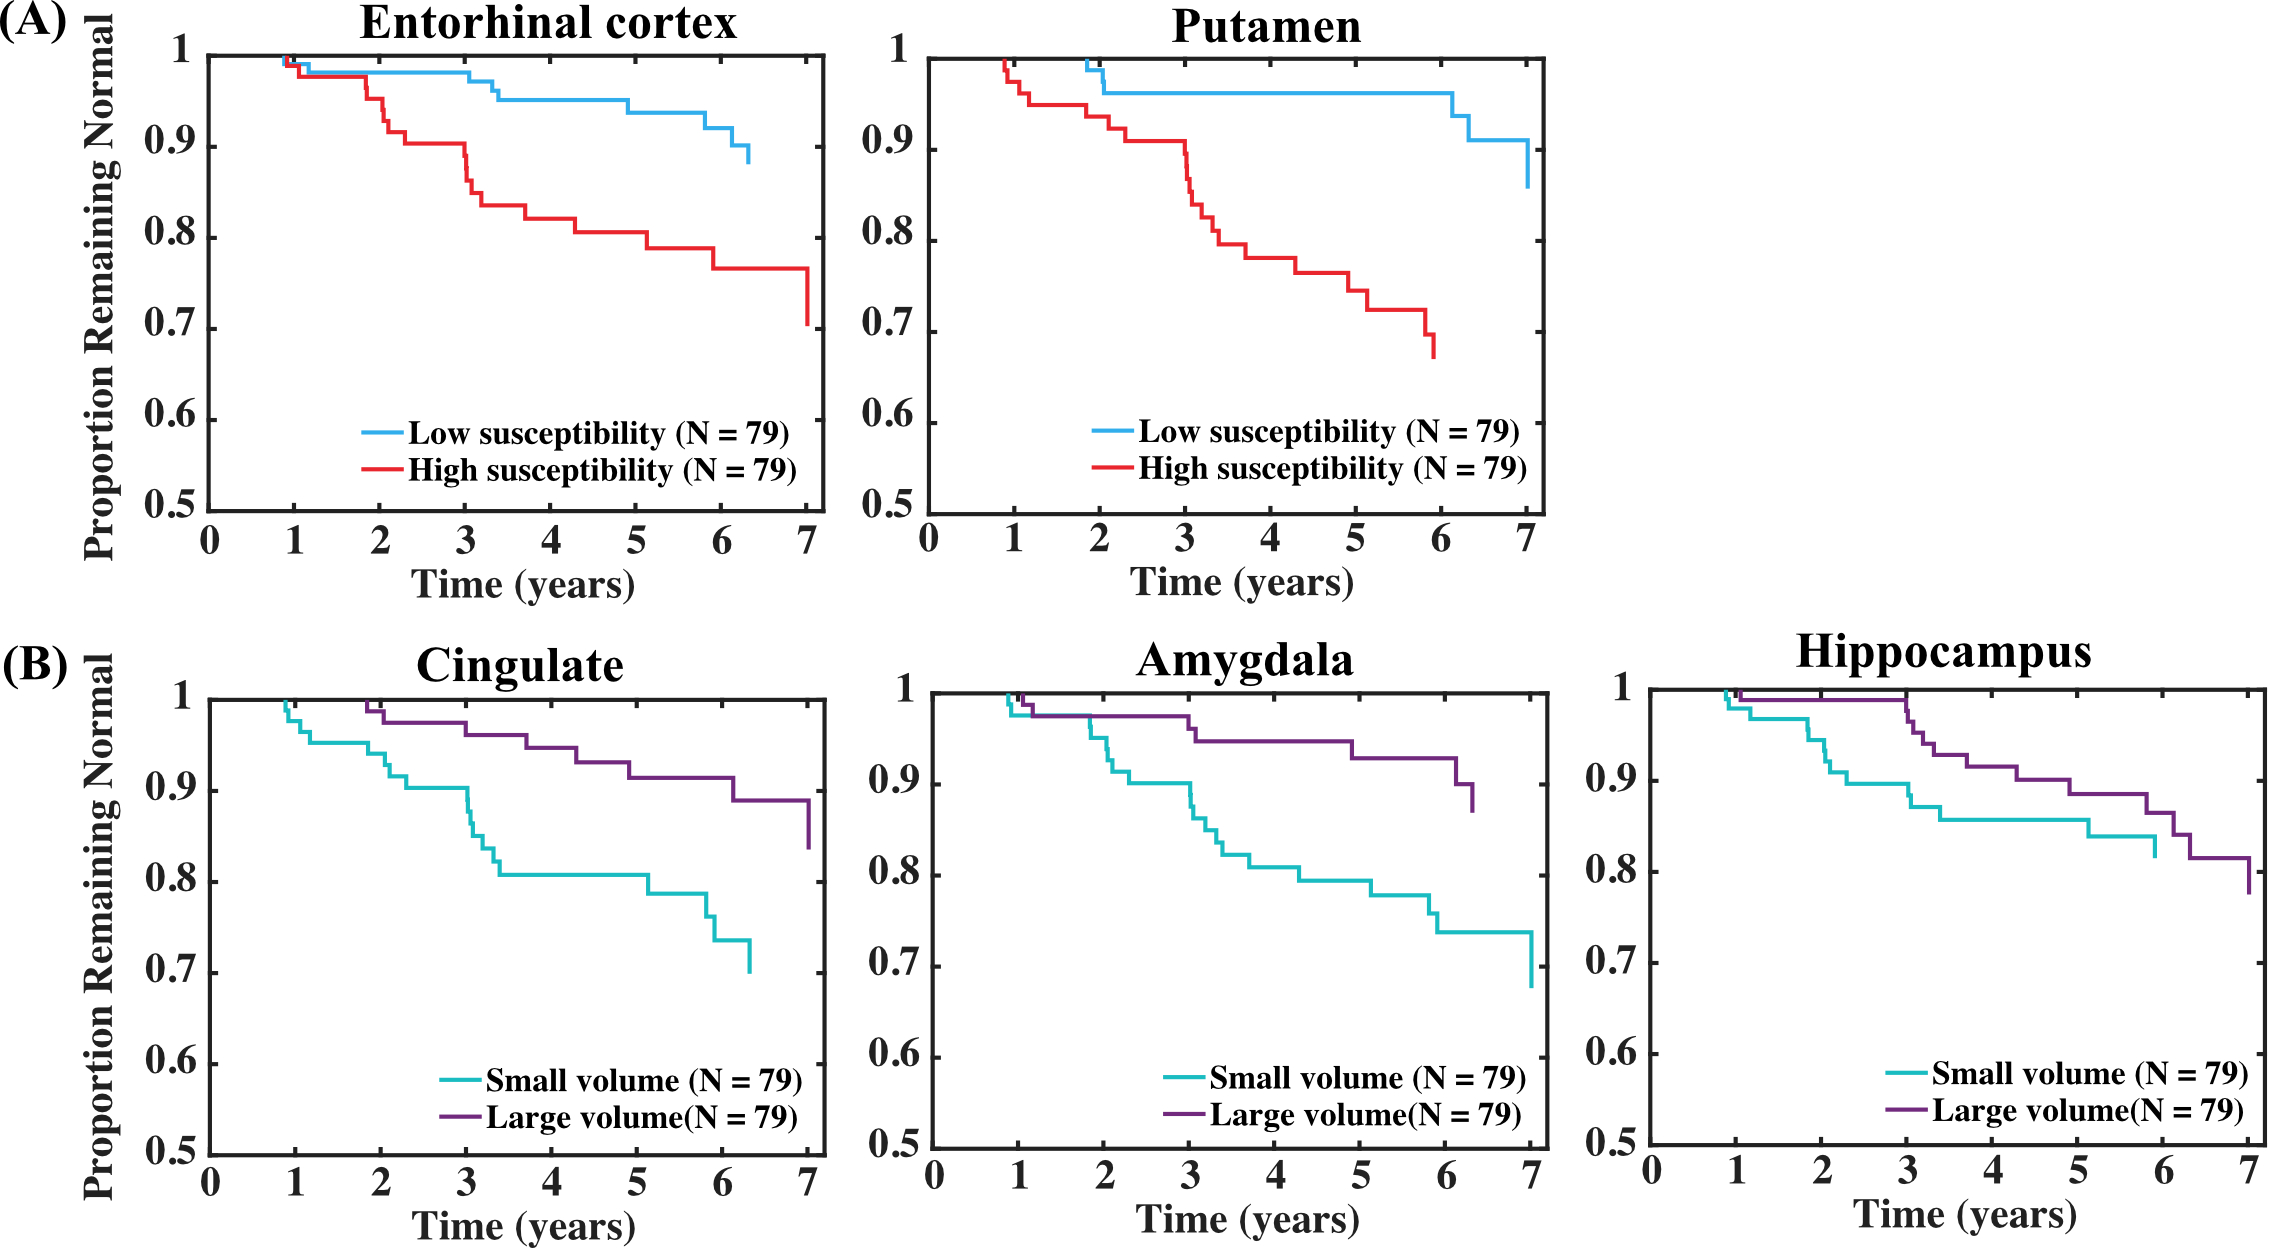
Baseline characteristics of participants and the PET subgroup can be found in Tables 1 and 2, respectively.In all participants, high susceptibility in ENT [Hazard ratio, HR (95% confidence interval, CI) = 2.07 (1.26, 3.40), p = 0.004] and putamen [HR (95% CI) = 1.58 (1.07, 2.33), p = 0.02] was associated with increased risk of MCI onset (Fig. 1A). The association of high susceptibility in ENT and earlier time to MCI onset remained significant in the PET group [HR (95% CI) = 3.41 (1.49, 7.79), p = 0.004], suggesting it is independent of regional amyloid burden. Significant associations between smaller ROI volumes and faster time to onset of MCI were found for cingulate [HR (95% CI) = 0.59 (0.37, 0.93), p = 0.02], amygdala [HR (95% CI) = 0.64 (0.45, 0.93), p = 0.02] and hippocampus [HR (95% CI) = 0.66 (0.44, 0.99), p = 0.044] (Fig. 1B). Association between hippocampal volume and MCI onset was significant in the PET group [HR (95% CI) = 0.60 (0.36, 0.99), p = 0.046].
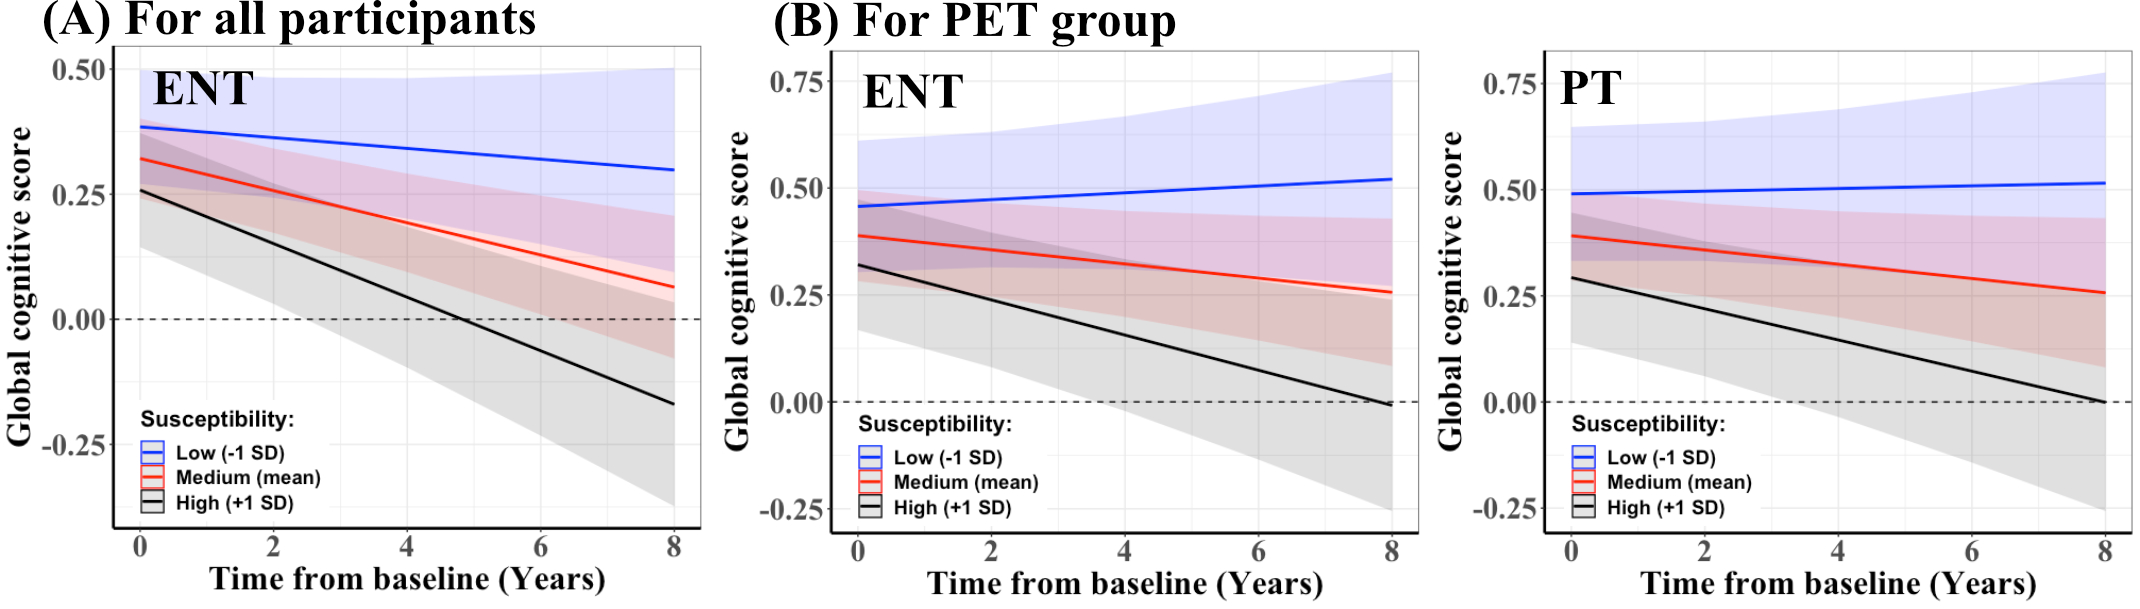
In linear mixed models including all participants, greater baseline susceptibility in ENT [β (SE) = -0.021 (0.008), p = 0.008] was associated with greater decline over time in the global cognitive score (Fig. 2A). Similarly, in the PET subgroup, greater susceptibility in ENT [β (standard error, SE) = -0.025 (0.010), p = 0.01] and putamen [β (SE) = -0.021 (0.010), p = 0.04] (Fig. 2B) were predictive of greater decline in the global cognitive score, independent of amyloid load in these regions. Additionally, among all participants, smaller volumes of hippocampus [β (SE) = 0.022 (0.008), p = 0.007], amygdala [β (SE) = 0.019 (0.008), p = 0.02] and all cortical ROIs (except in ENT) were associated with greater global cognitive decline (Fig. 3A). Results were similar for the PET subgroup (Fig. 3B). Regional β-amyloid load showed no association with global cognition over time in all ROIs.
Discussion and conclusion
To our knowledge, this is the first study to show that elevated iron load in ENT and putamen are significant predictors of time to onset of MCI and of global cognitive decline, independent of regional volumes and amyloid burden. Regional iron load may be a valuable prognostic marker during preclinical AD that provides additive and independent prediction of MCI onset among individuals who are cognitively normal.Acknowledgements
This work was supported by NIBIB (P41EB031771) and NIA (R03AG065527, R01AG063842).References
1. Chen L, Soldan A, Oishi K, et al. Quantitative susceptibility mapping of brain iron and β-amyloid in MRI and PET relating to cognitive performance in cognitively normal older adults. Radiology. 2021;298(2):353-362.
2. Albert M, Soldan A, Gottesman R, et al. Cognitive changes preceding clinical symptom onset of mild cognitive impairment and relationship to ApoE genotype. Curr Alzheimer Res. 2014;11(8):773-784.
3. Soldan A, Pettigrew C, Cai Q, et al. Cognitive reserve and long-term change in cognition in aging and preclinical Alzheimer’s disease. Neurobiol Aging. 2017;60:164-172.
4. Zhou Y, Resnick SM, Ye W, et al. Using a reference tissue model with spatial constraint to quantify [11C]Pittsburgh compound B PET for early diagnosis of Alzheimer’s disease. Neuroimage. 2007;36(2):298-312. doi:10.1016/j.neuroimage.2007.03.0045.
5. Abdul-Rahman HS, Gdeisat MA, Burton DR, Lalor MJ, Lilley F, Moore CJ. Fast and robust three-dimensional best path phase unwrapping algorithm. Appl Opt. 2007;46(26):6623-6635.
6. Schweser F, Deistung A, Lehr BW, Reichenbach JR. Quantitative imaging of intrinsic magnetic tissue properties using MRI signal phase: an approach to in vivo brain iron metabolism? Neuroimage. 2011;54(4):2789-2807.
7. Bao L, Li X, Cai C, Chen Z, van Zijl PCM. Quantitative susceptibility mapping using structural feature based collaborative reconstruction (SFCR) in the human brain. IEEE Trans Med Imaging. 2016;35(9):2040-2050.
Figures