2461
Optimized 7-Tesla QSM reconstruction: Clinical feasibility1BioMedical Engineering and Imaging Institute, Icahn School of Medicine at Mount Sinai, New York, NY, United States, 2Institute of Biomedical Engineering, Bogarziçi University, Istanbul, Turkey
Synopsis
Keywords: Susceptibility/QSM, Quantitative Susceptibility mapping
Motivation: Quantitative Susceptibility Mapping (QSM) at 7-Tesla (7T) has been implicated to improve assessment of neurodegenerative disorders but has yet to be integrated into clinical practice.
Goal(s): We aimed to address the growing demand for a standardized and optimized QSM reconstruction protocol that enables accurate quantification of susceptibility, mitigates contaminating artifacts, and is clinically feasible.
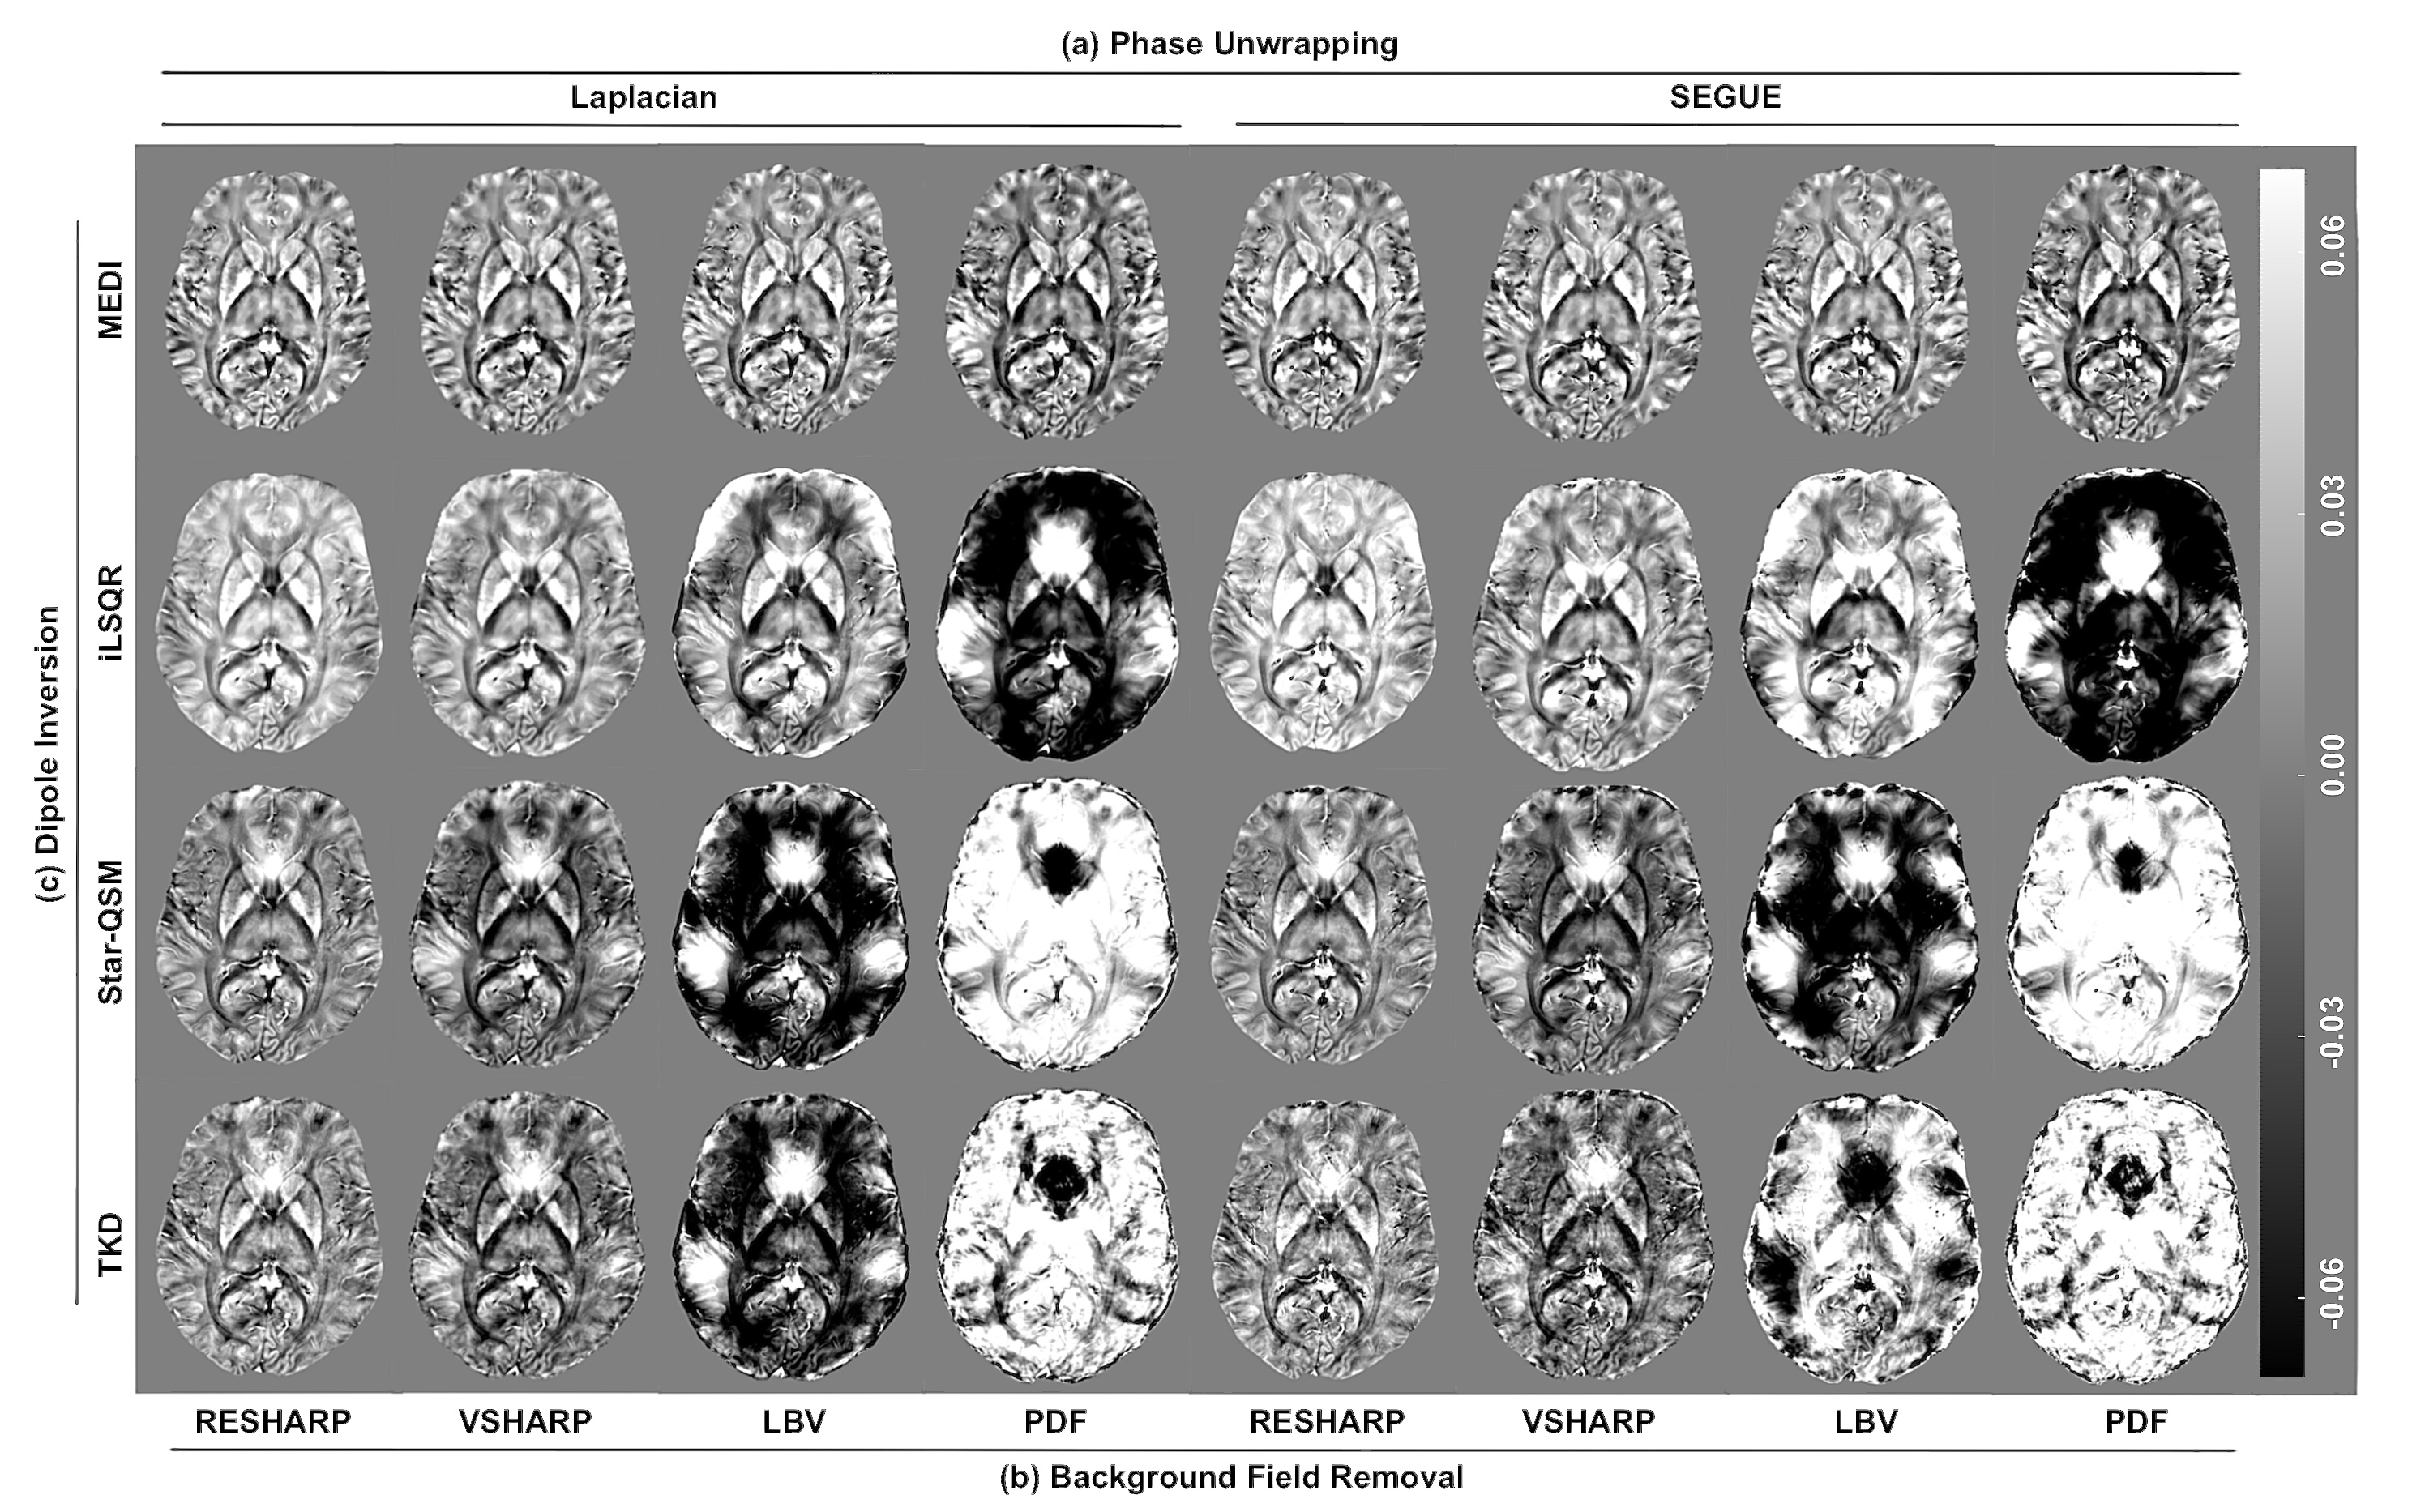
Approach: Here, we compared 32 end-to-end QSM processing pipelines and evaluated their performance.
Results: We show that reconstruction with Laplacian phase-unwrapping, RESHARP background field removal, and MEDI dipole inversion outperformed other pipelines in suppressing artifacts.
Impact: Our optimized pipeline results in a 7T QSM reconstruction with clear cortical and subcortical boundaries, and mitigates susceptibility artifacts. Furthermore, the comprehensive review of QSM processing algorithms highlights Laplacian, RESHARP, and MEDI as robust algorithms with reliable, consistent performance.
Introduction
Quantitative Susceptibility Mapping (QSM) is a non-invasive magnetic resonance imaging (MRI) technique that allows for the detection of magnetic susceptibility differences between tissue, iron, myelination, and calcification products1,2. The ability to elucidate underlying sources of susceptibility makes QSM particularly useful in assessment of neurodegenerative disorders3,4. QSM at 7-Tesla (7T) offers further clinical advantages including increased signal-to-noise ratio (SNR) and contrast-to-noise ratio (CNR) that result in improved image quality5. While high image resolutions and higher susceptibility at 7T MRI contribute to accurate QSM calculations6, artifacts from background field inhomogeneities and poor reconstruction can contaminate and diminish the quality of QSM maps7.Clinical integration of QSM requires a robust, yet simple reconstruction pipeline. Various QSM phase-unwrapping, background field removal, and dipole inversion algorithms have been implemented for idiosyncratic data sets, but a consensus pipeline has yet to be proposed. Because QSM quality and accuracy are highly dependent on the pipeline used8, optimizing the choice of algorithms for each step of reconstruction is necessary.
In this study, we explore optimization of 7T QSM resolution and processing pipeline. From our results, we propose an optimized QSM pipeline for imaging at 7T.
Methods
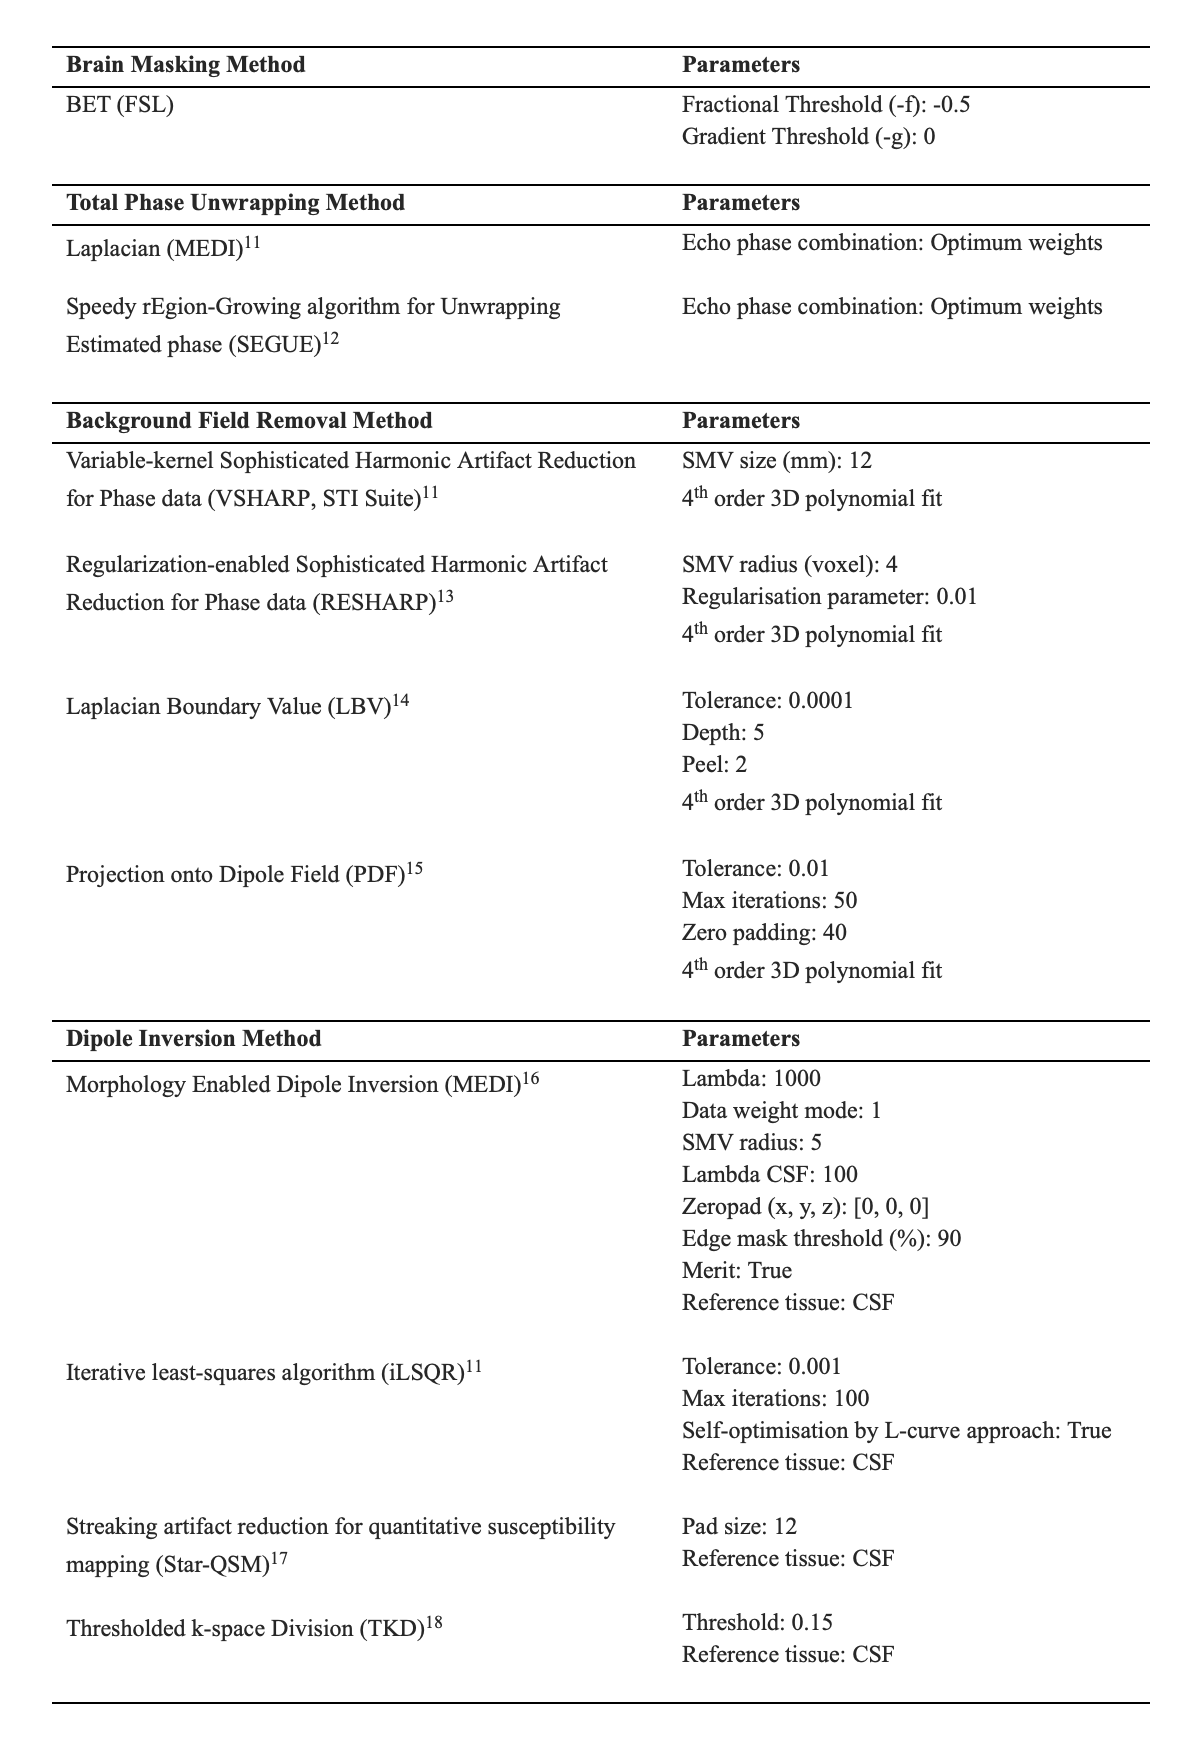
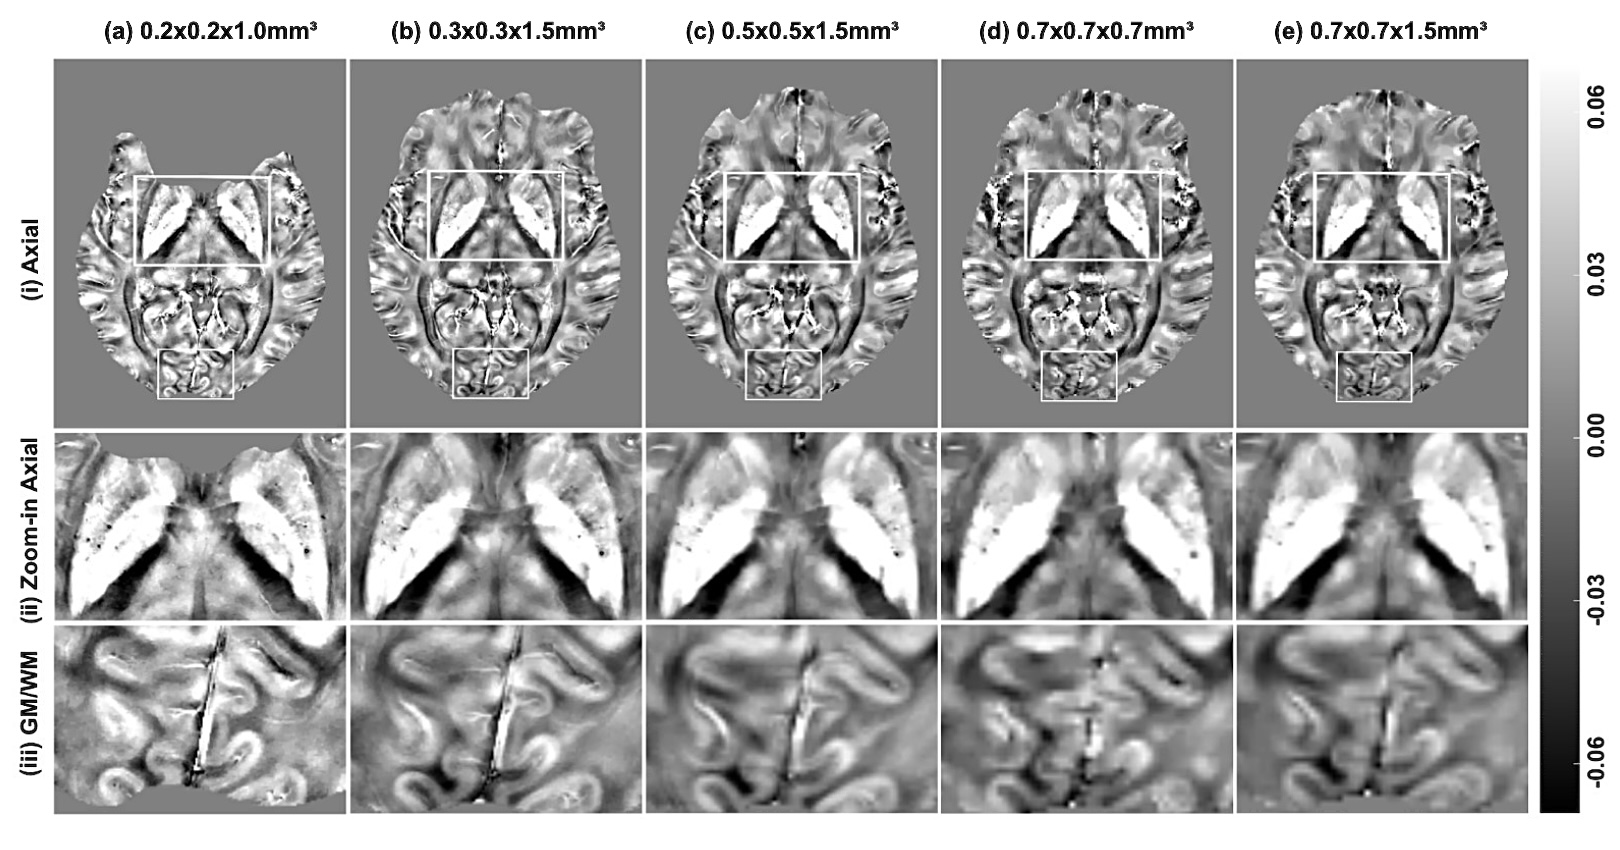
QSM reconstruction was performed in Matlab R2020b (Mathworks, Natick, USA) using the SEPIA toolbox (v1.2.2.4)9 on a macOS (2.3 GHz 8-Core Intel Core i9 CPU, 32GB RAM). Brain masking was performed with the BET tool of FSL Software Library10. A total of 32 reconstruction pipelines were generated for comparison from combinations of two phase-unwrapping techniques, four background field removal methods, and four dipole inversion techniques. Algorithm parameters were kept consistent across all pipelines and are detailed in Table 1.Multi-echo brain images were acquired in 5 healthy volunteers aged 30±5 years. Scanning was conducted on a 7T MRI Siemens (Magnetom, Siemens Healthineers, Erlangen, DE) system using a 1Tx/32Rx Nova head coil and a 3D high-resolution GRE sequence. The sequence parameters are as follows: 6 echoes, TE1:ΔTE :TEmax = 4:4:24 ms, TR = 32 ms, flip angle = 12°, partial Fourier factor = 0.75, with a GRAPPA acceleration factor = 2. To investigate the effect of spatial resolution on QSM, scans from one subject were obtained at five resolutions: 0.2mm, 0.3mm, 0.5mm, 0.7mm in-plane resolution with slice thicknesses of 1.0mm and 1.5mm, and 1.5mm isotropic resolution.
Final QSM maps were visually examined, and performance was evaluated for image quality, presence of artifacts, and signal uniformity. Six major iron-enriched structures were chosen including the red nucleus (RN), substantia nigra (SN), globus pallidus (GP), caudate nucleus (CN), putamen (PT), and dentate nucleus (DN). We manually segmented the mentioned regions of interest (ROIs) based on non-susceptible anatomic reference sequences. Susceptibility values were referenced to mean susceptibility values of cerebral spinal fluid (CSF).
Results
QSM maps acquired at 0.3mm in-plane resolution exhibited clearer delineation of brain structures and cortical gray/white-matter boundaries than those obtained at lower resolutions. In contrast, scanning at 0.2mm in-plane resolution resulted in noise amplification. It should be noted that FSL BET performed suboptimally at this resolution, as seen by erosion in the ROIs.Reconstruction with Laplacian phase unwrapping, RESHARP background field removal, and MEDI dipole inversion in tandem yielded homogenous susceptibility maps with minimal susceptibility artifacts. Visual differences in QSM maps between Laplacian and SEGUE phase-unwrapping were indiscernible, except at air-tissue interfaces in the cerebellum, which resulted in decreased signal in the dentate nucleus. Background field removal algorithms greatly influenced pipeline performance. VSHARP and RESHARP produced the least artifacts, while pipelines incorporating LBV and PDF suffered from significant residual background fields and shading artifacts. Out of the SHARP variants, RESHARP achieved slightly more homogenous maps at the cost of contrast suppression and brain erosion. MEDI was the most robust of the dipole inversion techniques, yielding consistent visually appealing maps and demonstrating compatibility with nearly all algorithms. Nevertheless, boundary loss and global smoothing was evident in these susceptibility maps. iLSQR and TKD results showed prominent overexposure artifacts near the brain edge and amplified noise, respectively. Star-QSM performance was similar to TKD, however it produced maps with the greatest cortical detail and clarity.
Discussion and Conclusion
In this study, we provided a qualitative comparison of various QSM reconstruction pipelines and demonstrate a robust implementation using Laplacian-RESHARP-MEDI algorithms. The integration of these algorithms yielded susceptibility maps with clear boundary delineation, high QSM signal, and the fewest susceptibility artifacts. The merits of other pipelines include whole brain recovery (SEG-PDF-MEDI), sub-10-minute computation time and enhanced cortical/subcortical detail (Laplacian-RESHARP-Star-QSM), and high SNR and CNR (Laplacian-VSHARP-MEDI). Our results can serve as points of reference for future QSM optimization efforts.Acknowledgements
The authors would like to thank research coordinators Sarah Binder and Aislinn Diaz helping with the recruitment. This study was supported by a Developmental Project award from Mount Sinai ADRC (P30 AG066514) NIA/NIH and K01 AG075178-01 NIA/NIH grants.References
1. Langkammer, C., Schweser, F., and Krebs, N. et al. (2012) Quantitative susceptibility mapping (QSM) as a means to measure brain iron? A post mortem validation study. NeuroImage; 62(3):1593-1599
2. Wang, Y. and Liu, T. (2015) Quantitative susceptibility mapping (QSM): Decoding MRI data for a tissue magnetic biomarker. Magnetic Resonance in Medicine; 73(1):82-101
3. Acosta-Cabronero, J., Williams, G. B., and Cardenas-Blanco, A. et al. (2013) In Vivo Quantitative Susuceptibility Mapping (QSM) in Alzheimer’s Disease. PLOS ONE; 8(11):e81093
4. Ravanfar, P., Loi, S. M., and Syeda, W. T. et al. (2021) Systematic Review: Quantitative Susceptibility Mapping (QSM) of Brain Iron Profile in Neurodegenerative Diseases. Frontiers in Neuroscience; 14:618435
5. Spincemaille, P., Anderson, J., and Wu, G. et al. (2019) Quantitative Susceptibility Mapping: MRI at 7T versus 3T. Journal of Neuroimaging; 30(1):65-75
6. Mattern, H., Sciarra, A., and Lüsebrink, F. et al. (2019) Prospective motion correction improves high-resolution quantitative susceptibility mapping at 7T. Magnetic Resonance in Medicine; 81(3):1605-1619
7. Ngo, G. C., Bilgic, B., and Gagoski, B. A. et al. (2019) Correction of magnetic field inhomogeneity effects for fast quantitative susceptibility mapping. Magnetic Resonance in Medicine; 81(3):1645-1658
8. QSM challenge 2.0 Organization Committee, Bilgic, B., and Langkammer, C. et al. (2021) QSM reconstruction challenge 2.0: Design and report of results. Magnetic Resonance in Medicine; 86(3):1241-1255
9. Smith, S. M. (2002) Fast robust automated brain extraction. Human Brain Mapping; 17:143-155
10. Chan, K. S. and Marques, J. P. (2021) SEPIA-Susceptibility mapping pipeline tool for phase images. NeuroImage; 227:117611.
11. Wei, L., Bing, W., and Liu, C. (2011) Quantitative susceptibility mapping of human brain reflects spatial variation in tissue composition. NeuroImage; 55(4):1645-1656
12. Karsa, A. and Shmueli K. (2019) SEGUE: A Speedy rEgion-Growing Algorithm for Unwrapping Estimated Phase. IEEE Transactions on Medical Imaging; 38(6):1347-1357
13. Sun, H. and Wilman, A. H. (2013) Background field removal using spherical mean value filtering and Tikhonov regularization. Magnetic Resonance in Medicine; 71(3):1151-1157
14. Zhou, D., Liu, T., and Spincemaille, P. et al. (2014) Background field removal by solving the Laplacian boundary value problem. NMR in Biomedicine; 27(3):312-319
15. Liu, T., Khalidov, I., and Rochefort, L. et al. (2011) A novel background field removal method for MRI using projection onto dipole fields (PDF). NMR in Biomedicine; 24(9):1129-1136
16. Liu, Z., Spincemaille, P., and Yao, Y. et al. (2017) MEDI+0: Morphology enabled dipole inversion with automatic uniform cerebrospinal fluid zero reference for quantitative susceptibility mapping. Magnetic Resonance in Medicine; 79(5):2795-2803
17. Wei, H., Dibb, R., and Zhou. Y. et al. (2015) Streaking artifact reduction for quantitative susceptibility mapping of sources with large dynamic range. NMR in Biomedicine; 28(1):1294-1303
18. Wharton, S., Schäfer, A., and Bowtell, R. (2010) Susceptibility mapping in the human brain using threshold-based k-space division. Magnetic Resonance in Medicine; 63(5):1292-1304
Figures