2460
In-vivo high-resolution χ-separation (chi-separation) at 7T1Department of Electrical and Computer Engineering, Seoul National University, Seoul, Korea, Republic of, 2Department of Radiology, Johns Hopkins University School of Medicine, Baltimore, MD, United States, 3F.M. Kirby Research Center for Functional Brain Imaging, Kennedy Krieger Institute, Baltimore, MD, United States, 4Center for Neuroscience Imaging Research (CNIR), Institute for Basic Science (IBS), Suwon, Korea, Republic of, 5Department of Biomedical Engineering, Sungkyunkwan University, Suwon, Korea, Republic of
Synopsis
Keywords: Susceptibility/QSM, Susceptibility, High-resolution anatomy
Motivation: High-resolution χ-separation at 7T can delineate detailed structures related to iron and myelin concentrations in the brain. However, it has the challenge of requiring an R2 map, which is not practical at 7T due to SAR and scan time.
Goal(s): Our objective is to generate high-resolution χ-separation maps at 7T.
Approach: An R2* 7T-to-3T conversion network to transform a 7T R2* map into its 3T counterpart is developed. Then, 𝜒-separation is processed via QSMnet, χ-sepnet-R2*, and resolution generalization.
Results: We successfully produced high-quality and high-resolution 𝜒-separation maps only from multi-echo gradient echo data at 7T.
Impact: This study suggests a solution for the technical challenge of requiring R2 map in 7T χ-separation, enabling high-resolution (=650 um) χ-separation. This may benefit the analysis of iron and myelin concentration changes in various neurodegenerative diseases through detailed structural examination.
Introduction
χ-separation (chi-separation)1 can separate paramagnetic and diamagnetic susceptibility distributions related to iron and myelin, respectively.2-5 A combination of this technique and 7T imaging can benefit from increased SNR and susceptibility effects, potentially providing sub-millimeter resolution maps for brain structures.6-8 However, χ-separation requires an R2 map, which is challenging to acquire due to high SAR, B1-inhomogeneities, and long scan time (tens of minutes). Recently, a neural network, χ-sepnet-R2*, was developed to remove the necessity for R2 but it is designed to work for 3T R2*. Therefore, further work is required to utilize 7T data (i.e., R2* and local field).This study aims to produce in-vivo high-resolution χ-separation maps at 7T. To achieve this, we introduce a new pipeline that includes a novel neural network, R2* 7T-to-3T conversion network, which converts 7T R2* to 3T R2*, QSMnet, χ-sepnet-R2*, and resolution generalization approach11.
Methods
Ten subjects were scanned at 3 and 7 Tesla (Siemens Tim Trio and Terra, Erlangen, Germany). Sequences include multi-echo GRE, multi-echo SE, and MPRAGE at 3T, and multi-echo GRE at 7T (Table 1; IRB-approved). Note that acquiring multi-echo SE at 7T was not feasible due to a long scan time (~ 20 min). Local field12-13, R214, and R2*15 maps are generated by processing acquired data.Since 𝜒-sepnet-R2* is trained with 3T R2*, a 7T R2* needs to be converted to that of 3T. This is achieved by an R2* 7T-to-3T conversion network. A dataset of ten 3T-7T R2* pairs was used (train:validation:test=5:1:4)16. The network is trained to take 7T R2* maps as inputs and 3T R2* maps as labels, utilizing 3D U-net with L1 and gradient losses (Figure 2a).
For high-resolution χ-separation at 7T, firstly, a QSM map is reconstructed from a local field map using QSMnet with resolution generalization method11. Secondly, the 7T R2* map is converted using the R2* 7T-to-3T conversion network. Lastly, the QSM and converted R2* maps are applied to 𝜒-sepnet-R2* with resolution generalization method, creating χ-separation maps (Figure 1).
The results of the conversion network are evaluated with respect to a 3T R2* map using NRMSE and SSIM. For χ-separation maps, three methods are compared: i) proposed pipeline, ii) 𝜒-sepnet-R2* with a linearly-scaled 7T R2* map (by B0) as R2* input17 (Figure 1c), and iii) 𝜒-sepnet-R2* with a 3T R2* map as R2* input (Figure 1d; not practical because 3T data required). These results are evaluated using χ-separation-COSMOS17 maps at 3T as reference. The comparison utilizes NRMSE, SSIM, and χ-separation atlas-based ROI anlaysis19. The laminar profile4 of a middle frontal sulcus is conducted in the χ-separation, QSM, and R2* maps (interpolated×4).
Results
In Figure 2, 7T R2* maps, outputs from R2* 7T-to-3T conversion network, and 3T R2* maps are compared. The 3T R2* maps and the network output maps exhibit similar contrasts (NRMSE: 26±4.3%, and SSIM: 0.85±0.028) whereas linearly-scaled R2* maps show errors (NRMSE: 40±3.2%, and SSIM: 0.82±0.032).In Figure 3, the proposed pipeline shows contrasts comparable to those of χ-separation-COSMOS. In contrast, maps from the linearly-scaled R2* input exhibit notably different contrasts and worse metrics. When conducting linear regression on the ROI values, the slopes of lines for the proposed methods are 0.97 for χpara and 0.96 for χdia, closely aligning to those from the method with 3T R2* (0.98 and 1.0). Conversely, the method with linearly-scaled R2* yields significantly lower slopes (0.87 and 0.63).
Figure 4 illustrates the capability of the high-resolution χ-separation to delineate fine structures in the in-vivo human brain such as lamina structures in the globus pallidus, primary visual cortex, transverse pontine fiber20, and fissures of the cerebellum. These structures are not as distinct at 3T, highlighting the advantage of 7T imaging. Additionally, high-resolution maps enable layer-wise cortex analysis (Figure 4d). The results demonstrated consistency with previous findings4, the discrepancy between the locations of the peak of QSM and the peak of χpara.
Conclusion & Discussion
In this study, we introduced a novel deep neural network, R2* 7T-to-3T conversion network, to mitigate the discrepancy of R2* along the field strength and utilize 𝜒-sepnet-R2*. The results demonstrated that the R2* 7T-to-3T conversion network can successfully transform 7T R2* to 3T R2*. By integrating the R2* 7T-to-3T conversion network, QSMnet, 𝜒-sepnet-R2*, and resolution generalization method, we generated high-resolution 𝜒-separation maps from GRE data at 7T. Small errors may be from noise in the 3T data and potential error propagation from cascading the networks. Utilizing the proposed method, it is feasible to delineate more precise brain structures. Proposed method can be applied to layer-wise analysis and examine detailed structures related to iron and myelin accumulation and neurodegenerative diseases.Acknowledgements
This work is supported by the Institute of New Media and Communications (INMC), SEPRI, and IOER at Seoul National University (SNU), the National Research Foundation of Korea (NRF) grant funded by the Korea government (NRF-2019M3C7A1031994, No. 2021M3E5D2A01024795), and the Institute of Basic Science (IBS-R015-D1).References
1. Shin, Hyeong-Geol, et al. "𝜒-separation: Magnetic susceptibility source separation toward iron and myelin mapping in the brain." NeuroImage 240 (2021): 118371.
2. Emmerich, Julian et al. “On the separation of susceptibility sources in quantitative susceptibility mapping: Theory and phantom validation with an in vivo application to multiple sclerosis lesions of different age.” Journal of magnetic resonance (San Diego, Calif.: 1997) vol. 330 (2021): 107033. doi:10.1016/j.jmr.2021.107033
3. Chen, Jingjia, et al. "Decompose quantitative susceptibility mapping (QSM) to sub-voxel diamagnetic and paramagnetic components based on gradient-echo MRI data." Neuroimage 242 (2021): 118477.
4. Subin, Lee, et al. “Laminar profiling in advanced susceptibility imaging reveals variations in iron and myelin concentrations”, 30th Joint Annual Meeting ISMRM-ESMRMB, 07-12 May 2022.
5. Betts, Matthew J., et al. "High-resolution characterization of the aging brain using simultaneous quantitative susceptibility mapping (QSM) and R2* measurements at 7 T." Neuroimage 138 (2016): 43-63.
6. Spincemaille, Pascal, et al. "Quantitative susceptibility mapping: MRI at 7T versus 3T." Journal of Neuroimaging 30.1 (2020): 65-75.
7. Bian, Wei, et al. "In vivo 7T MR quantitative susceptibility mapping reveals opposite susceptibility contrast between cortical and white matter lesions in multiple sclerosis." American Journal of Neuroradiology 37.10 (2016): 1808-1815.
8. Tiepolt, Solveig, et al. "Quantitative susceptibility mapping of amyloid-β aggregates in Alzheimer’s disease with 7T MR." Journal of Alzheimer's Disease 64.2 (2018): 393-404.
9. Minjoon, Kim, et al. “χ-sepnet: Susceptibility source separation using deep neural network”, 30th Joint Annual Meeting ISMRM-ESMRMB, 07-12 May 2022.
10. Yoon, Jaeyeon, et al. "Quantitative susceptibility mapping using deep neural network: QSMnet." Neuroimage 179 (2018): 199-206.
11. Sooyeon, Ji, et al. “Resolution generalization of deep learning-based QSM network.", 31st Joint Annual Meeting ISMRM-ESMRMB, 03-08 June 2023.
12. Dymerska, Barbara, et al. "Phase unwrapping with a rapid opensource minimum spanning tree algorithm (ROMEO)." Magnetic resonance in medicine 85.4 (2021): 2294-2308.
13. Wu, B., Li, W., Guidon, A., Liu, C., 2012. Whole brain susceptibility mapping using compressed sensing. Magn. Reson. Med. 67, 137–147.
14. Avants, McPhee, K.C., Wilman, A.H., 2015. T2 quantification from only proton density and T2-weighted MRI by modelling actual refocusing angles. Neuroimage 118, 642–650.
15. McGibney, G., and M. R. Smith. "An unbiased signal‐to‐noise ratio measure for magnetic resonance images." Medical physics 20.4 (1993): 1077-1078.
16. Brian B., et al. "A reproducible evaluation of ANTs similarity metric performance in brain image registration." Neuroimage 54.3 (2011): 2033-2044.
17. Shin, Hyeong-Geol, et al. "chi-separation using multi-orientation data invivo and exvivo brains: Visualization of histology up to the resolution of 350 µm." Joint Annual Meeting ISMRM-ESMRMB & ISMRT 31st Annual Meeting, London, UK. 2022.
18. Spincemaille, Pascal, et al. "Quantitative susceptibility mapping: MRI at 7T versus 3T." Journal of Neuroimaging 30.1 (2020): 65-75.
19. Min, Kyeongseon, et al. “A human brain atlas of chi-separation for normative iron and myelin”, Arxiv preprint.
20. Deistung, Andreas, et al. "High-resolution MR imaging of the human brainstem in vivo at 7 Tesla." Frontiers in human neuroscience 7 (2013): 710.
Figures
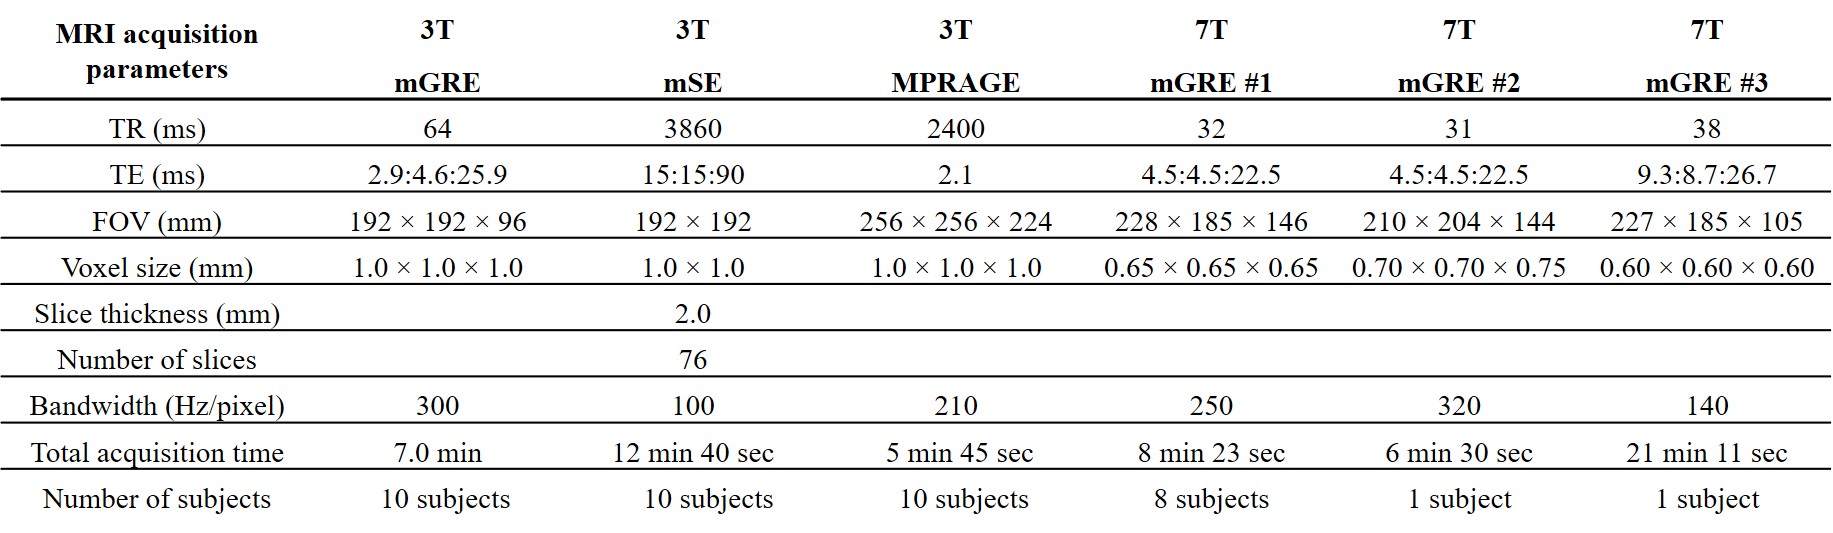
Table 1. MRI acquisition parameters. 3T (Ten subjects): For R2* and local field maps, 1 mm iso resolution 3D multi-echo gradient echo (mGRE) at six head orientations was acquired. For R2, 2D multi-echo spin-echo (mSE) was acquired. For T1-weighted images, 3D magnetization-prepared rapid gradient echo (MPRAGE) was acquired. 7T: For high-resolution R2* and local field maps, mGRE were acquired in the same volunteers at 7T. We obtained 0.65 mm iso resolution mGRE in eight out of ten subjects, 0.60 mm iso resolution mGRE in one subject, and 0.70 × 0.70 × 0.75 mm3 resolution mGRE in one subject.
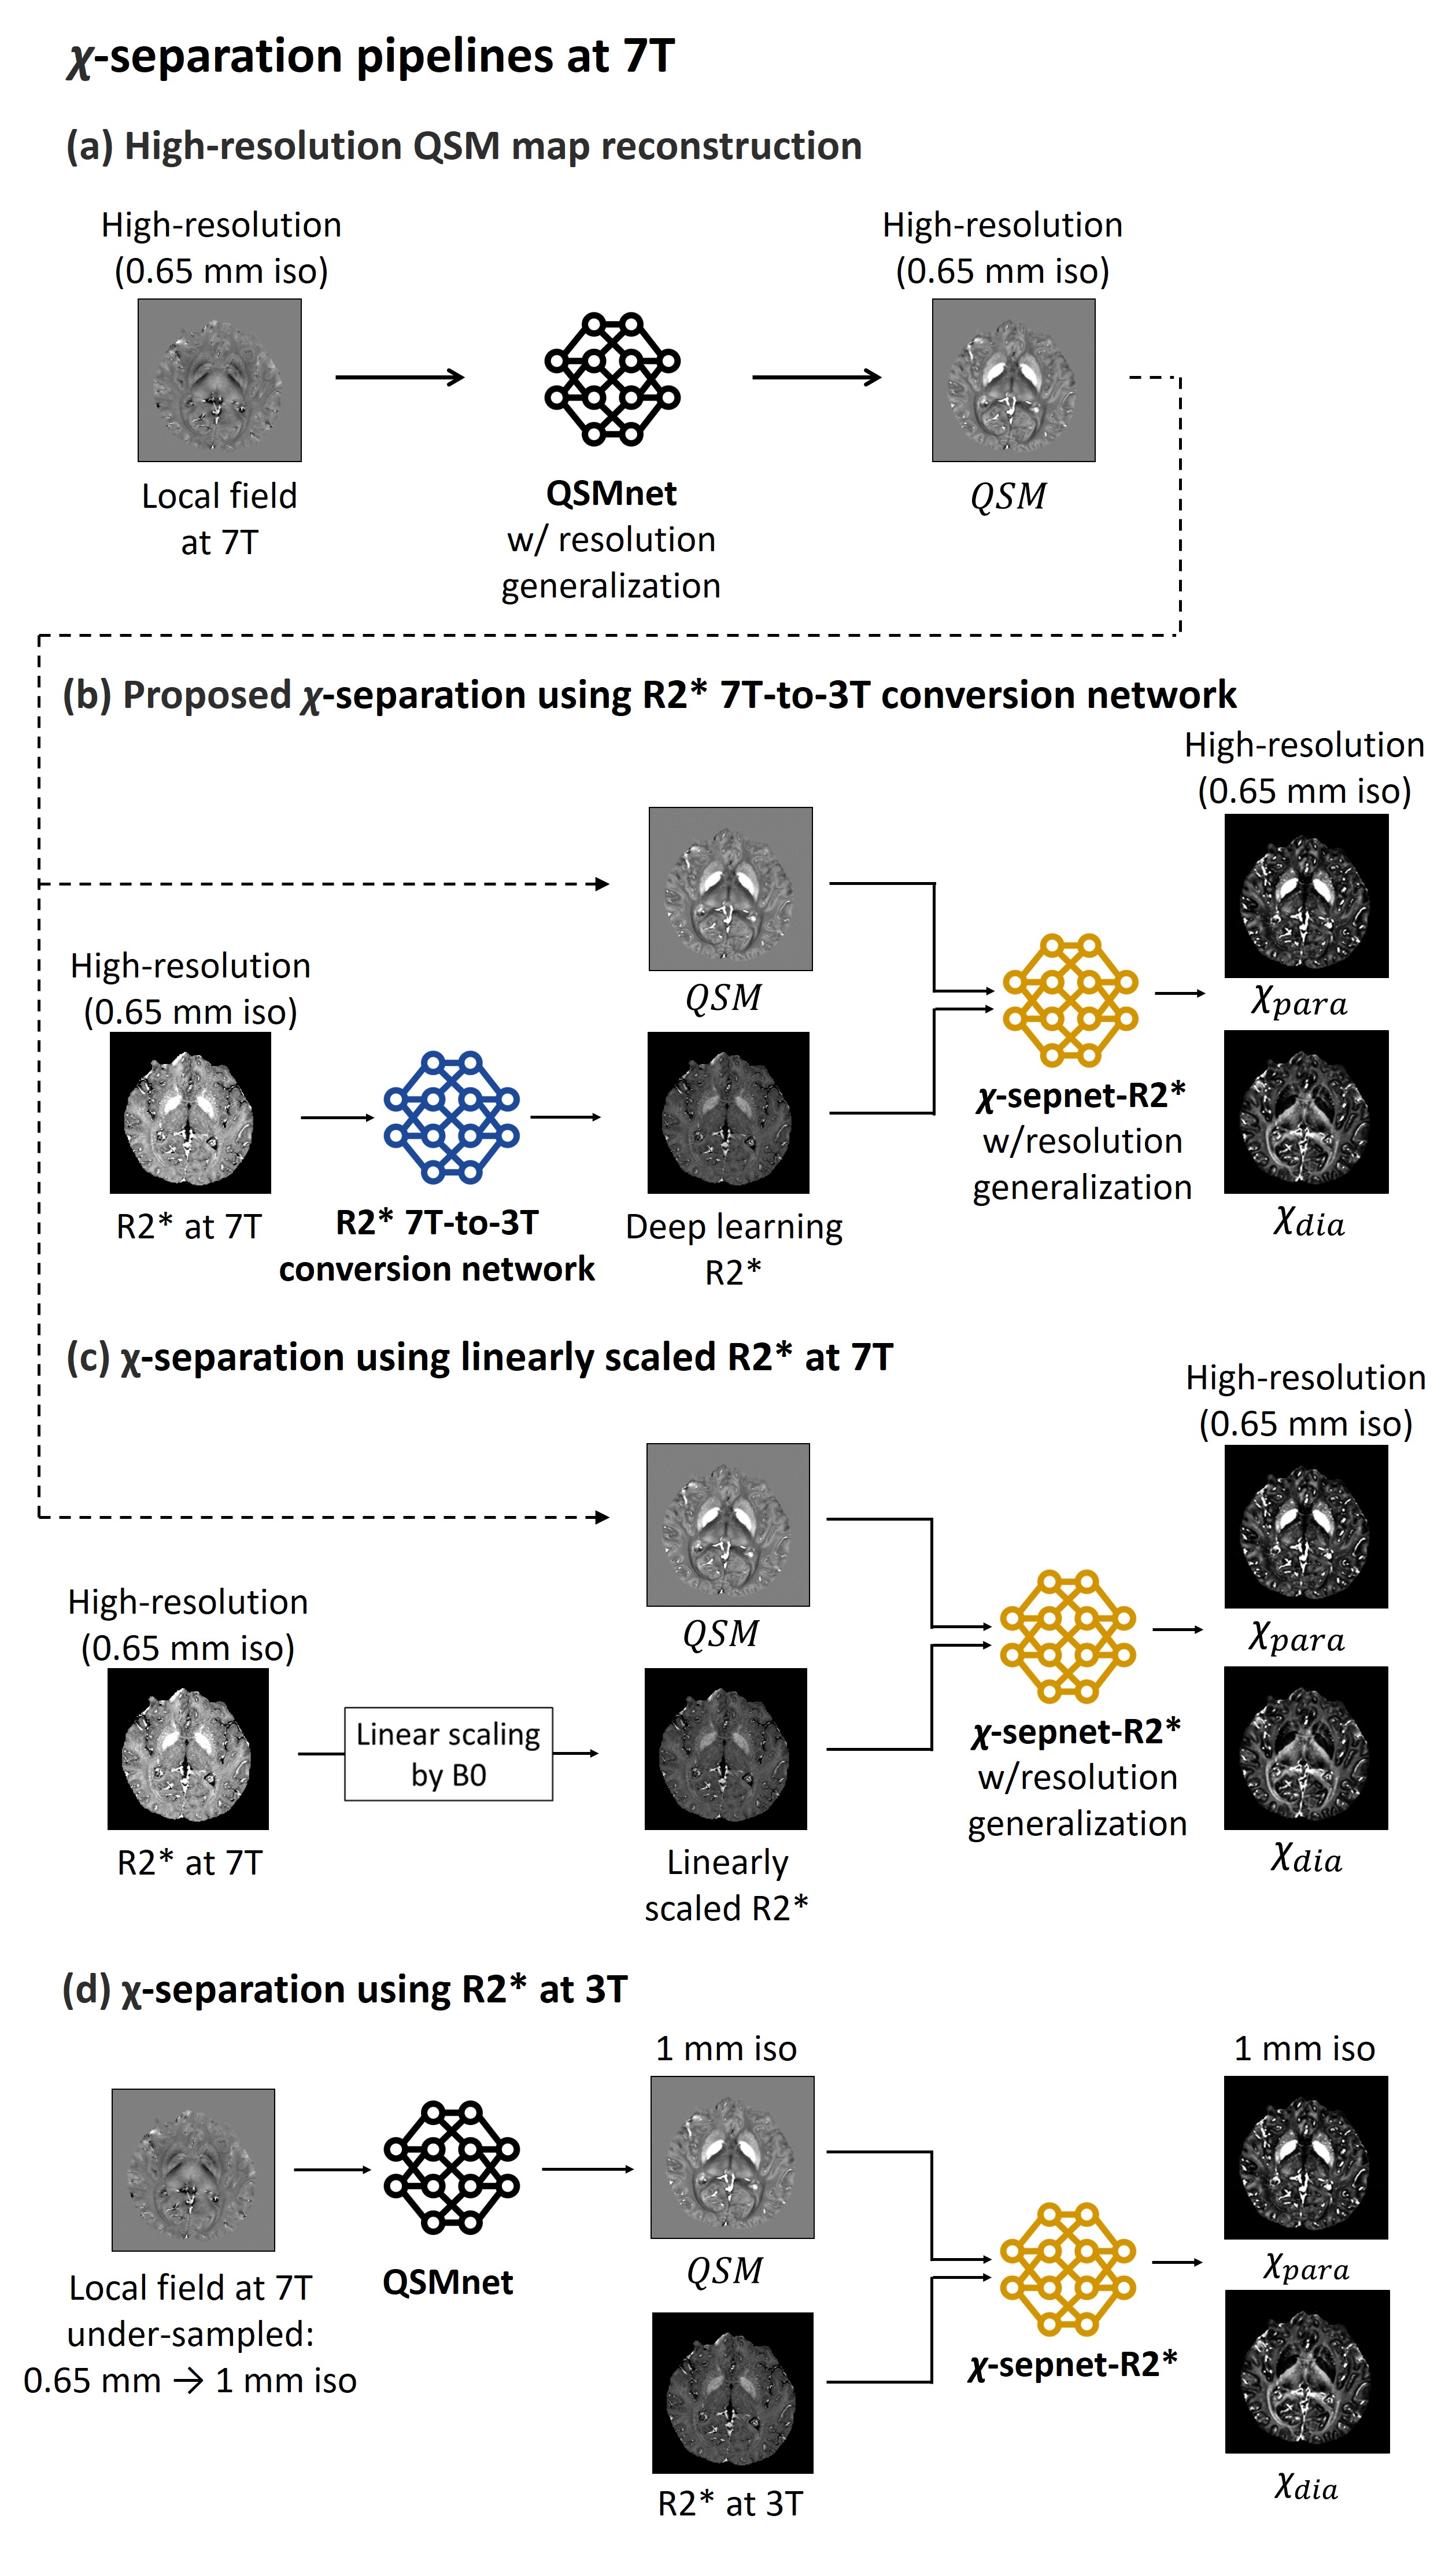
Fig. 1. 𝜒-separation pipelines at 7T. (a) High-resolution QSM map is generated by QSMnet with resolution generalization10. (b) We utilized χ-sepnet-R2* since it is challenging to acquire high-resolution R2 at 7T, and 7T-to-3T conversion network to convert 7T R2* into 3T, required for χ-sepnet-R2*. The high-resolution QSM and the converted R2* maps are used for χ-sepnet-R2*, creating high-resolution χ-separation maps. (c) An alternative method using linearly-scaled R2* by B0. (d) The effect of conversion network is assessed by comparing method with 3T R2* and QSM map (1 mm iso).
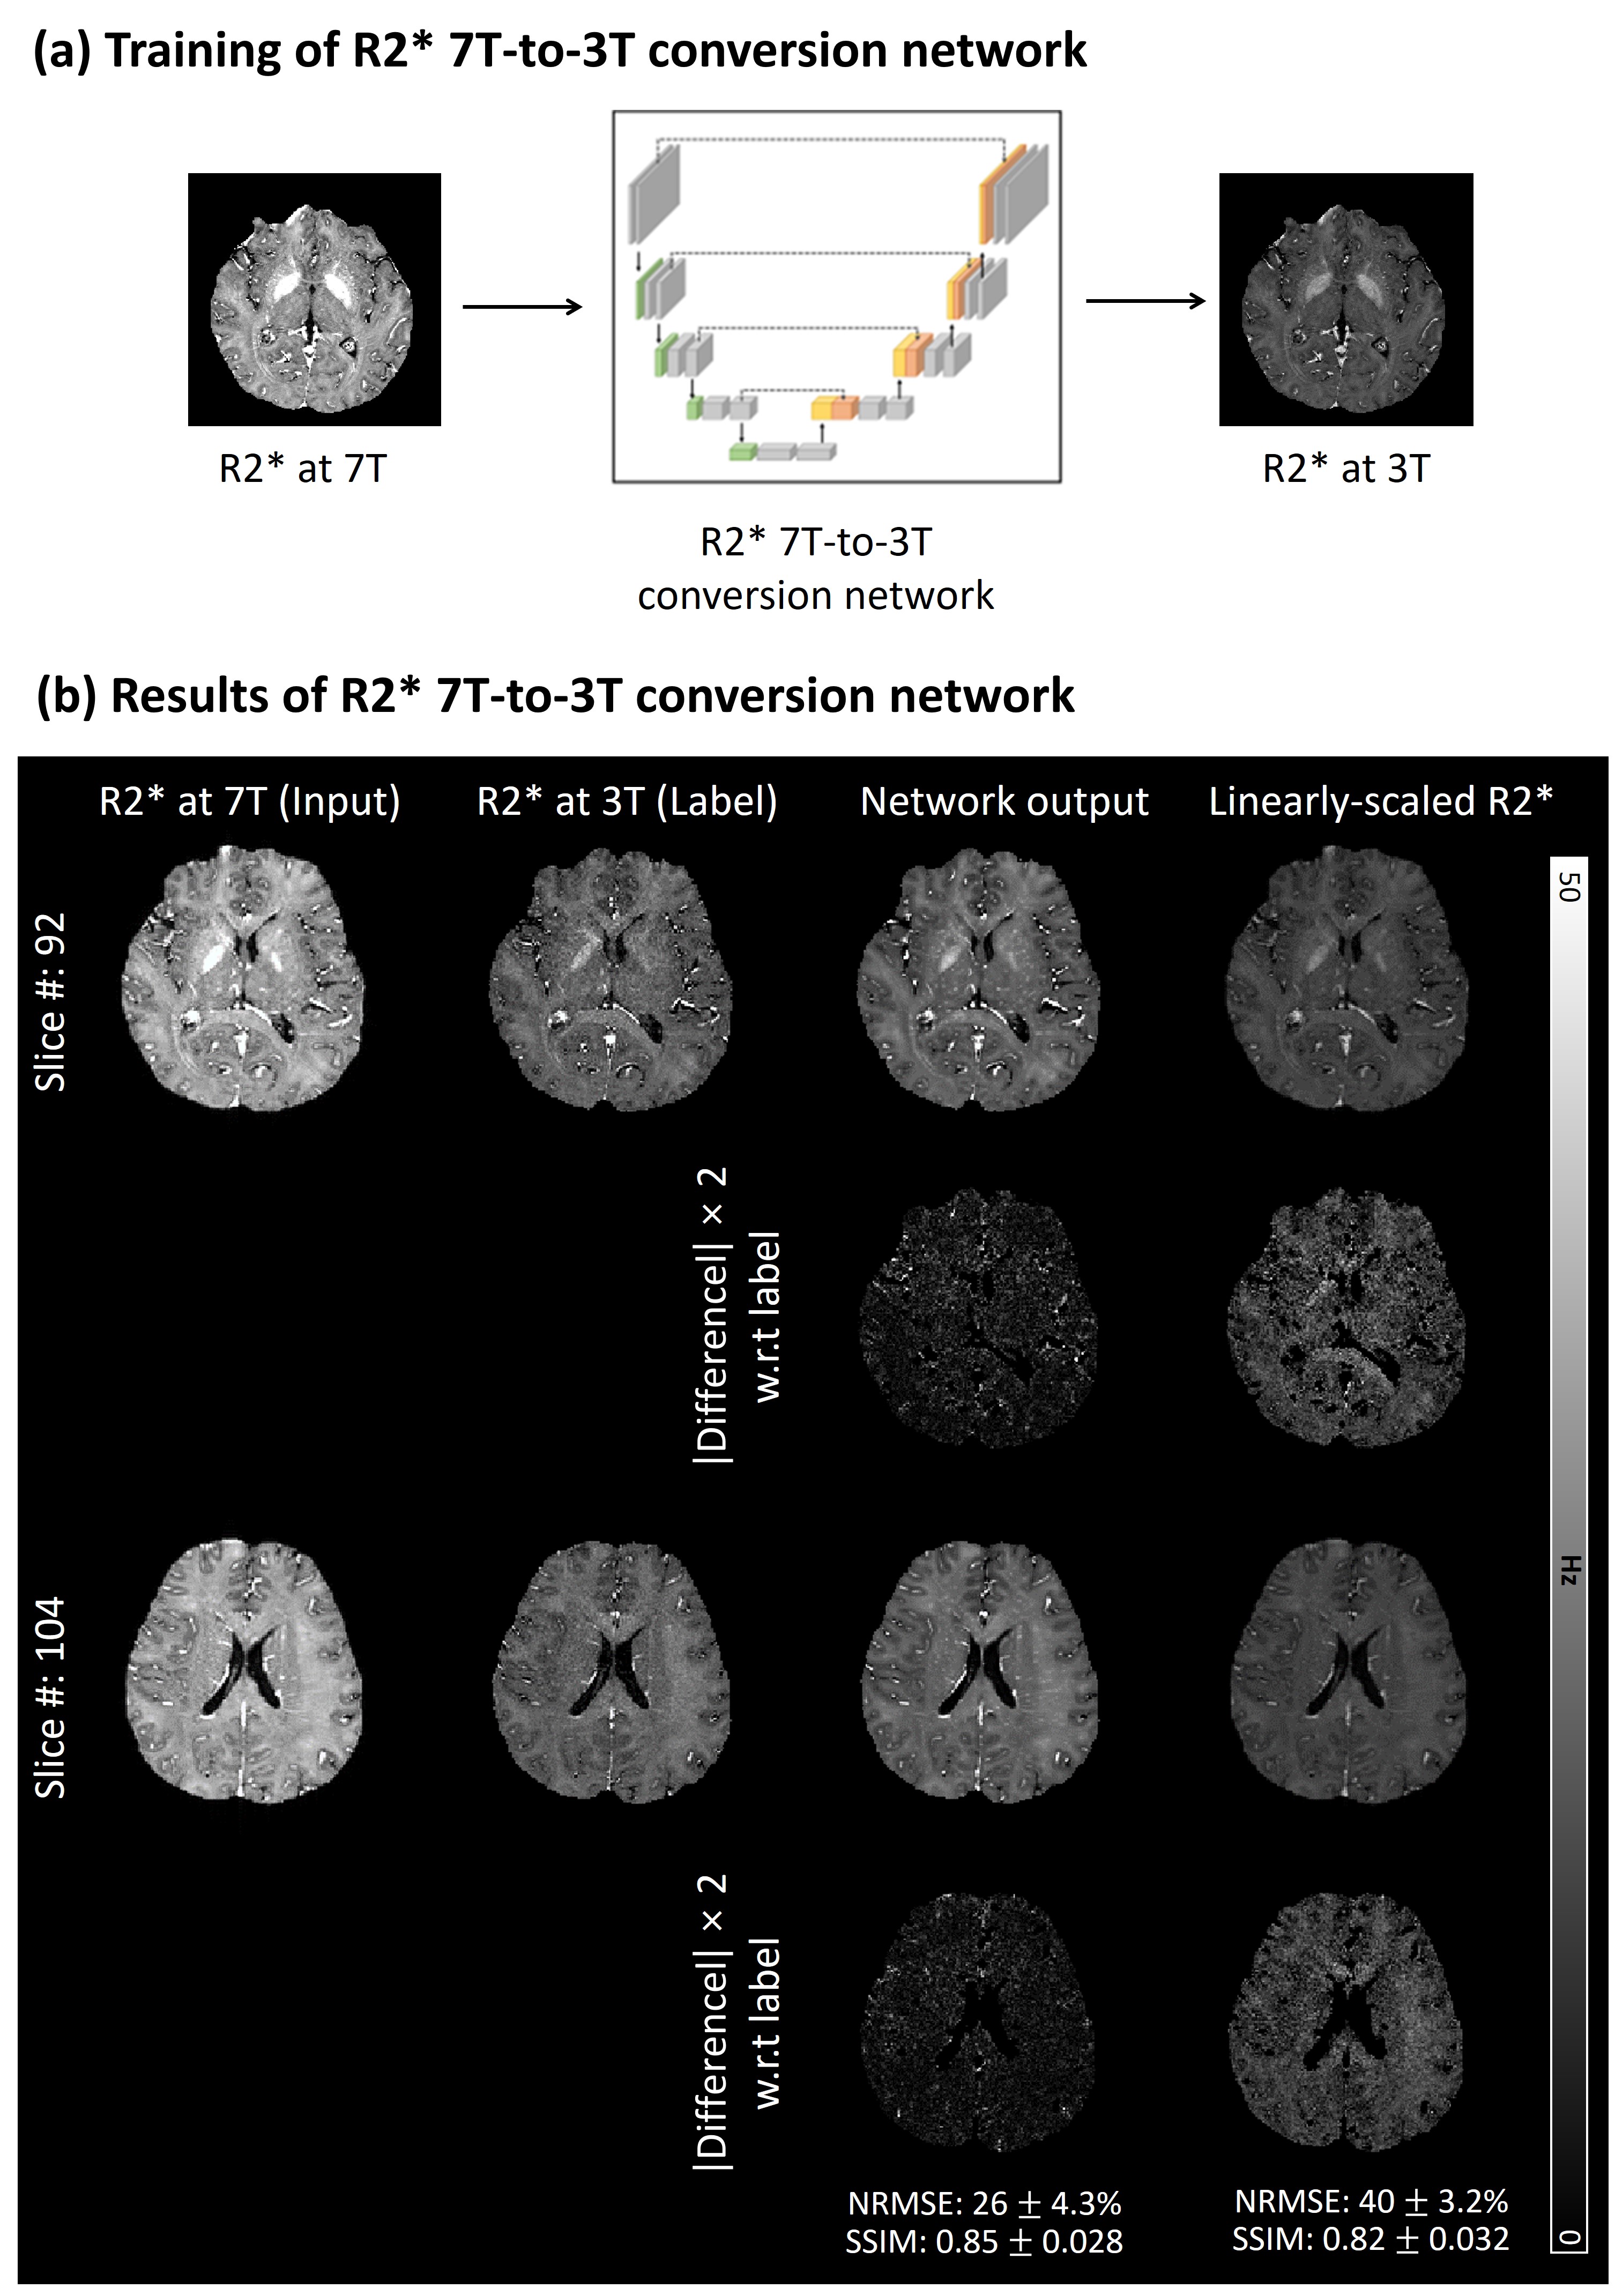
Fig. 2. R2* 7T-to-3T conversion network. (a) An R2* 7T-to-3T network is trained to take 7T R2* as input and output 3T R2*, utilizing a 3D U-net structure. (b) Comparison between R2* maps at 7T (input; first column), R2* maps at 3T (label; second column), output maps using the conversion network (output; third column), and linearly-scaled R2* (last column). When compared, the network output reveals comparable contrasts with less noise (NRMSE: 26 ± 4.3% and SSIM: 0.85 ± 0.028). These results are much better than those of the linearly-scaled R2* (NRMSE: 40 ± 3.2% and SSIM: 0.82 ± 0.032).
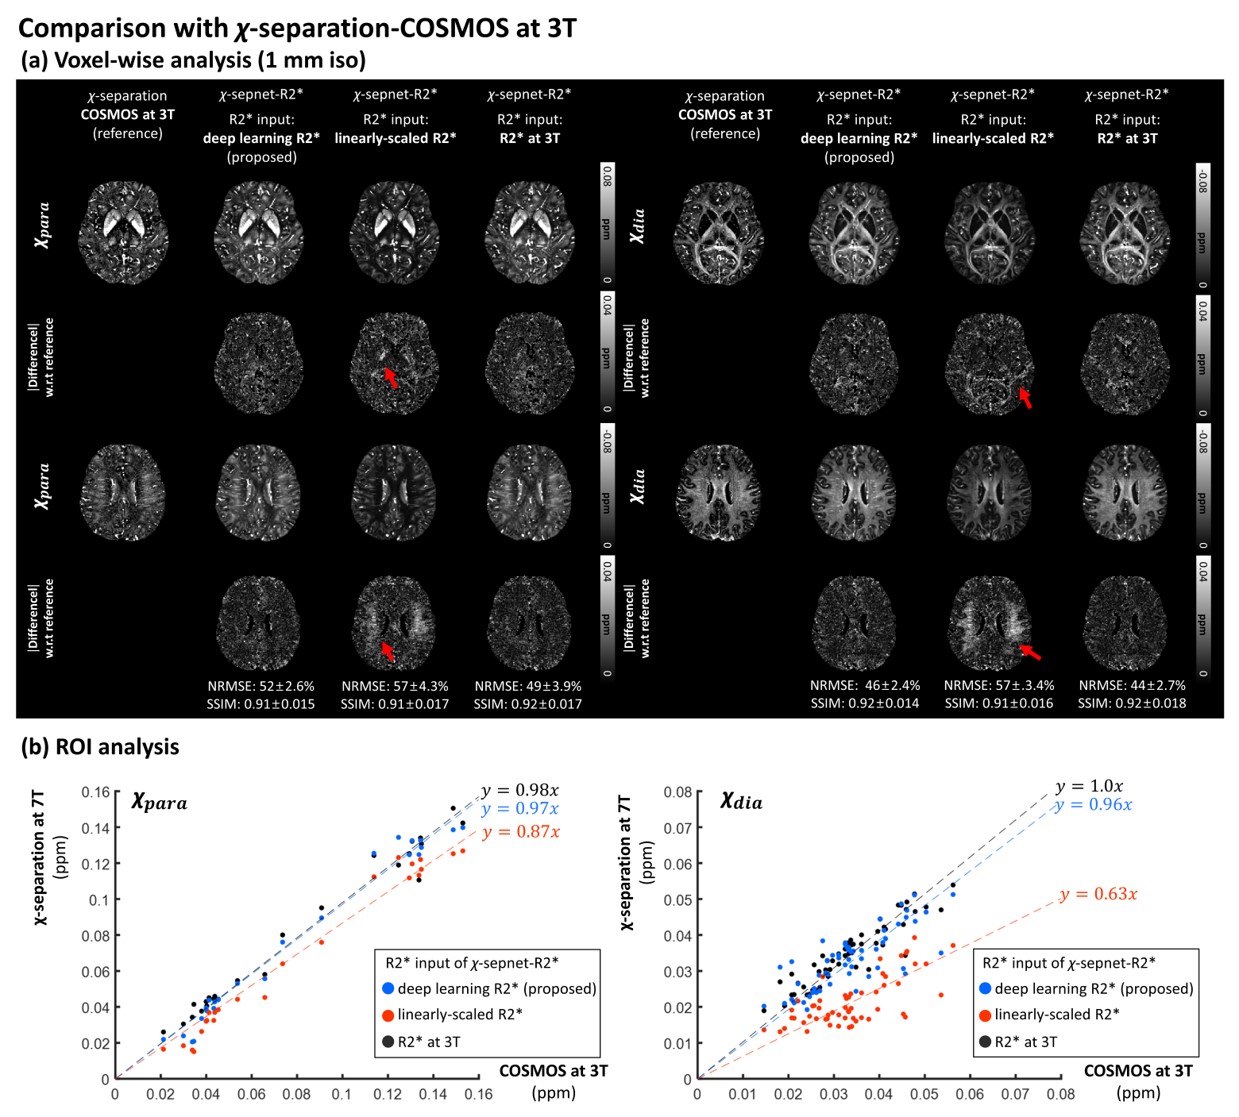
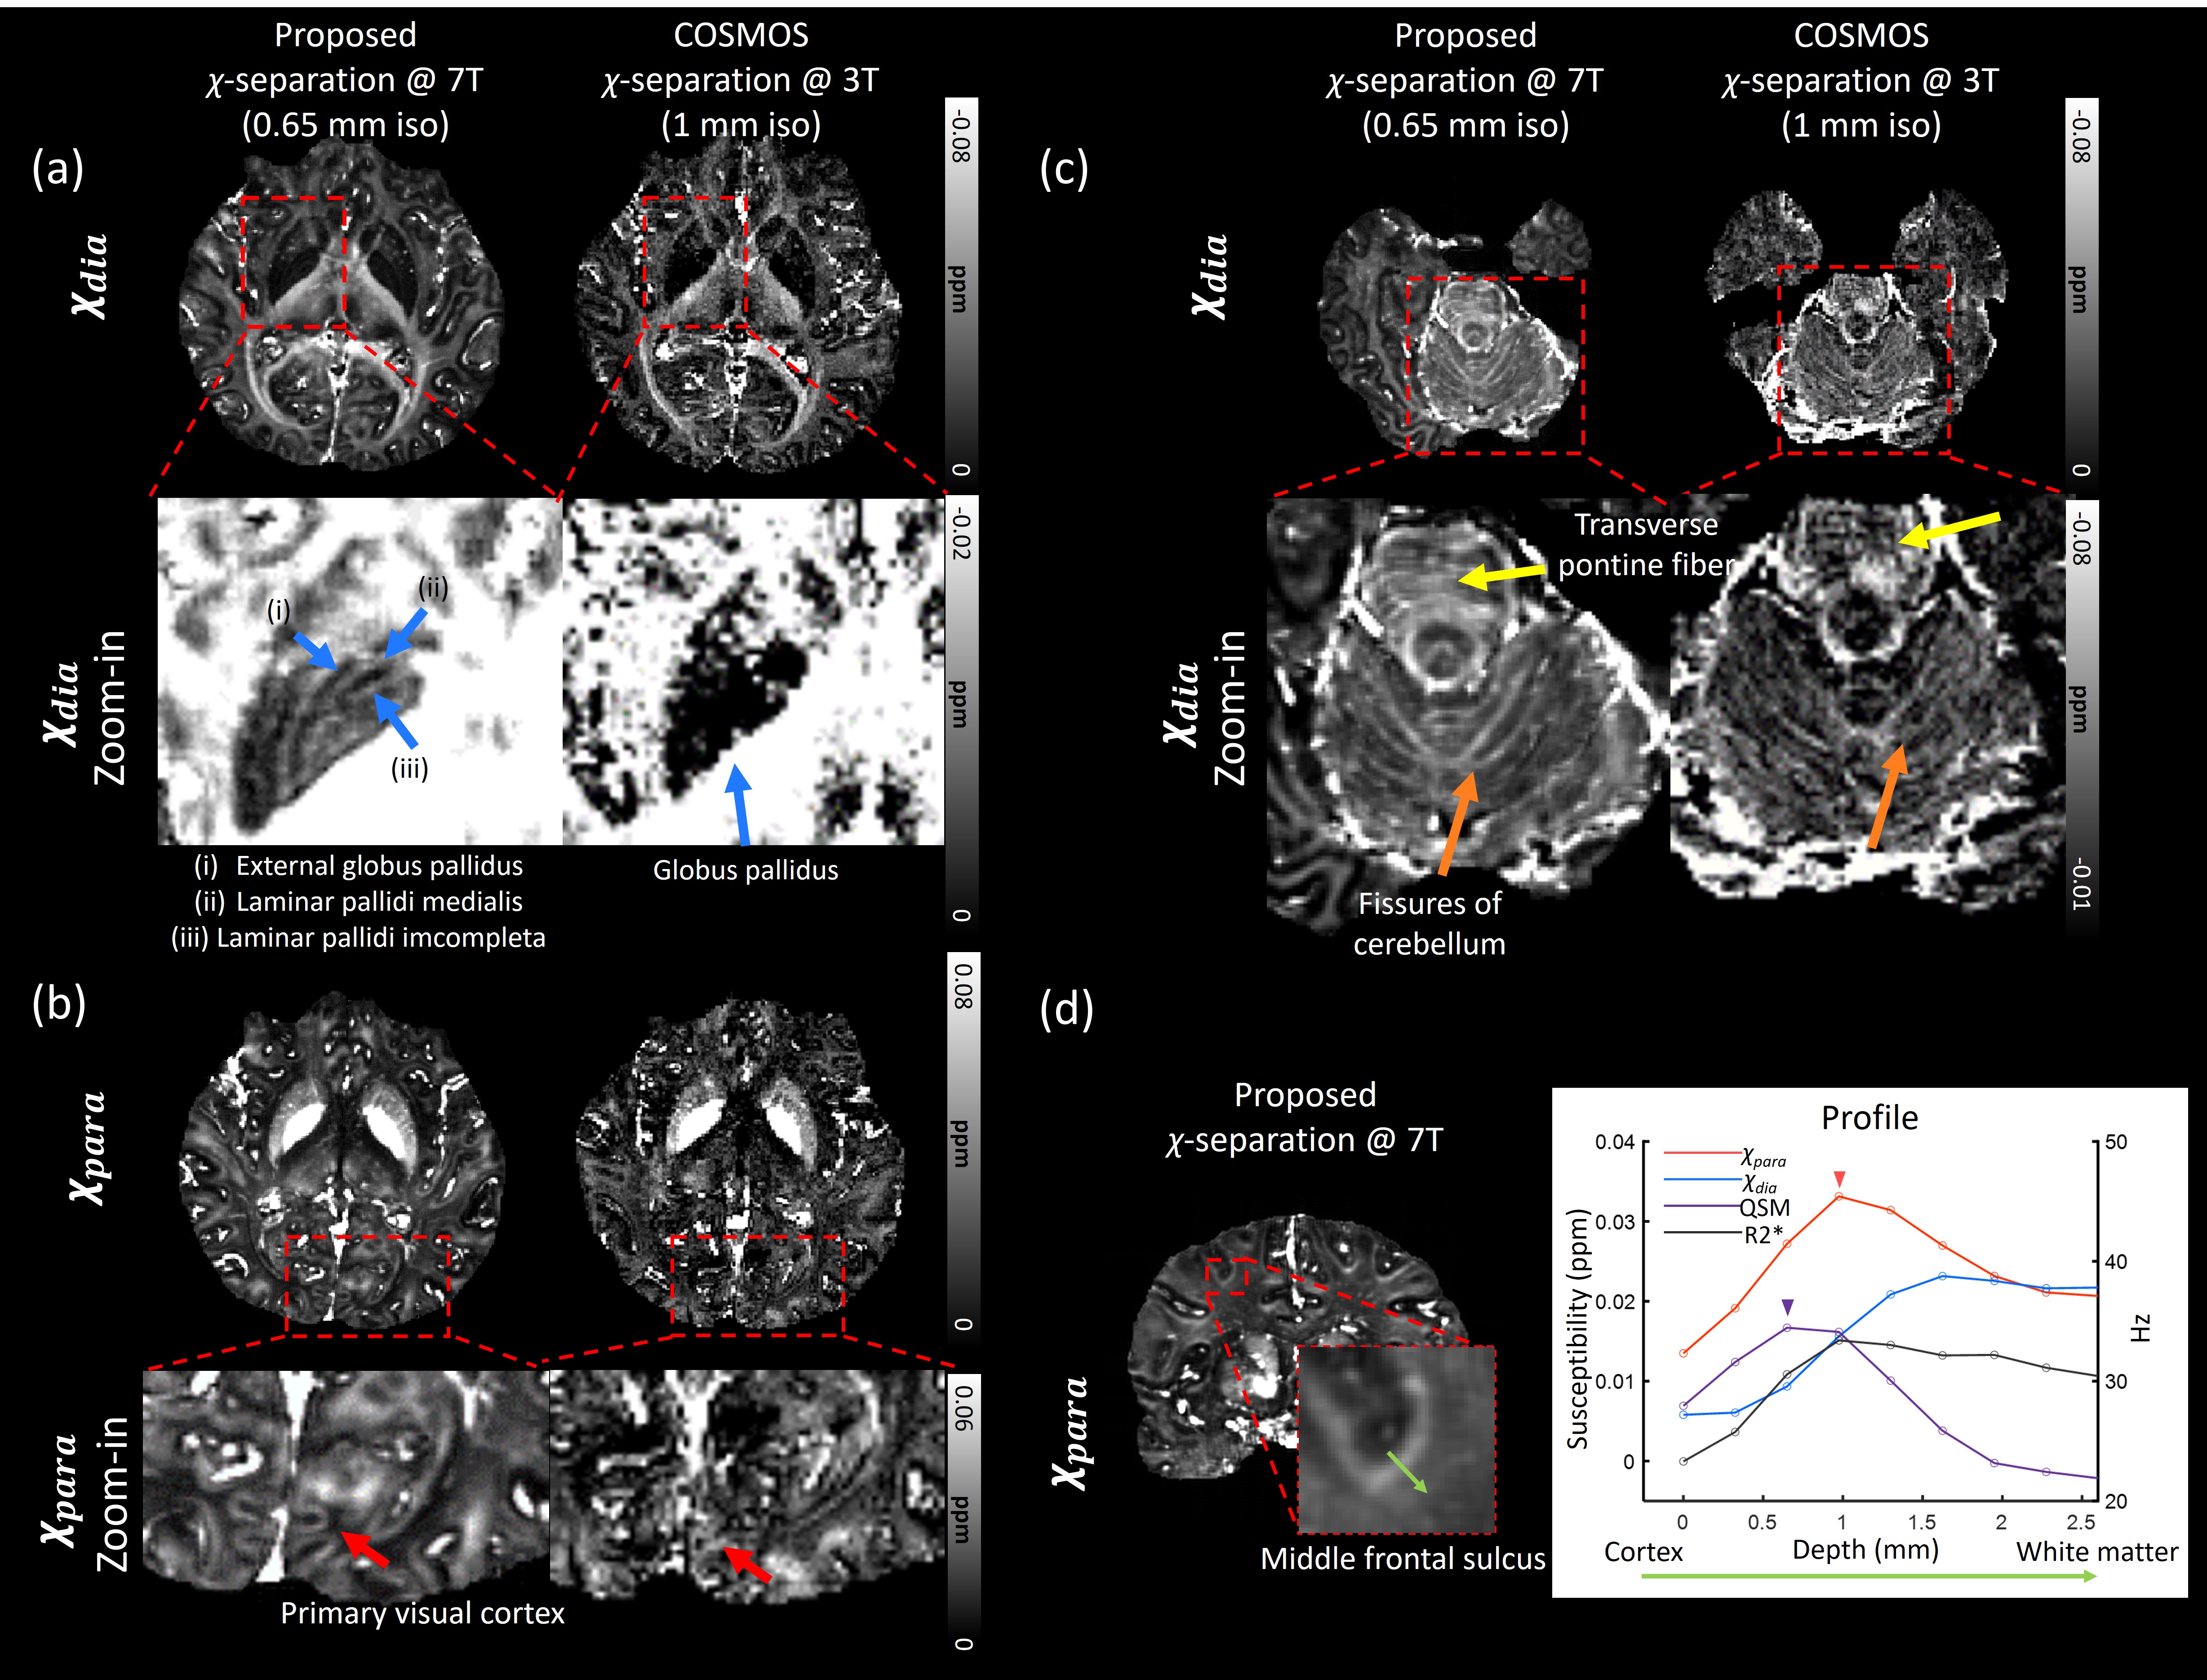
Fig. 4. Delineation of fine structures using high-resolution χ-separation at 7T. A comparison is made between 0.65 mm iso at 7T and 1 mm iso at 3T. (a) Laminar structures in the globus pallidus in χdia map (blue arrows). (b) Primary visual cortex in χpara map (red arrows). (c) Pontine fiber and fisshers of cerebellum in χdia maps at 7T (yellow and orange arrows). (d) The depth-wise profiles of χpara, χdia, QSM, and R2* in the middle frontal sulcus (green arrow). The peak of the QSM is located at a lower depth than that of χpara, confirming QSM does not properly represent layer structures4.