2458
Subvoxel QSM of human knee cartilage: a preliminary study1School of Biomedical Engineering, Shanghai Jiao Tong University, Shanghai, China, 2The National Engineering Research Center of Advanced Magnetic Resonance Technologies for Diagnosis and Therapy (NERC-AMRT), Shanghai Jiao Tong University, Shanghai, China
Synopsis
Keywords: Susceptibility/QSM, Quantitative Susceptibility mapping, subvoxel QSM
Motivation: Subvoxel QSM could be beneficial for assessing the knee cartilage but requires two separate sequences for reconstruction by using APART-QSM.
Goal(s): To achieve subvoxel QSM reconstruction of knee cartilage in a single scan.
Approach: A multi-contrast framework was used to simultaneously estimate $$$T_1$$$, $$$T_2$$$ and $$$T_2^{*}$$$ mapping in one scan. The magnitude and phase images were generated based on the signal equation. The preprocessed phase and $$$R_2^{'}$$$(=$$$1/{T_2^*}$$$-$$$1/{T_2}$$$) were used for subvoxel QSM reconstruction. The results were compared with conventional approach using two sequences (GRE+MSE).
Results: The subvoxel QSM results using the multi-contrast framework have good agreement with the conventional condition.
Impact: The diamagnetic and paramagnetic susceptibility source separation of the knee cartilage could be achieved in a single scan using a multi-contrast framework. This technique can provide specific information to assess the tissue magnetic properties of the knee cartilage.
Introduction
Quantitative susceptibility mapping (QSM) is a post-processing method to compute voxel-wise magnetic susceptibility based on the gradient echo (GRE) phase signal. QSM has been successfully applied to quantify the susceptibility sources in human knee cartilage, such as the collagen fiber1. However, the paramagnetic and diamagnetic sources may co-localize in one voxel due to the limited resolution and thus the measured bulk susceptibility may be canceled out. Therefore, subvoxel QSM2, 3 that separates the diamagnetic and paramagnetic susceptibility sources could provide more specific information about the tissue magnetic property to reflect the early molecular alterations in cartilage. However, subvoxel QSM methods typically include the relaxation rate $$$R_2^{'} $$$(=$$$R_2^*$$$-$$$R_2$$$) in the model with the assumption that $$$R_2^{'}$$$ is proportional to the absolute paramagnetic and diamagnetic susceptibility values. Therefore, an additional multi-echo spin echo (MSE) sequence is needed to estimate $$$R_2$$$. This requirement will not only increase the total scan time but also cause misalignment between scans. In this work, we applied a multi-contrast framework to achieve subvoxel QSM reconstruction of knee cartilage using a single scan.Methods
Multi-contrast frameworkThe multi-contrast sequence consisted of $$$T_2$$$ preparation, inversion recovery preparation, and FLASH excitations followed by multi-echo GRE readout modules (Fig 1). The signal equation can be factorized as:
$$s\left(A,T_{1},T_{2},T_{2}^{*},\varphi_{e},B\right)=A\sin\alpha\cdot e^{- TE/T_{2}^{*}}e^{j\varphi_{e}}\frac{1-e^{-TR/T_{1}}}{1-e^{-TR/T_{1}}\cos\alpha}\left\lbrack{1+\left({Be^{- \tau/T_{2}}-1}\right)\left({e^{-TR/T_{1}}\cos\alpha}\right)^{n}}\right\rbrack$$
where $$$A$$$ is proton density, $$$B$$$ is inversion recovery efficiency, $$$n$$$ is index of FLASH excitation, $$$\tau$$$ is $$$T_2$$$ preparation duration and $$$\varphi_e$$$ is phase at echo $$$e$$$.
The multi-contrast framework applied a data-specific unsupervised model4 to directly estimate the $$$T_1$$$, $$$T_2$$$ and $$$T_2^*$$$ mapping from highly undersampled k-space data. The parameters of the network were updated by enforcing the data consistency between the predicted signal using the forward signal equation and measured k-space.
Acquisition
The knee joint of a subject was scanned using the multi-contrast sequence at 3T. The key parameters were: TR=26ms, flip angle=10°, TE=3.7/9.3/14.9/20.5ms, $$$\tau$$$=22/30/40/50/60ms, resolution=0.67×0.67×3mm3, scan time=12.5minutes.
Subvoxel QSM reconstruction
As shown in Fig 2, the magnitude and phase images were generated according to the signal equation after parametric mapping of $$$T_1$$$, $$$T_2 $$$(=$$$1/R_2$$$) and $$$T_2^*$$$(=$$$1/R_2^*$$$). $$$R_2^{'}$$$ can also be directly calculated by $$$R_2^{'}=R_2^*-R_2$$$. The raw phase image was processed through phase unwrapping5, background phase removal6, and solving an ill-conditioned problem to calculate the susceptibility map ($$$\chi$$$)7. Finally, APART-QSM2 was used to compute the paramagnetic ($$$\chi_{\rm{para}}$$$) and diamagnetic ($$$\chi_{\rm{dia}}$$$) maps.
Comparison with conventional method
We compared the reconstruction results with the conventional method that requires two separate sequences (GRE+MSE). The conventional method followed the same subvoxel QSM reconstruction pipeline as the multi-contrast framework except that the $$$R_2^*$$$ and $$$R_2$$$ maps were obtained based on the GRE magnitude and MSE data in the conventional method, respectively. The $$$R_2$$$ map was linearly registered to $$$R_2^*$$$ map before calculating $$$R_2^{'}$$$.
Results
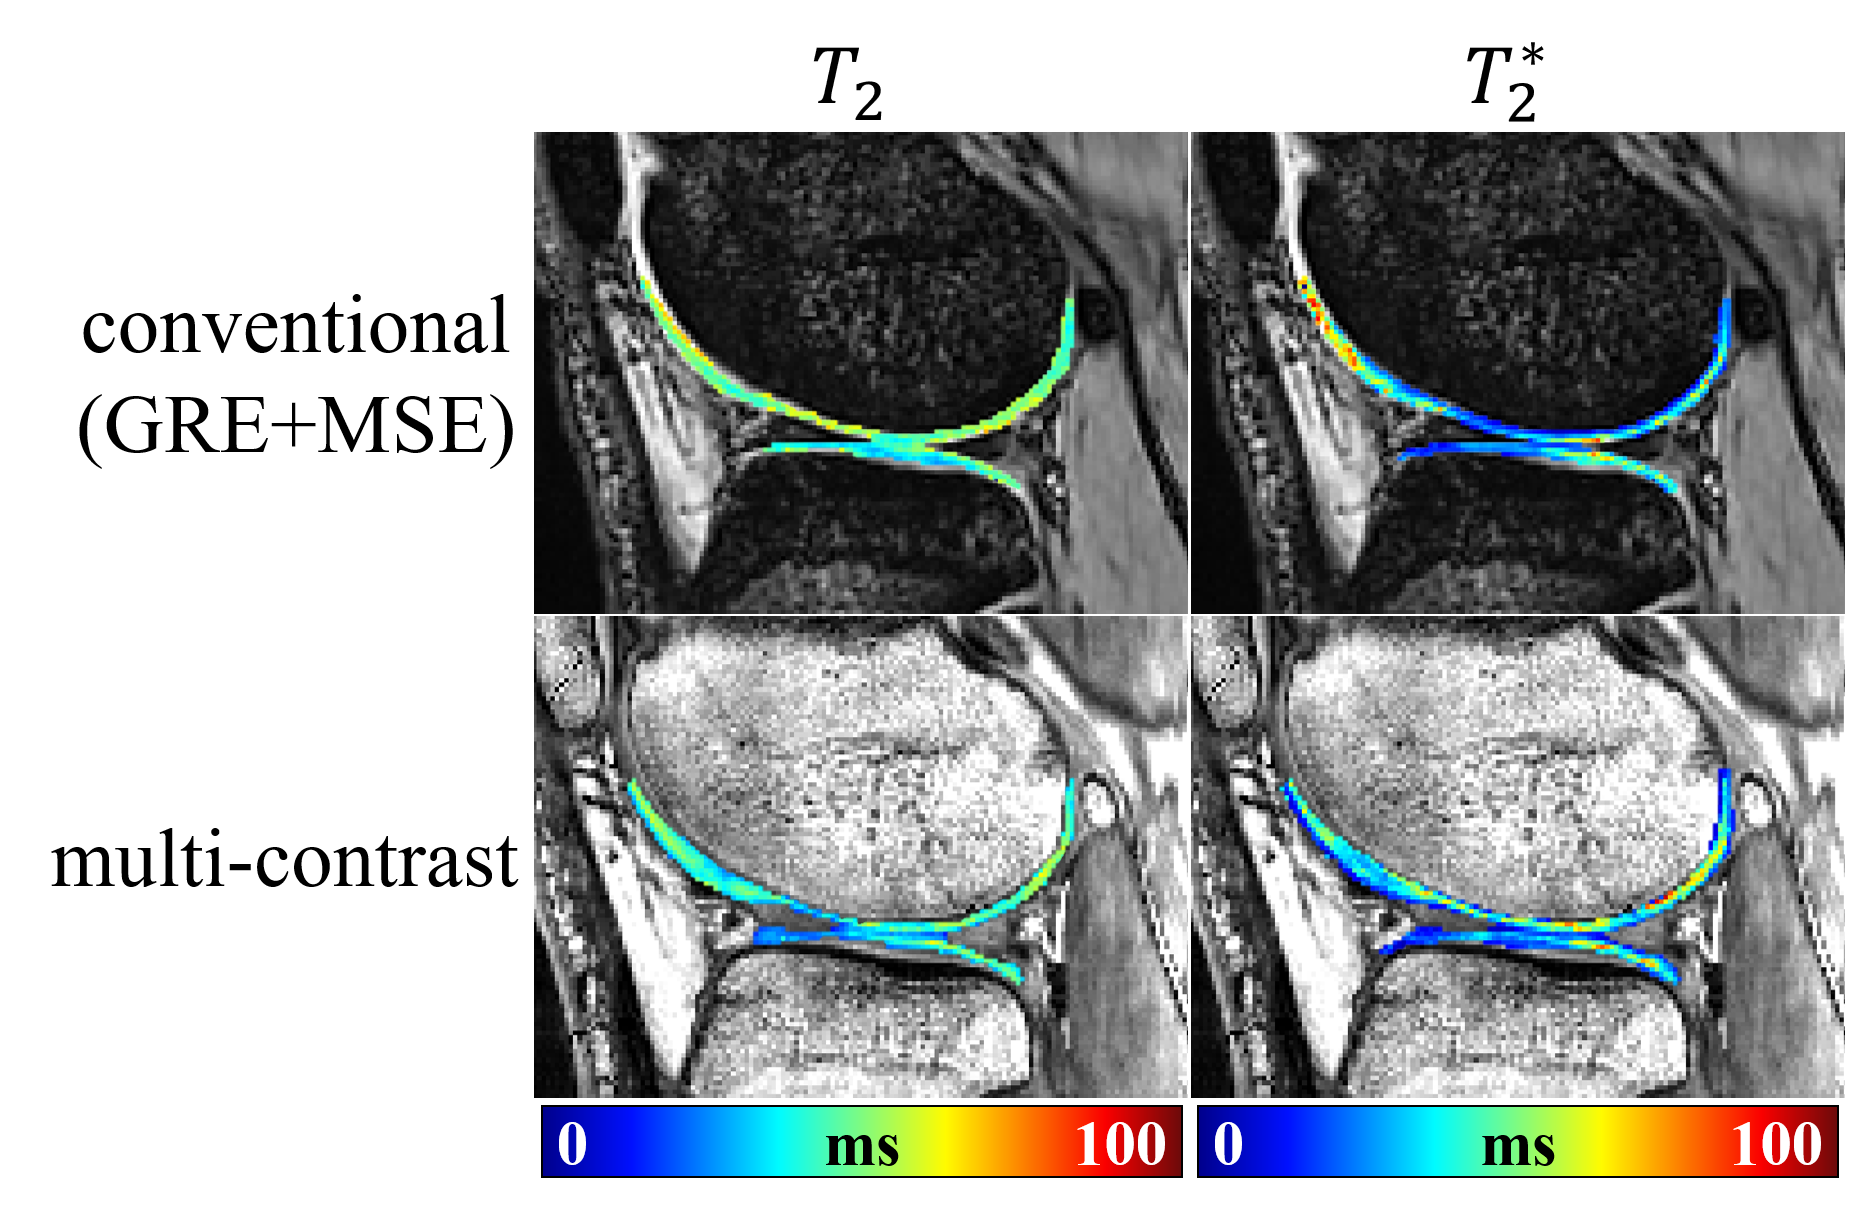
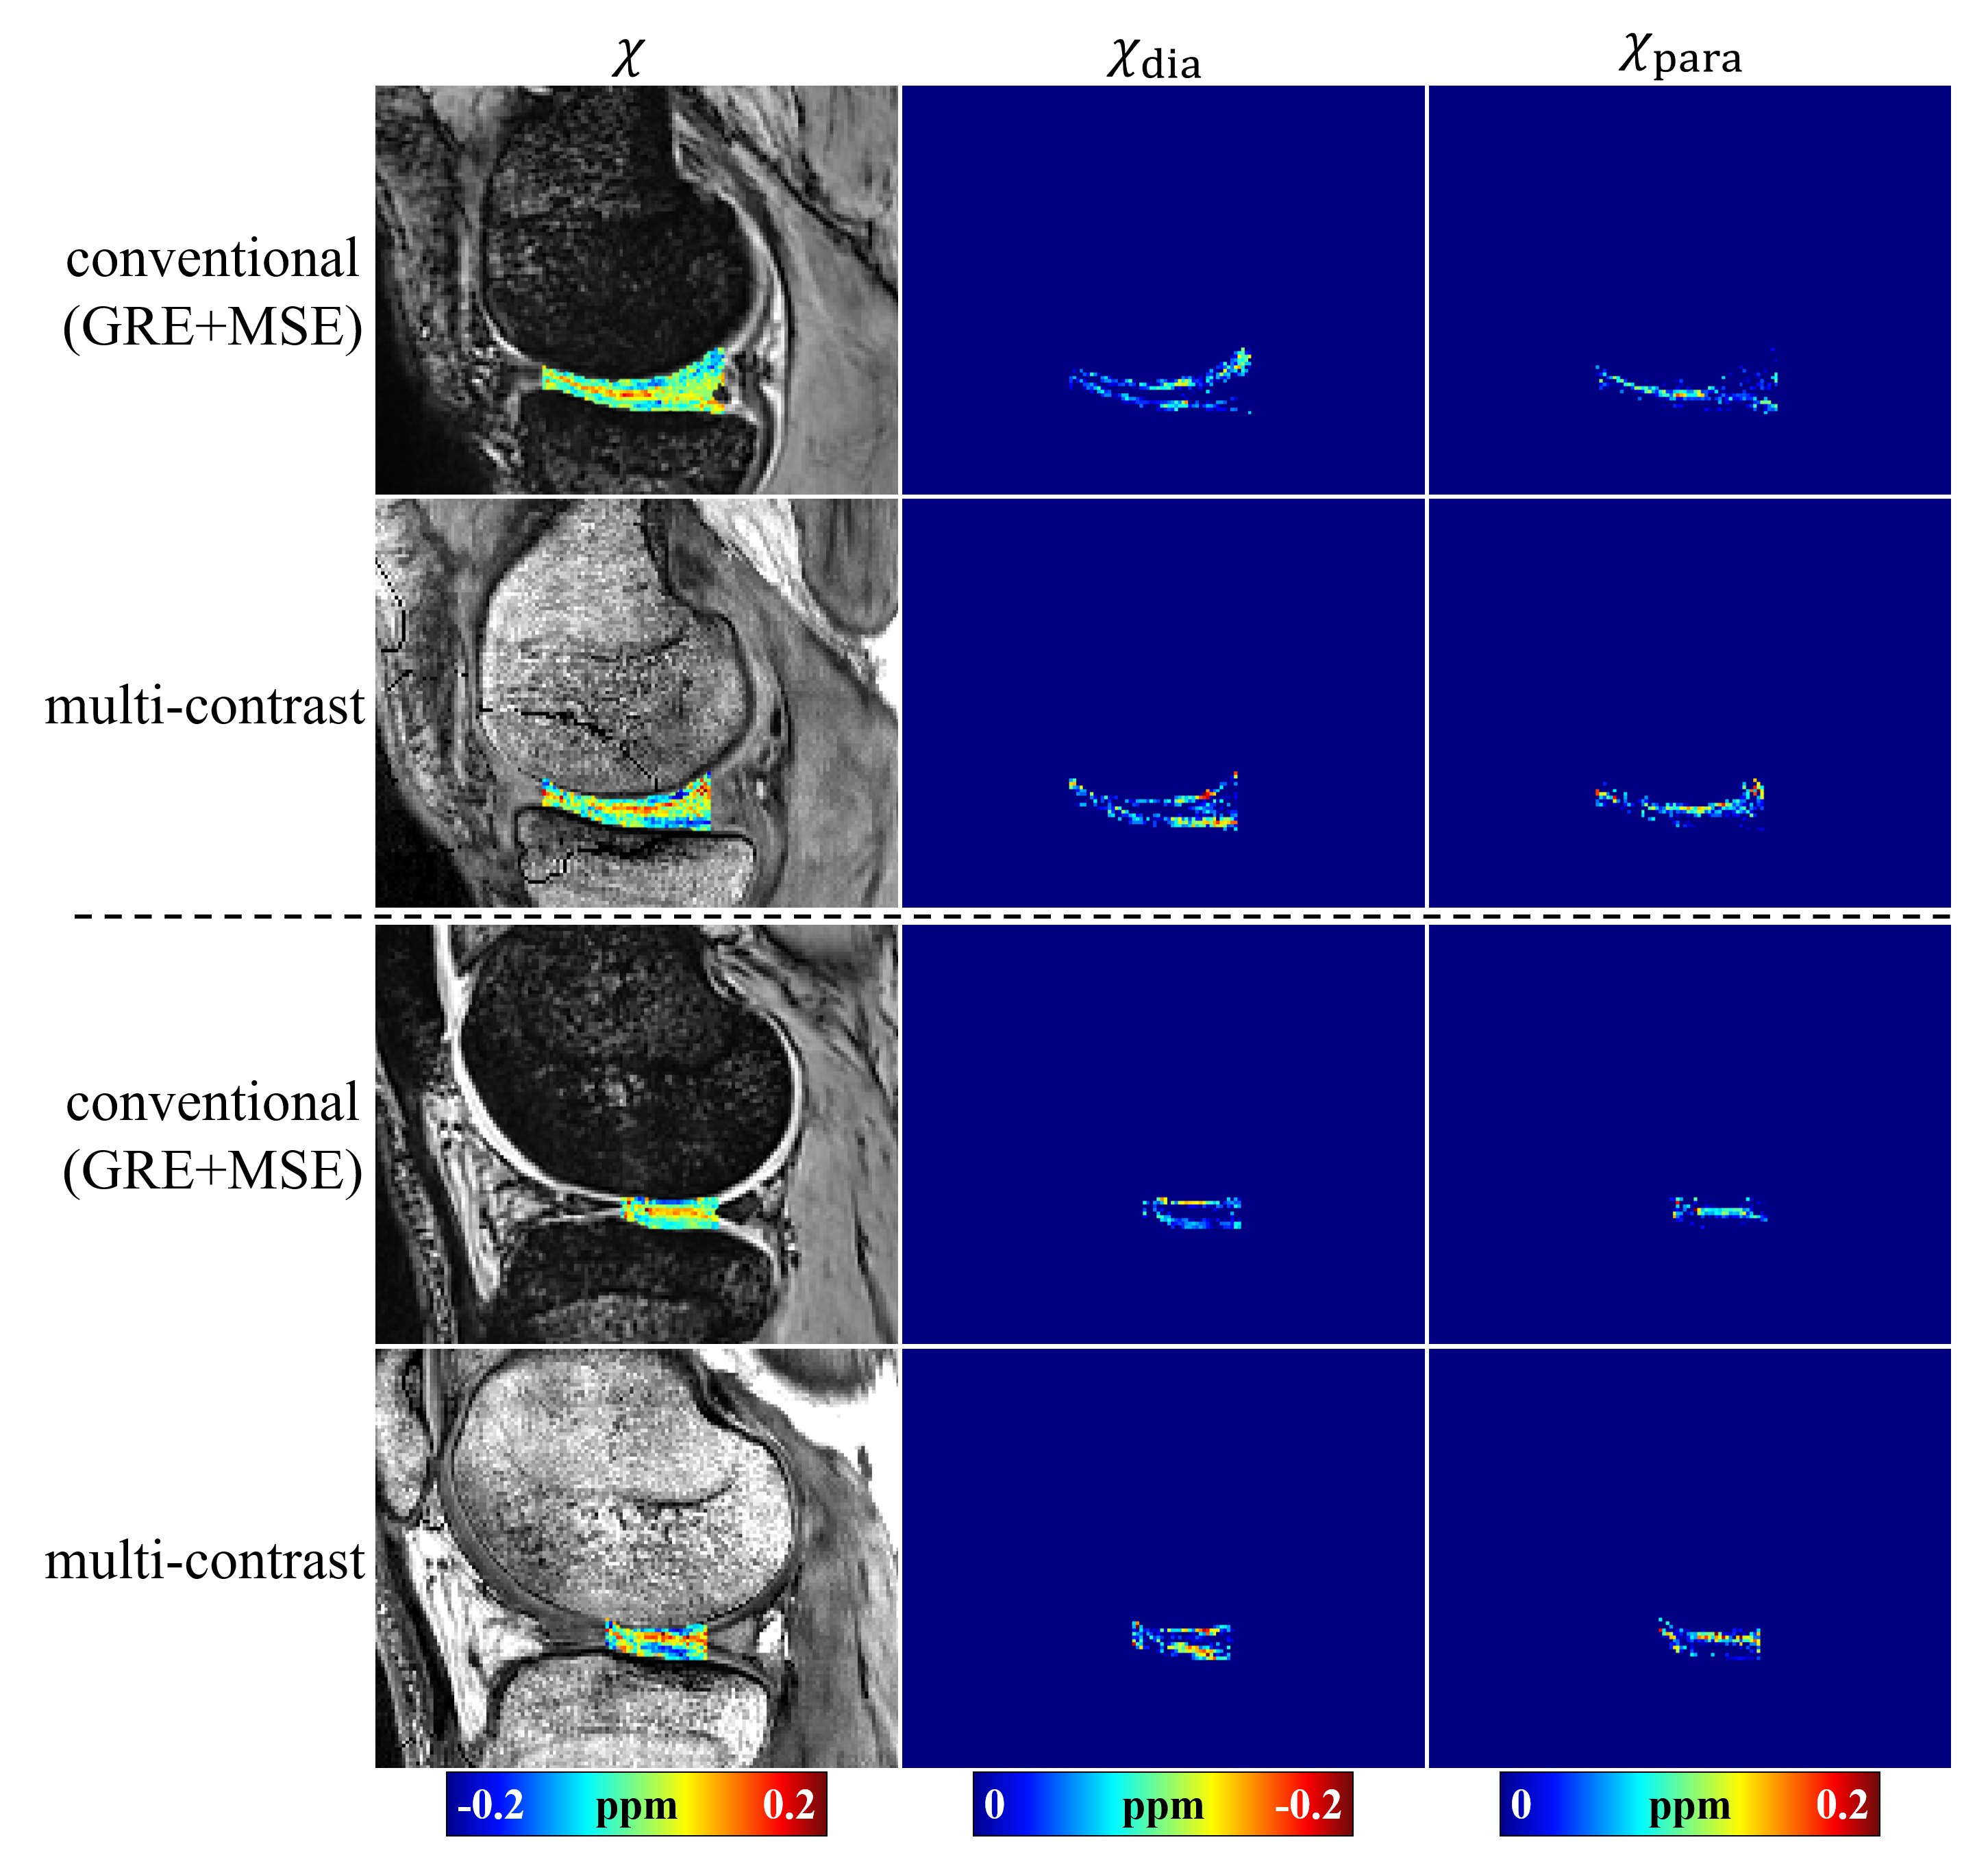
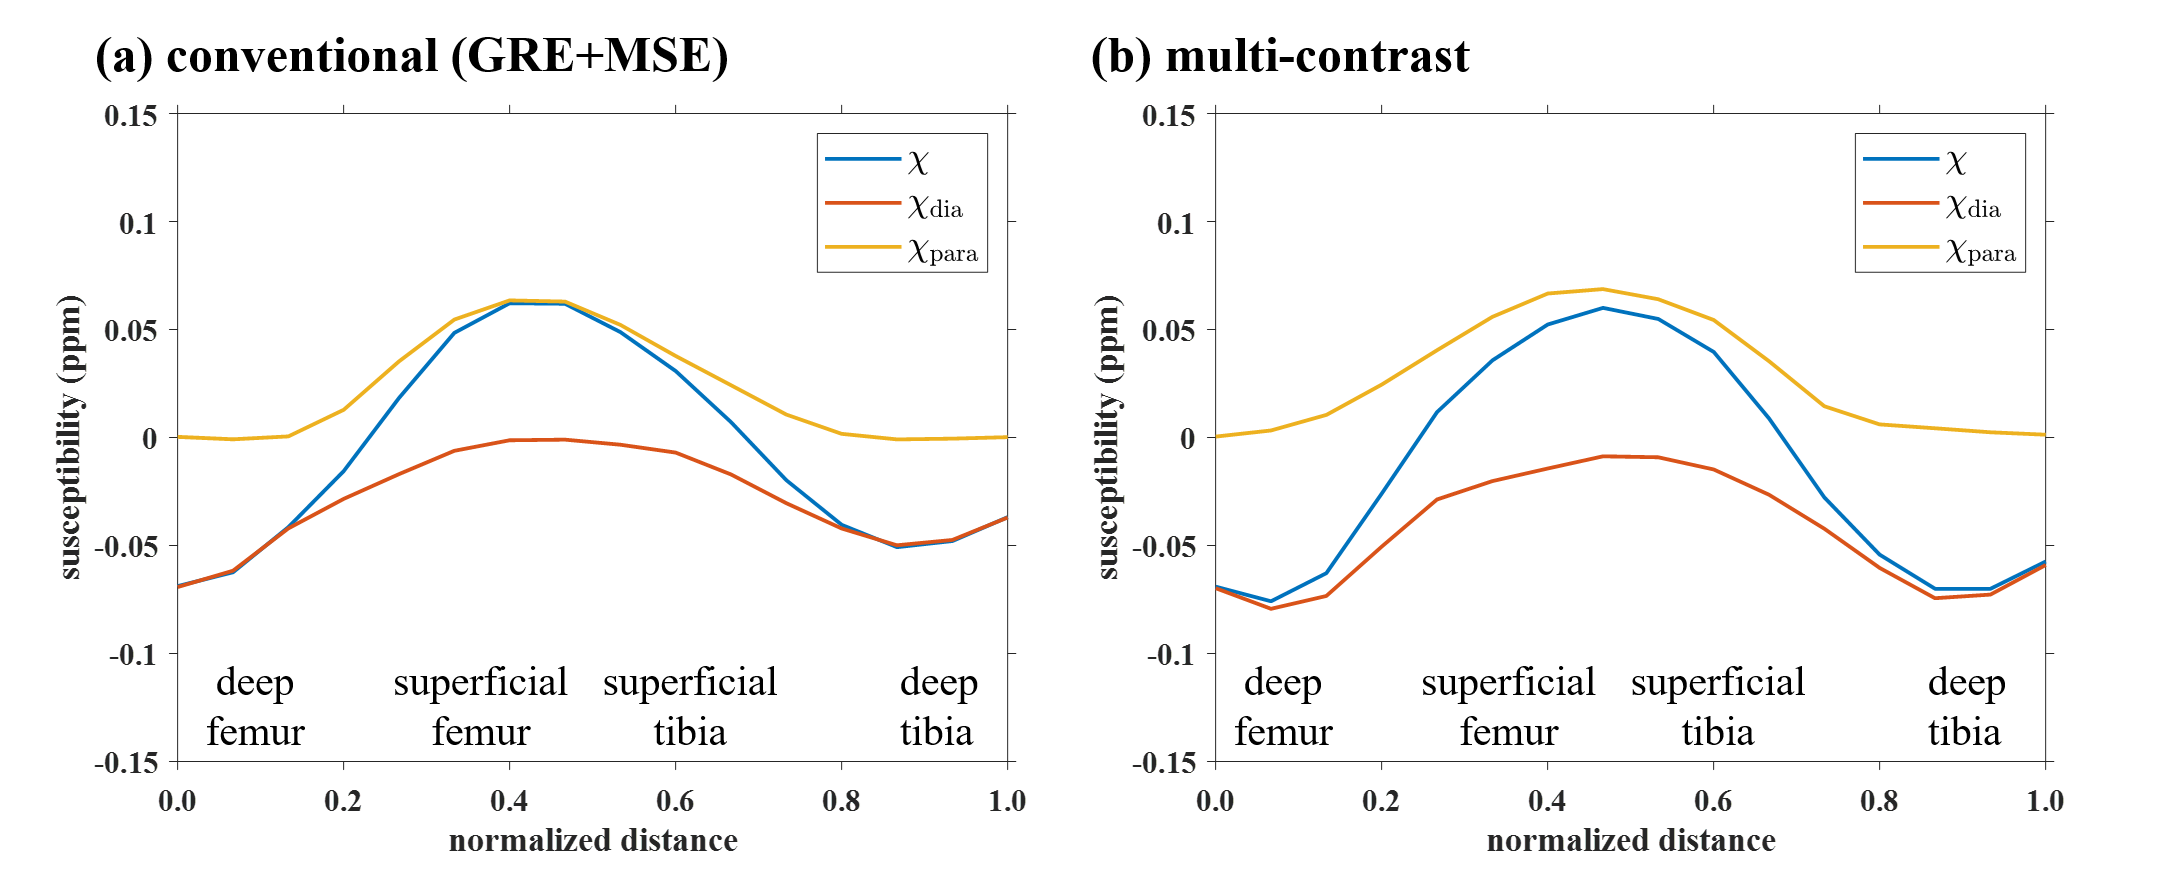
Fig 3 shows the estimated $$$T_2$$$ and $$$T_2^*$$$ maps from the multi-contrast framework and conventional method. Fig 4 shows the comparison between the reconstructed susceptibility map and diamagnetic and paramagnetic susceptibility maps using two methods. The multi-contrast framework showed good agreement with the conventional method in quantitative mapping results by visual assessment. Specifically, diamagnetic (blue voxels) and paramagnetic (yellow voxels) susceptibilities could be observed in the deep and superficial layers of the cartilage based on $$$\chi$$$ map, respectively. $$$\chi_{\rm{dia}}$$$ map showed more negative susceptibility values in the deep layer, while $$$\chi_{\rm{para}}$$$ map revealed more positive susceptibility values in the superficial layer of the knee cartilage.Fig 5 shows the susceptibility profile analysis from the femoral cartilage to tibial cartilage for $$$\chi$$$, $$$\chi_{\rm{dia}}$$$ and $$$\chi_{\rm{para}}$$$ maps. The depth-wise intensity change trends were similar for the multi-contrast framework and conventional method. The profiles of $$$\chi_{\rm{dia}}$$$ and $$$\chi_{\rm{para}}$$$ maps can be used for quantitatively differentiating the diamagnetic and paramagnetic susceptibility sources in the middle layer of cartilage.
Discussion
Subvoxel QSM can provide more specific information about tissue susceptibility in knee cartilage compared with the traditional QSM. For example, the collagen fibers were found to be more diamagnetic and paramagnetic in the deep and superficial layers since the magnetic susceptibility of collagen is orientation-sensitive. Subvoxel QSM could reflect the depth-wise arrangement of the collagen fiber in different layers of cartilage more specifically. More experiments were required to validate the usefulness of subvoxel QSM for knee cartilage in future studies.Conclusion
We demonstrated the feasibility of subvoxel QSM reconstruction of the knee cartilage in a single scan using the multi-contrast framework. The separated paramagnetic and diamagnetic susceptibility maps can provide more specific information for quantifying the tissue properties in knee cartilage.Acknowledgements
No acknowledgement found.References
Figures
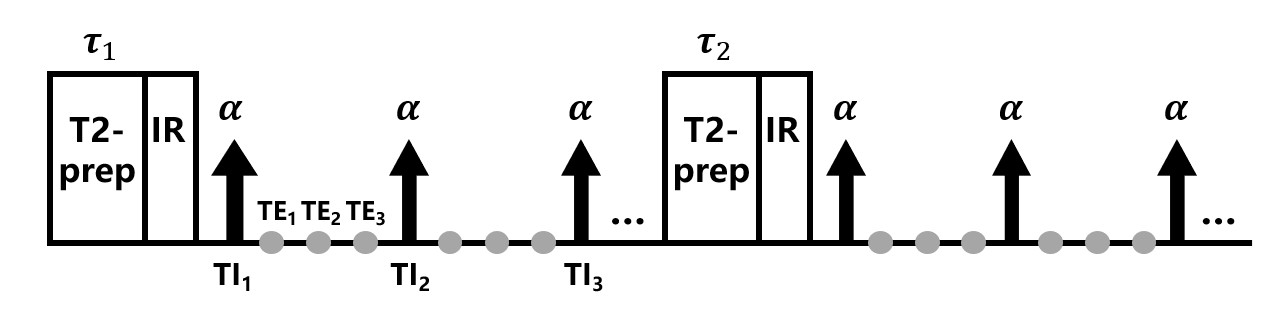
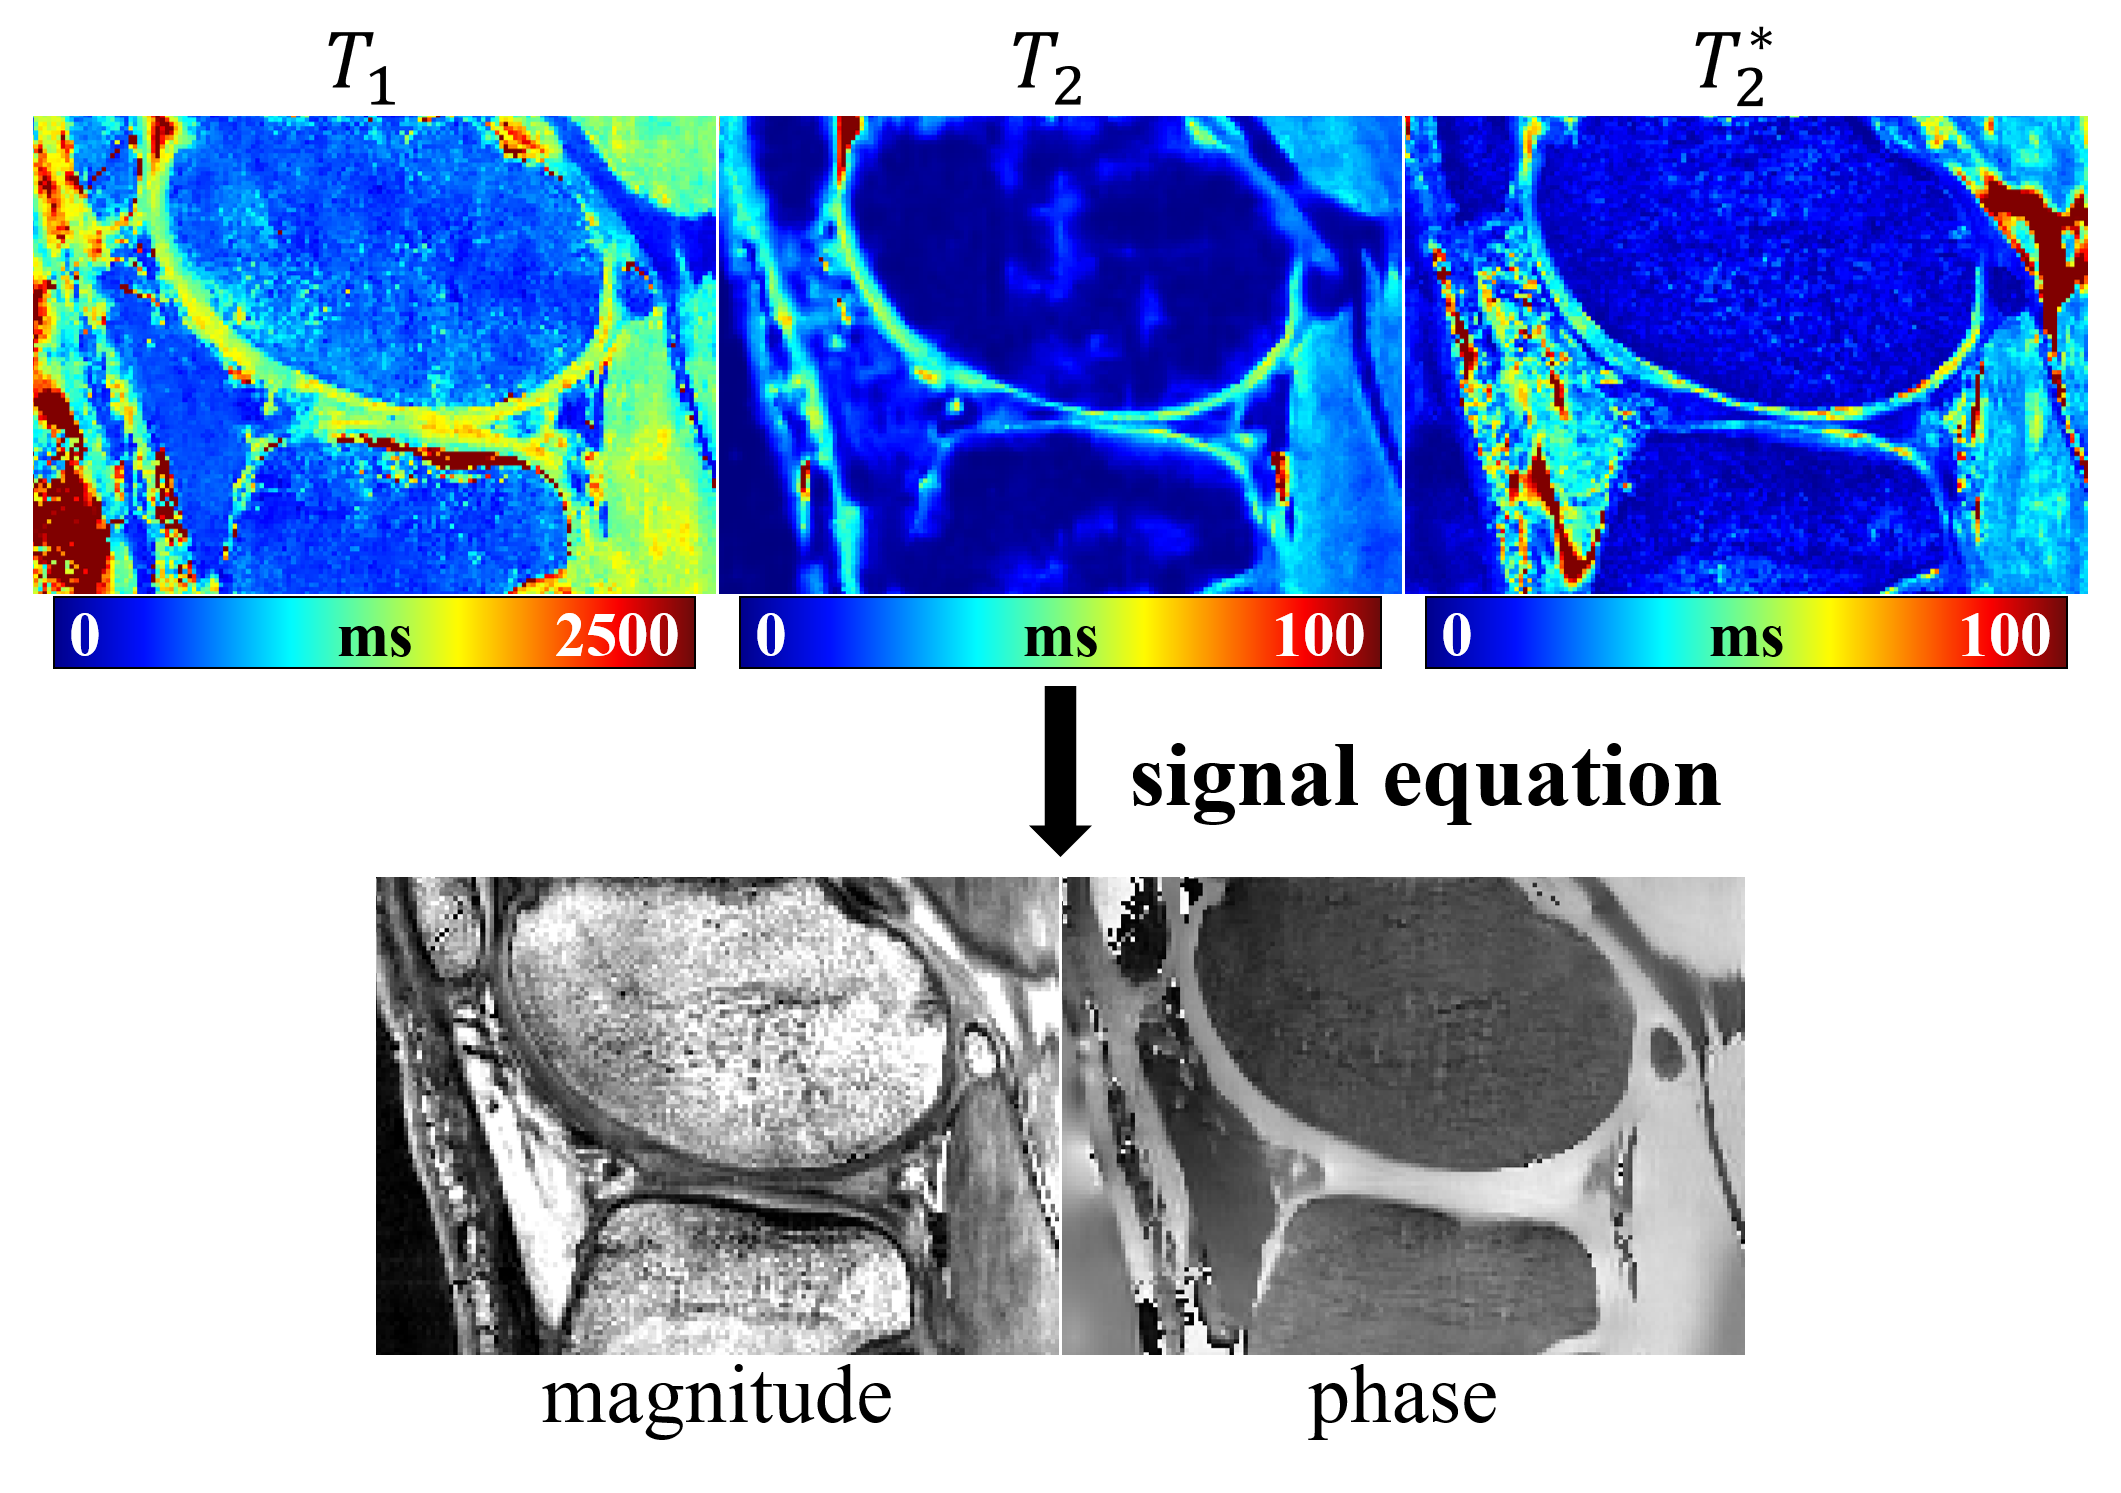
Figure 2. The representative image slices of $$$T_1$$$, $$$T_2$$$ and $$$T_2^*$$$ mapping estimated by the multi-contrast framework. The magnitude and raw phase were subsequently generated using the signal equation and were used for further processing.