2457
Physics-informed vessel segmentation for χ-separation (chi-separation)1Department of Electrical and Computer Engineering, Seoul National University, Seoul, Korea, Republic of
Synopsis
Keywords: Susceptibility/QSM, Quantitative Susceptibility mapping, Vessels, Artifacts
Motivation: χ-separation is an advanced QSM method that provides para- and diamagnetic susceptibility maps. Despite its potential utilities, both maps reveal (erroneously) high intensity signals from vessels, hampering their applications and quantification.
Goal(s): Proposing a vessel segmentation method designed for χ-separation by utilizing physical properties of vessel signals in χ-separation.
Approach: Acquiring seeds by informing physics of vessels in χ-separation, and vessel geometry characteristics guided-region growing is implemented to generate vessel masks.
Results: Our method successfully creates vessel masks for both susceptibility maps and demonstrates to be robust to various input types. When applied to an ROI analysis, reduced variability in measurements was shown.
Impact: The novel vessel segmentation method utilizes physical properties of vessels in χ-separation for reliable and robust segmentation, providing substantially improved segmentation results. It may help us to improve downstream analysis when quantifying susceptibility of myelin or tissue iron excluding vessels.
Introduction
χ-separation (chi-separation) offers distributions of paramagnetic and diamagnetic susceptibility sources, presenting valuable information.1,2 However, both maps show erroneously high susceptibility values in vessels3,4. In most studies, vessels are not of interest, interfering accurate quantification of myelin and tissue iron. For a reliable analysis, therefore, it is advantageous to remove vessels. In this study, we propose a vessel segmentation method designed for χ-separation.Methods
The proposed method is illustrated in Fig. 1.[Step 1: Seed selection]
The seeds for large and small vessels are obtained separately because small vessels are difficult to be differentiated from non-vessel small structures or noise when processed with large vessels. For large vessels, we first applied a high pass filter to R2* to suppress non-vessel structures5. Then, vesselness6,7, likelihood of being a vessel, was calculated and thresholded with a high value (mean(vesselness)+3·STD(vesselness); see Frangi filter results in Fig. 2). For small vessels, maximum intensity projection (MIP) was applied for χpara∙|χdia| to enhance the small vessel visibility.8 Large vessel seeds were removed from MIP. Then vesselness was calculated and thresholded with a low value (mean(vesselness)+0.5·STD(vesselness)). These seeds were back-projected to the original location in 3D. Finally, both large and small vessel seeds are combined, generating the total seed.
[Step 2: Vessel geometry characteristics guided-region growing & non-vessel structure removal]
If a voxel (q) adjacent to a seed (p) has intensity higher than the upper limit (mean(χ(total_seed=1))+0.5·STD(χ(total_seed=1)), where χ is χpara or χdia) that voxel was added to the vessel mask. If the intensity is between the upper and lower limit (mean(χ(total_seed=1))-0.5·STD(χ(total_seed=1)), it was only incorporated into the mask if the following condition was satisfied:
$$v(q)\geq 0.5 \cdot \frac{1-\Omega(p,q)}{R\cdot(1-e^{-\lambda_2(q)\cdot \lambda_3(q)})}\qquad (Eq .1)$$
where v is vesselness7, Ω is directionality similarity9, R($$$ =\begin{cases}\frac{I(p)}{I(q)}&\text{ if }\,I(p)\leq I(q)\\\frac{I(q)}{I(p)}&\text{ if }\,I(p)>I(q)\end{cases}$$$ ,where I denotes the intensity) is intensity similarity, and λ2(q)·λ3(q) is anisotropy (two largest eigenvalues from the Hessian matrix of voxel intensity6).
To exclude non-vessel structures, connected components (CC) whose average value of anisotropy is lower than threshold (A) were removed assuming high anisotropy in vessels. This threshold was determined heuristically by each subject in the range of [0.0001, 0.004].
$$\left\|\lambda_2(CC)\cdot\lambda_3(CC) \right\| < A \qquad (Eq. 2)$$
Evaluation The proposed method was compared with a Frangi filter6 and reference 10 with and without R2* as input. The inputs for the Frangi filter were χpara(or χdia) whereas the inputs for the reference 10 algorithm were SWI, χpara(or χdia) with and without R2*. To test the robustness, the method was applied to various resolutions and field strengths (1.5×1.5×1.5 mm3 at 3 T, 1×1×1 mm3 at 3 T, 0.8×0.8×1.2 mm3 at 7 T and 0.65×0.65×0.65 mm3 at 7 T) and χ-separation algorithms (COSMOS11, MEDI, iLSQR, and χ-sepnet-R2*12). Additionally, the method was applied to R2*, QSM and SWI by altering the inputs (red dotted boxes in Fig. 1) to the corresponding contrast. All results were displayed in MIP, spanning 12 mm.
Applications (1) Using 6 subject data for χ-separation-COSMOS, quantitative metrics (RMSE, PSNR and SSIM) were calculated to evaluate the performance of χ-sepnet-R2*12 with, without and within the vessel mask. Each metric was assessed with respect to χ-separation-COSMOS11. (2) Using 106 subjects, an χ-separation atlas was developed with and without the vessel mask. Twenty ROIs13,14 were analyzed to quantify the proportion of vessel and the population average of the susceptibility. All studies were IRB-approved.
Results
Our method successfully generated vessel masks for χpara and χdia (Fig. 2). In particular, it excluded non-vessel structures (yellow arrows in Fig. 2), demonstrating superior performance when compared to the conventional methods. When tested for different resolutions, field strengths and χ-separation algorithms, the proposed method yielded robust outcomes (Fig. 3). For R2*, QSM or SWI images, the method still created reasonably good masks (Fig. 4).When χ-sepnet-R2* maps were compared to χ-separation-COSMOS, the metrics computed with the vessel mask (i.e., excluding vessels) reported improved accuracy (Fig. 5), suggesting that the vessels are the source of variability. In the χ-separation atlas, caudate in χpara and genu in χdia revealed the highest vessel occupation (≥ 1% voxels), demonstrating statistically significant decrease in the susceptibility values after applying the mask (caudate: 49.6±7.0 ppb to 47.4±6.9; genu of corpus callosum: 30.3±2.4 ppb to 29.3±2.3 ppb; p < 0.05/20), confirming the value of the vessel mask in accurate estimation of susceptibility.
Discussion and Conclusion
The proposed vessel segmentation method shows excellent performance in generating a vessel mask. When the mask is applied for the analysis, it improved the results by reducing variability from vessels. Our method may have wide clinical applications as suggested in the previous studies in QSM and SWI.15,16Acknowledgements
References
1. Shin, H.-G. et al. χ-separation: Magnetic susceptibility source separation toward iron and myelin mapping in the brain. NeuroImage 240, 118371 (2021).
2. Kim, W. et al. χ-Separation Imaging for Diagnosis of Multiple Sclerosis versus Neuromyelitis Optica Spectrum Disorder. Radiology 307, e220941 (2023).
3. Nishimura, D. G., Jackson, J. I. & Pauly, J. M. On the nature and reduction of the displacement artifact in flow images. Magn. Reson. Med. 22, 481–492 (1991).
4. Larson, T. C., Kelly, W. M., Ehman, R. L. & Wehrli, F. W. Spatial misregistration of vascular flow during MR imaging of the CNS: cause and clinical significance. AJNR Am. J. Neuroradiol. 11, 1041–8 (1990).
5. Jin, Z., Xia, L., Zhang, M. & Du, Y. P. Background-Suppressed MR Venography of the Brain Using Magnitude Data: A High-Pass Filtering Approach. Comput. Math. Methods Med. 2014, 812785 (2014).
6. Frangi, A. F., Niessen, W. J., Vincken, K. L. & Viergever, M. A. Medical Image Computing and Computer-Assisted Intervention — MICCAI’98, First International Conference Cambridge, MA, USA, October 11–13, 1998 Proceedings. Lect. Notes Comput. Sci. 130–137 (2006) doi:10.1007/bfb0056195.
7. Alhasson, H. F., Alharbi, S. S. & Obara, B. 2D and 3D Vascular Structures Enhancement via Multiscale Fractional Anisotropy Tensor. arXiv (2019) doi:10.48550/arxiv.1902.00550.
8. Murayama, K. et al. Preliminary study of time maximum intensity projection computed tomography imaging for the detection of early ischemic change in patient with acute ischemic stroke. Medicine 97, e9906 (2018).
9. Kerkeni, A., Benabdallah, A., Manzanera, A. & Bedoui, M. H. A coronary artery segmentation method based on multiscale analysis and region growing. Comput. Méd. Imaging Graph. 48, 49–61 (2016).
10. Straub, S. et al. A novel gradient echo data-based vein segmentation algorithm and its application for the detection of regional cerebral differences in venous susceptibility. NeuroImage 250, 118931 (2022).
11. Shin, H.-G. et al. chi-separation using multi-orientation data in invivo and exvivo brains: Visualization of histology up to the resolution of 350 μm. Proceedings of International Society of Magnetic Resonance in Medicine 30, 0771 (2022)
12. Kim, M. et al. Chi-sepnet: Susceptibility source separation using deep neural network. Proceedings of International Society of Magnetic Resonance in Medicine 30, 2464 (2022)
13. Min, K et al. A human brain atlas of chi-separation for normative iron and myelin, Arxiv preprint (2023)
14. Oishi, K. et al. Human brain white matter atlas: Identification and assignment of common anatomical structures in superficial white matter. NeuroImage 43, 447–457 (2008).
15. Ma, Y. et al. Quantification of brain oxygen extraction fraction using QSM and a hyperoxic challenge. Magn. Reson. Med. 84, 3271–3285 (2020).
16. Ge, Y. et al. Diminished visibility of cerebral venous vasculature in multiple sclerosis by susceptibility‐weighted imaging at 3.0 Tesla. J. Magn. Reson. Imaging 29, 1190–1194 (2009).
Figures
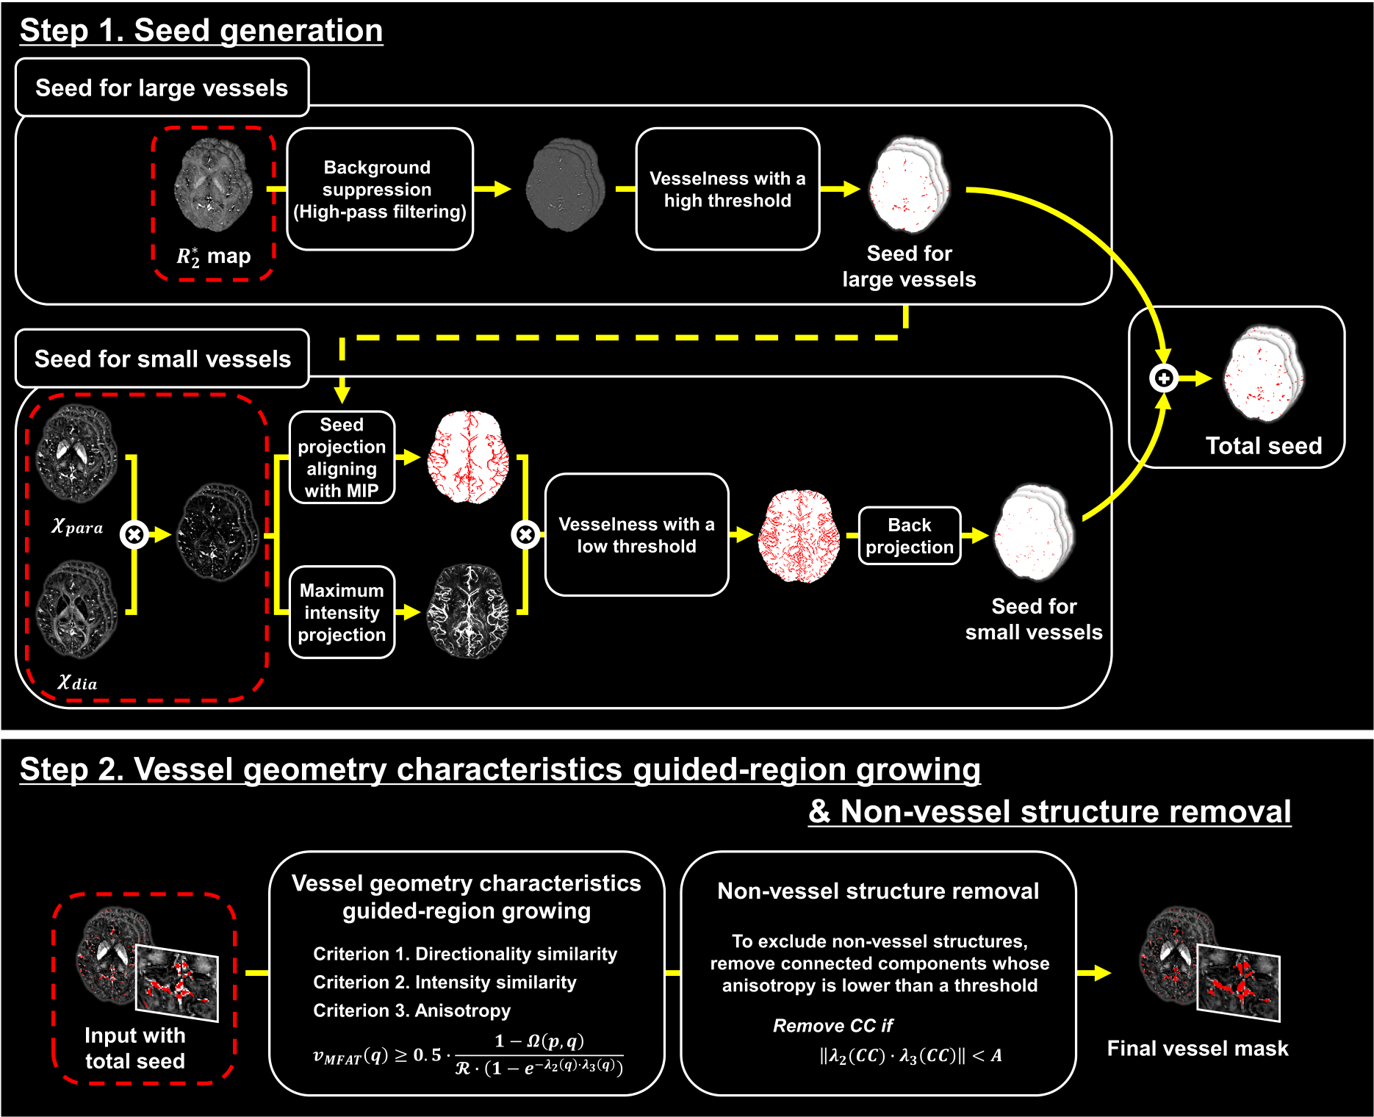
Figure 1. Overview of the proposed pipeline for vessel segmentation. In Step 1, seeds are generated for large and small vessels separately to improve small vessels seeds. For large vessels, a R2* map that contains large vessels was processed. For small vessels, the product of χpara and χdia was utilized to enhance the visibility of small vessels. Then both seeds are summed to generate the total seed. In Step 2, the vessel mask is created by region growing guided by the characteristics of vessel geometry. After that, non-vessel structures are excluded by removing low anisotropy components.
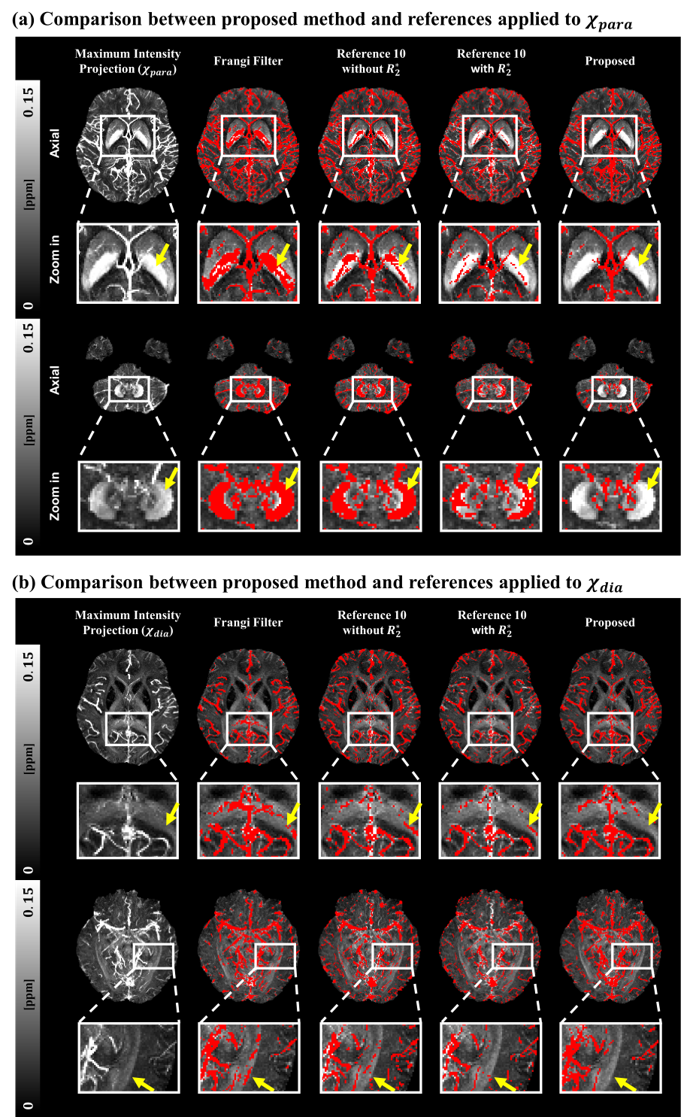
Figure 2. Comparison of the proposed vessel segmentation algorithm with the conventional methods applied to (a) χpara and (b) χdia. Deep gray matters such as globus pallidus and dentate nucleus, and white matters including the splenium of corpus callosum and optic radiation are erroneously segmented in the conventional methods (yellow arrows). On the other hand, our method shows excellent performance in vessel segmentation excluding non-vessel structures.
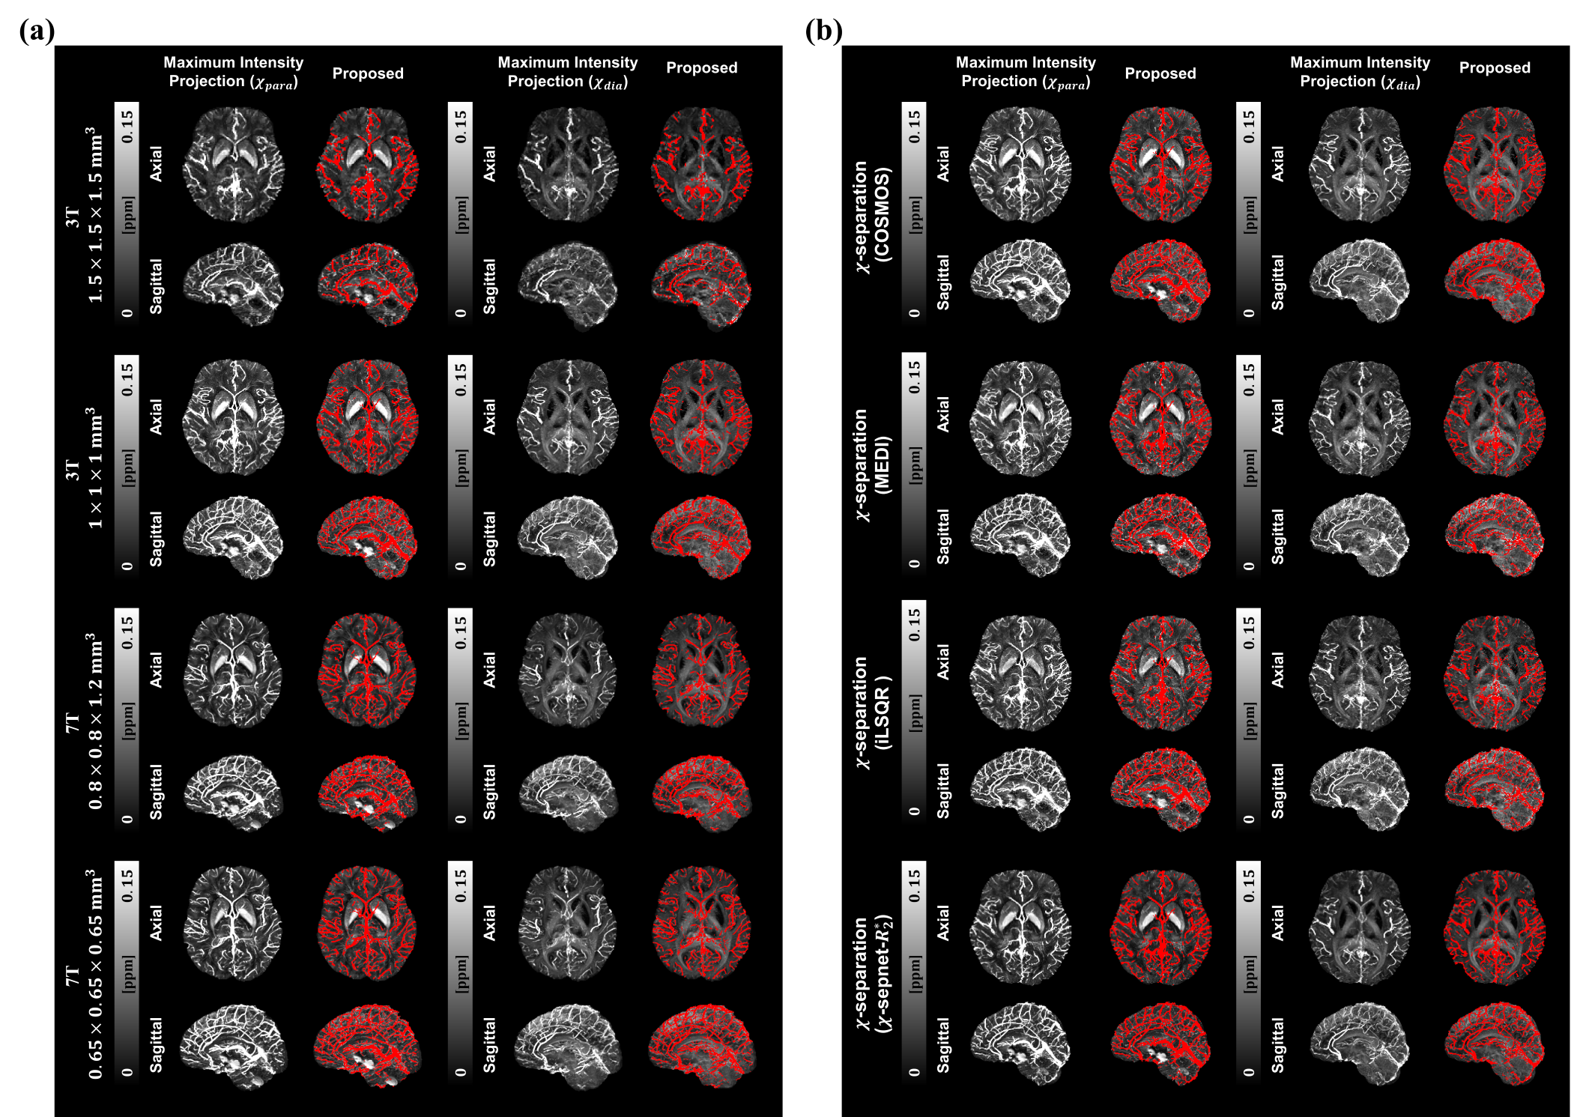
Figure 3. Demonstration of the robustness of the proposed method for different image resolutions and/or field strengths and χ-separation algorithms. (a) Vessel segmentation results from 1.5×1.5×1.5 mm3 at 3 T, 1×1×1 mm3 at 3 T, 0.8×0.8×1.2 mm3 at 7 T and 0.65×0.65×0.65 mm3 at 7 T. (b) Results from the four different χ-separation algorithms: COSMOS, MEDI, iLSQR, and χ-sepnet-R2*. All results show successful segmentation of vessels, demonstrating robustness of the proposed method.
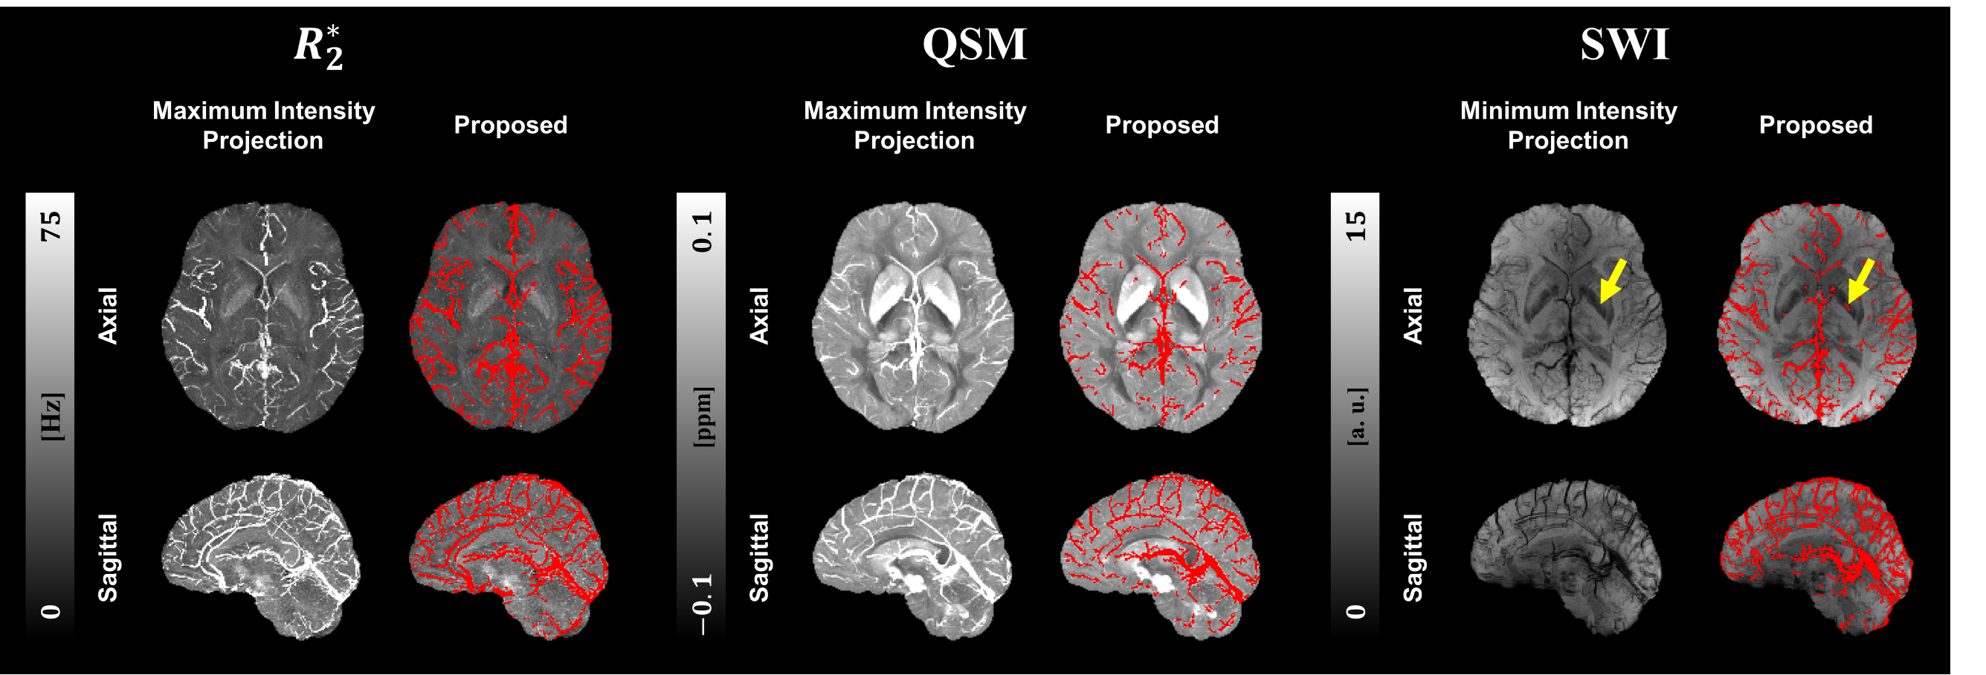
Figure 4. Applications of the proposed method to R2*, QSM and SWI images. The input to the algorithm was modified to accommodate the different contrasts. R2*, and QSM maps show robust and successful segmentation results while SWI results have possibility to include non-vessel structures due to a non-uniformly masking on deep gray matters generated from phase map. This mask can increase anisotropy criterion and make trade-off between including small vessels and excluding non-vessel structures.
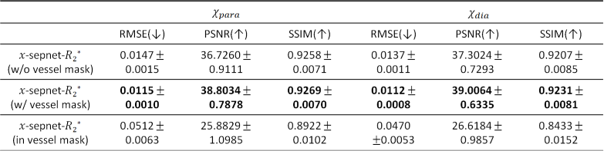
Figure 5. Reconstruction quality of χ-sepnet-R2* with respect to χ-separation-COSMOS when analyzed with and without the vessel mask. Compared to the metrics without the vessel mask (first column), the metrics with the vessel mask (second column) report better results (a decreased RMSE, and increased PSNR and SSIM with smaller standard deviations). The large standard deviations in the vessel mask (third row) indicate that vessels, which may not be of interest in many clinical applications, introduce the largest variability.