2456
Effect of cortical orientation relative to the magnetic field on quantitative susceptibility mapping in the grey matter1Advanced Imaging Research Center, UT Southwestern Medical Center, Dallas, TX, United States, 2Radiology, UT Southwestern Medical Center, Dallas, TX, United States
Synopsis
Keywords: Susceptibility/QSM, Quantitative Susceptibility mapping, Cortex orientation, Myelin concentration
Motivation: Effect of cortex orientation relative to the magnetic field can impede quantitative susceptibility mapping (QSM) from being established as a robust measurement of cortical pathology.
Goal(s): To identify the significance of cortical orientation effect in QSM and its underlying contribution from cortical myelin.
Approach: QSM was performed in eight healthy subjects at isotropic 0.75mm resolution at 3T. The relationship between QSM and cortical orientation was evaluated in cortical regions across the brain. The region-specific effect strength was correlated with region-average myelin approximation.
Results: Significant orientation effect was observed in most brain regions, including significant correlation between the region-specific effect strength and myelin estimation.
Impact: This study represents an initial effort to uncover the cortex orientation effect in cortical grey matter QSM result towards establishing QSM as a robust clinical tool for cortical pathology.
INTRODUCTION
With high contrast-to-noise and signal-to-noise ratios at high field, quantitative susceptibility mapping (QSM) is promising for characterizing cortical grey matter pathology with high resolution1 in multiple sclerosis2, Alzheimer’s disease3, etc. However, its underlying contrast mechanism remains to be further elucidated for robust clinical applications. QSM result varies with the axon orientation relative to the magnetic field (B0) in the white matter because of the microstructural environment and anisotropic susceptibility in myelinated tissue4,5. On the other hand, no studies have confirmed such orientation effect in the cortex. The goal of this study was to examine the significance of the cortical orientation effect in QSM and identify its potential correlation with cortical myelin concentration.METHODS
MRI experimentsExperiments were performed on a 3 T MRI scanner (Prisma, Siemens) using a commercial 64-channel head-neck RF coil. Eight healthy subjects were recruited with signed consent (age: 18 to 68 years old, mean age: 45 years old, 5 males) under an approved IRB protocol. The QSM imaging protocol was a multi-shot 3D echo-planar-imaging (EPI) sequence including four echo times (TE) from 13.4 to 52.0 ms. Other imaging parameters included resolution=isotropic 0.75 mm, field of view (FOV)=240×180×132 mm3, flip angle=20°, TR=68.4 ms, EPI factor=3, acceleration rate=2×2 with shot-selective controlled aliasing in parallel imaging (CAIPI)6, averages=3 and total scan time=14.2 min. Here, the EPI factor measures the number of k-space lines at each TE. In this sequence, volumetric navigator images7 were acquired simultaneously for motion and magnetic field (B0) change correction to improve the high-resolution data robustness1. In addition, T1-weighted MPRAGE images were acquired with isotropic 1 mm resolution for cortical segmentation.
Image reconstruction
The multi-echo 3D EPI images were reconstructed using a custom MATLAB software including retrospective motion and spatially linear B0 change correction7. QSM was processed from the complex multi-echo EPI images using the JHU/KKI QSM toolbox, including phase unwrapping8, brain extraction (BET in FSL)9, background field removal10 and dipole inversion using structural feature-based regularization11 and a L2-norm data consistency function12.
Image processing
The EPI magnitude and QSM images were coregistered to the MPRAGE images in the “greedy” software package13. Cortical layer segmentation was performed combining cortical reconstruction in Freesurfer (https://surfer.nmr.mgh.harvard.edu/) and intra-cortical surface extraction at 10 cortical depths (https://github.com/kwagstyl/surface_tools) using the “equivolume” option. Location specific QSM value and surface orientation (θ) relative to B0 were calculated on the surface vertices. Here, θ was defined as the angle between the surface normal vector and B0.
Data analysis
The relationship between χ and θ was modeled as χ=β×cos(2θ)+c in different cortical regions of interest (ROI) defined in the “DKT40” atlas14 at various cortical depths. To examine potential contribution of cortical myelin to the orientation effect, the indirect measurement of myelin using the ratio of T1-weighted over T2-weighted MRI (T1w/T2w) was used15,16. The ROI-average T1w/T2w data was correlated with the ROI-specific |β|.
RESULTS
In Fig. 1, it shows an example slice of the color-coded cortical layer segmentation and susceptibility image in one subject. In Fig. 2, the surface orientation relative to B0 is shown in one subject, highlighting the rapid orientation changes in neighboring brain regions.The orientation effect coefficients β for different cortical ROIs are shown Fig. 3 at the 50% cortical depth on the left hemisphere. Data was analyzed jointly in both hemispheres, and therefore, the same β was obtained for the right hemisphere. All β values were negative meaning that the apparent χ reached its maximum when the cortical surface oriented in parallel with the B0 direction (θ=90°). The model fitting was significant in 80% of the ROIs after Bonferroni correction at significance level of 5%.
Similar distribution of the ROI-specific |β| was observed in reference to the distribution of the myelin approximation (T1w/T2w) in Fig. 4. Fig. 5 shows a significant correlation between the ROI-specific |β| and ROI-average T1w/T2w data (Pearson’s r=0.52, p-value=0.0025).
DISCUSSION
The result χ from conventional QSM reconstruction is sensitive to the tissue anisotropic susceptibility and multi-compartment microstructural environment where water molecules reside. As a result, the QSM result can vary as the tissue structure changes direction relative to B0. Here, such effect as much as 15 ppb per cycle was observed in the cortex, in reference to previously observed 55 ppb in the optical nerve5. Besides myelin, other sources including the vasculature could contribute to this effect and remain to be determined in future studies.CONCLUSION
Significant cortical orientation effect in the QSM result was observed in the grey matter in various cortical regions. The amplitude of this effect was shown to be correlated with cortical myelin concentration.Acknowledgements
This work was funded in part by the Hamon Foundation and Texas Instrument Foundation.
References
1. van Gelderen, P. et al. Effect of motion, cortical orientation and spatial resolution on quantitative imaging of cortical R2* and magnetic susceptibility at 0.3 mm in-plane resolution at 7 T. Neuroimage 270, 119992 (2023).
2. Kakeda, S. et al. Improved Detection of Cortical Gray Matter Involvement in Multiple Sclerosis with Quantitative Susceptibility Mapping. Academic Radiology 22, 1427–1432 (2015).
3. Tuzzi, E. et al. Ultra-High Field MRI in Alzheimer’s Disease: Effective Transverse Relaxation Rate and Quantitative Susceptibility Mapping of Human Brain In Vivo and Ex Vivo compared to Histology. J Alzheimers Dis 73, 1481–1499 (2020).
4. Sati, P. et al. Micro-compartment specific T2* relaxation in the brain. Neuroimage 77, 268–278 (2013).
5. Wharton, S. & Bowtell, R. Effects of white matter microstructure on phase and susceptibility maps. Magnetic Resonance in Medicine 73, 1258–1269 (2015).
6. Hendriks, A. D. et al. Pushing functional MRI spatial and temporal resolution further: High-density receive arrays combined with shot-selective 2D CAIPIRINHA for 3D echo-planar imaging at 7 T. NMR Biomed 33, e4281 (2020).
7. Liu, J., van Gelderen, P., de Zwart, J. A. & Duyn, J. H. Reducing motion sensitivity in 3D high-resolution T2*-weighted MRI by navigator-based motion and nonlinear magnetic field correction. Neuroimage 206, 116332 (2020).
8. Abdul-Rahman, H., Gdeisat, M., Burton, D. & Lalor, M. Fast three-dimensional phase-unwrapping algorithm based on sorting by reliability following a non-continuous path. in vol. 5856 32–41 (International Society for Optics and Photonics, 2005).
9. Smith, S. M. Fast robust automated brain extraction. Hum Brain Mapp 17, 143–155 (2002).
10. Wu, B., Li, W., Guidon, A. & Liu, C. Whole brain susceptibility mapping using compressed sensing. Magn Reson Med 67, 137–147 (2012).
11. Bao, L., Li, X., Cai, C., Chen, Z. & van Zijl, P. C. M. Quantitative Susceptibility Mapping Using Structural Feature Based Collaborative Reconstruction (SFCR) in the Human Brain. IEEE Trans Med Imaging 35, 2040–2050 (2016).
12. Milovic, C., Bilgic, B., Zhao, B., Acosta-Cabronero, J. & Tejos, C. Fast nonlinear susceptibility inversion with variational regularization. Magnetic Resonance in Medicine 80, 814–821 (2018).
13. Yushkevich, P. A. et al. IC-P-174: Fast Automatic Segmentation of Hippocampal Subfields and Medial Temporal Lobe Subregions In 3 Tesla and 7 Tesla T2-Weighted MRI. Alzheimer’s & Dementia 12, P126–P127 (2016).
14. Klein, A. & Tourville, J. 101 Labeled Brain Images and a Consistent Human Cortical Labeling Protocol. Frontiers in Neuroscience 6, (2012).
15. Glasser, M. F. & Essen, D. C. V. Mapping Human Cortical Areas In Vivo Based on Myelin Content as Revealed by T1- and T2-Weighted MRI. J. Neurosci. 31, 11597–11616 (2011).
16. Glasser, M. F. et al. Empirical transmit field bias correction of T1w/T2w myelin maps. NeuroImage 258, 119360 (2022).
Figures
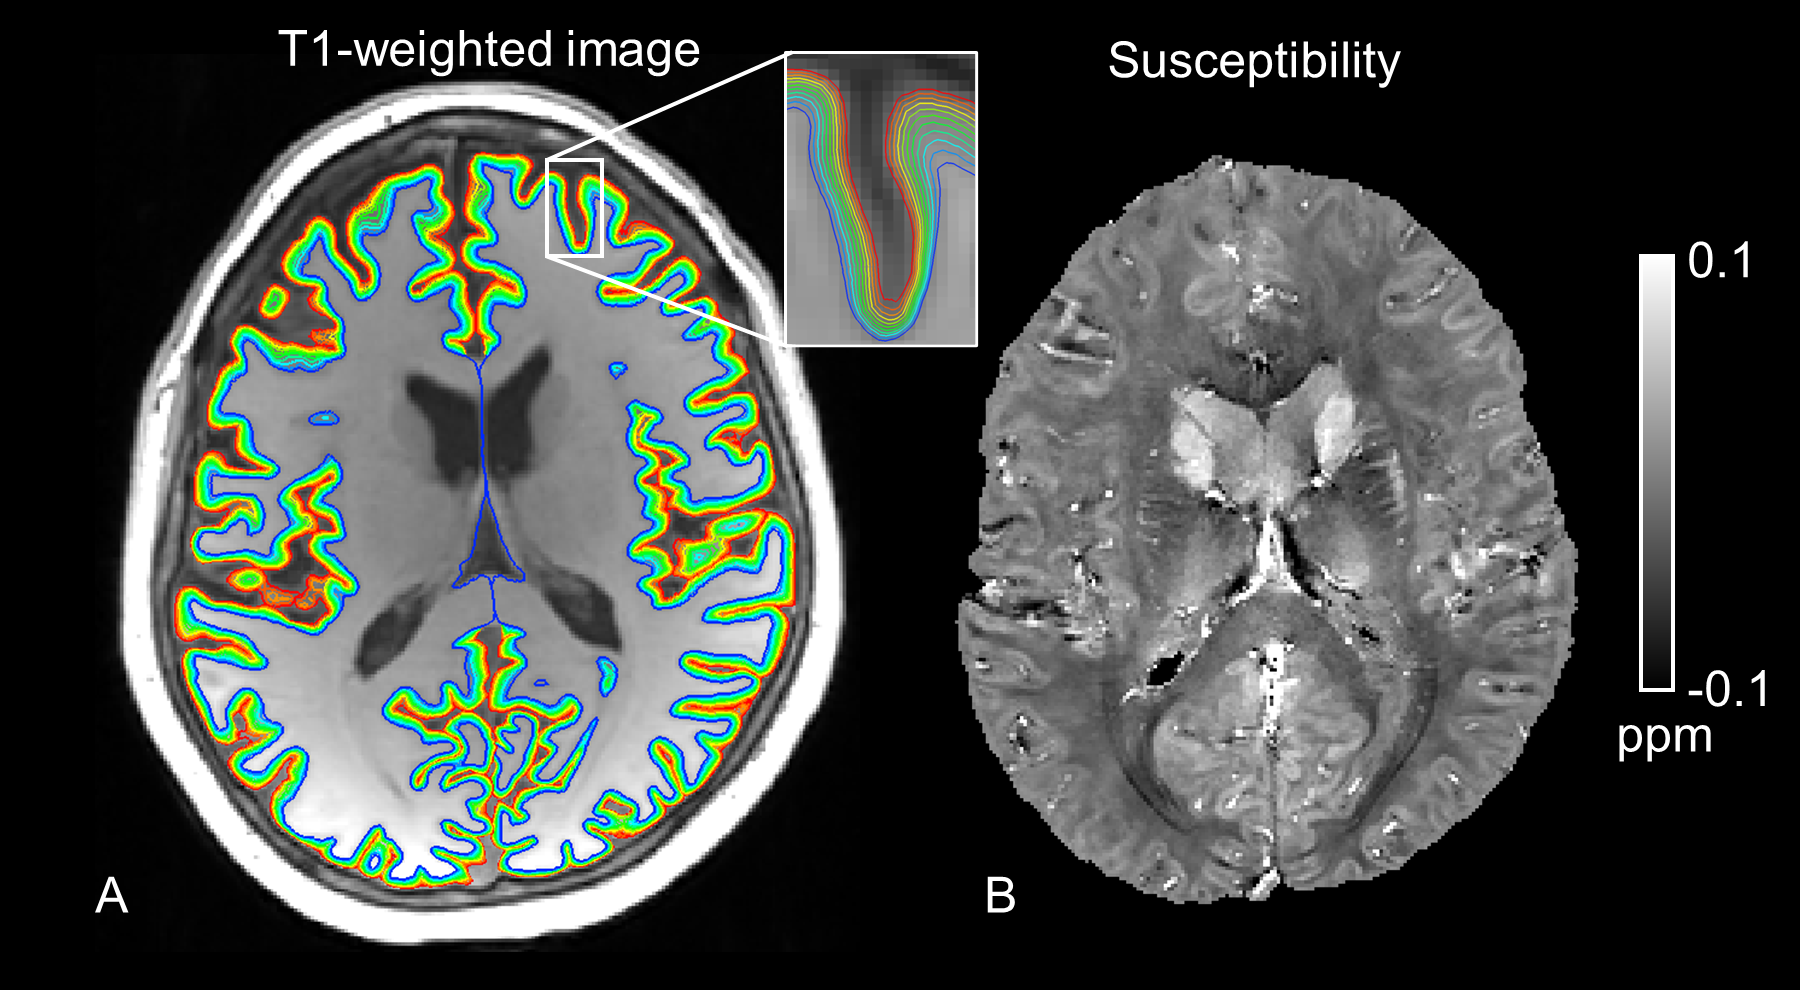
Fig. 1 A representative slice showing cortical layer segmentation and susceptibility from QSM in one subject. (A) Color-coded contours mark the 10 segmented cortical layers overlaid on the T1-weighted MPRAGE image. Blue color represents the grey and white matter boundary, and red color represents the pial surface. Other cortical layers between these two boundaries are shown in color gradient. (B) Susceptibility image in the same slice after coregistration with the MPRAGE image, with the skull removed.
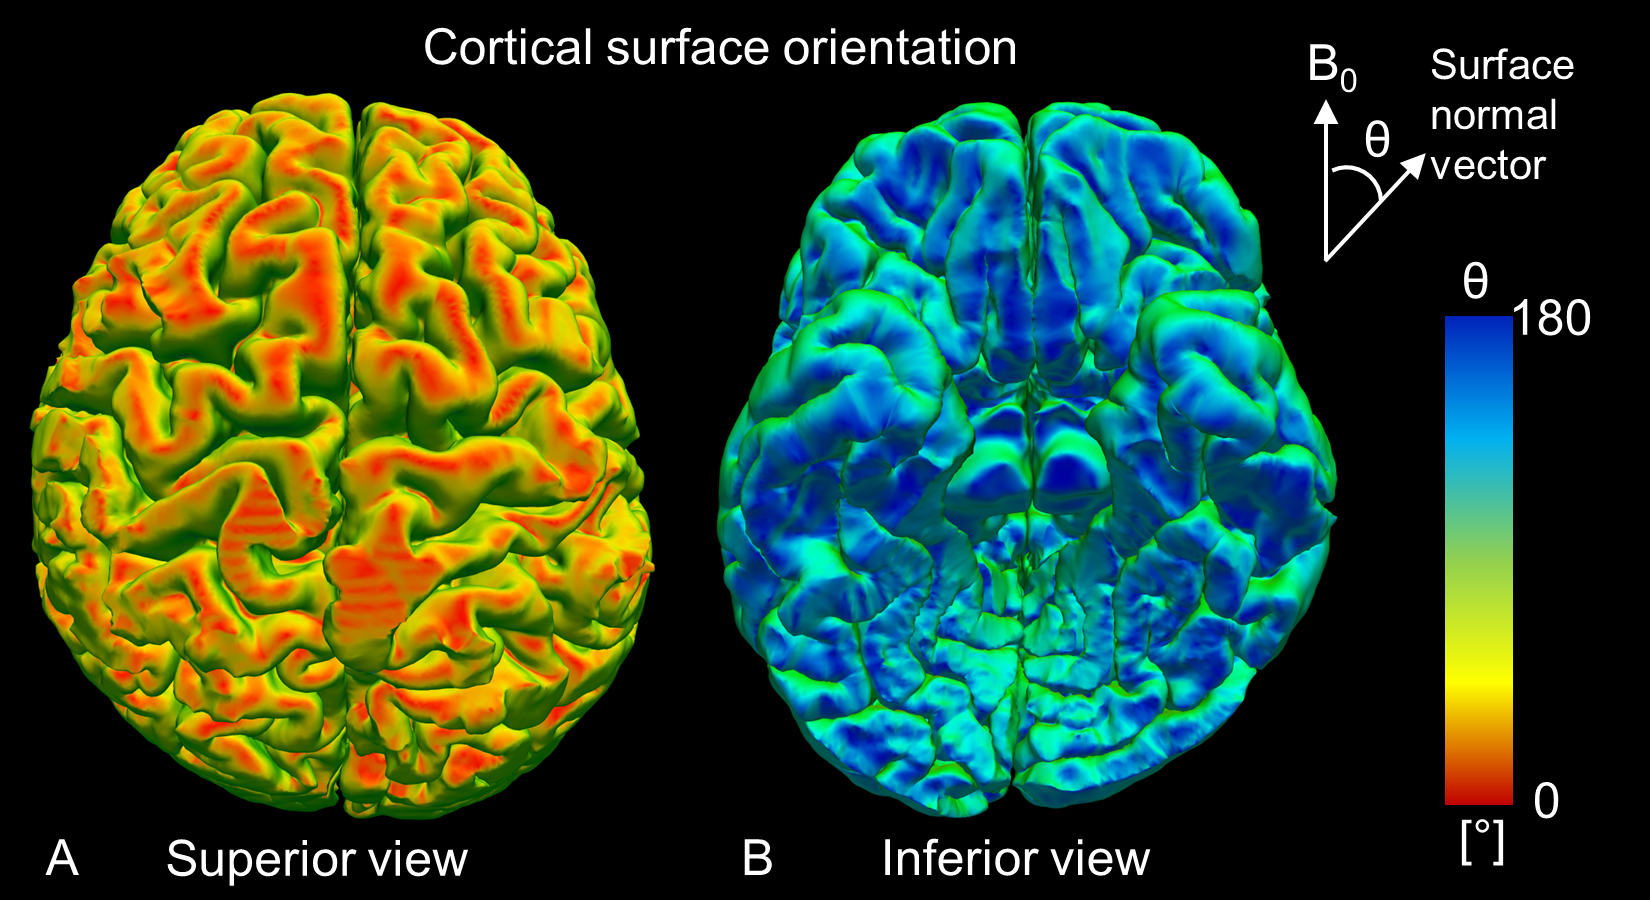
Fig. 2 Examples of the estimated cortical surface orientation θ relative to the magnetic field B0 shown on 3D rendered pial surface. Here, θ was defined as the angle between B0 and the cortical surface normal vector.
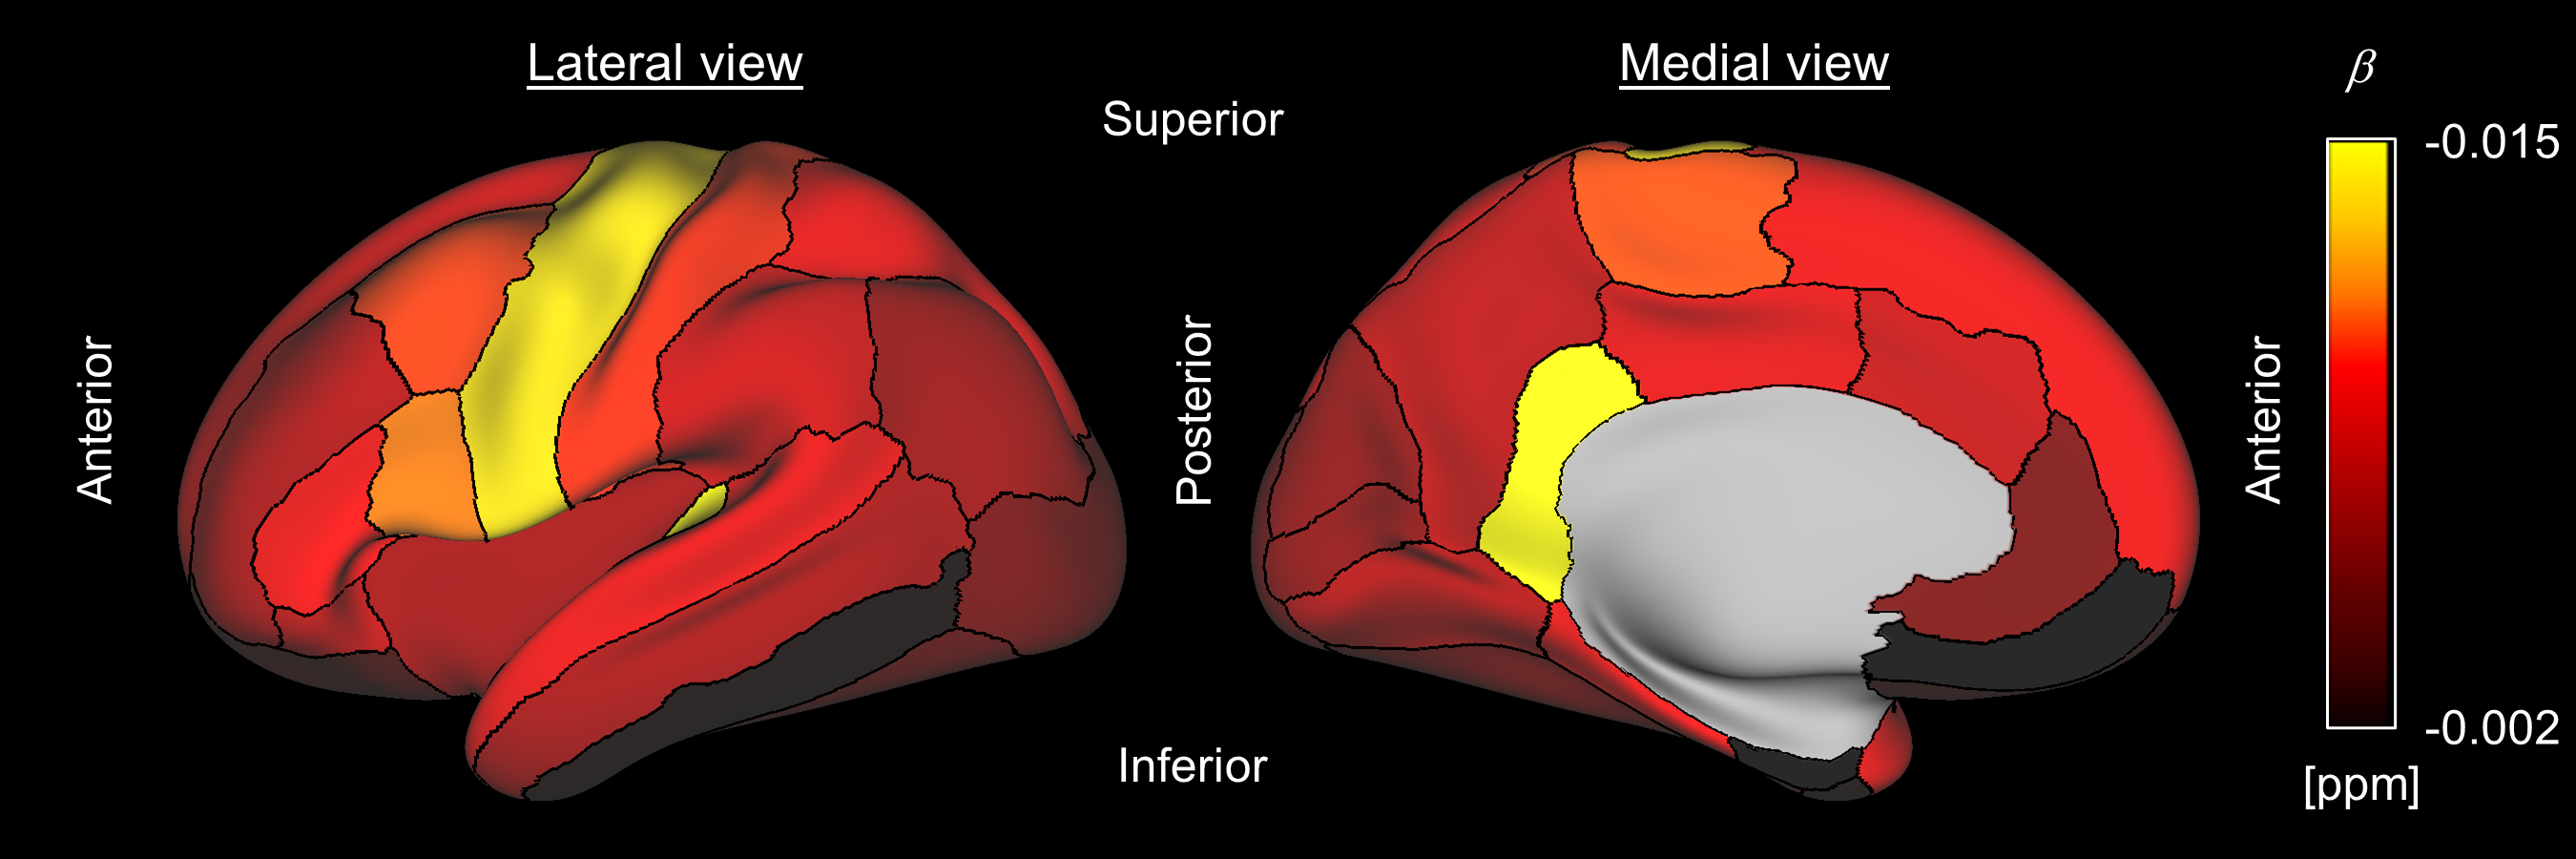
Fig. 3 Region-specific cortical orientation effect was observed in the QSM result. Shown are the measured group-level orientation effect coefficients b in different cortical regions at the 50% cortical depth in the inflated cortical surface view. Only the left hemisphere view was shown for visualization purposes because QSM data from both hemispheres were analyzed jointly.
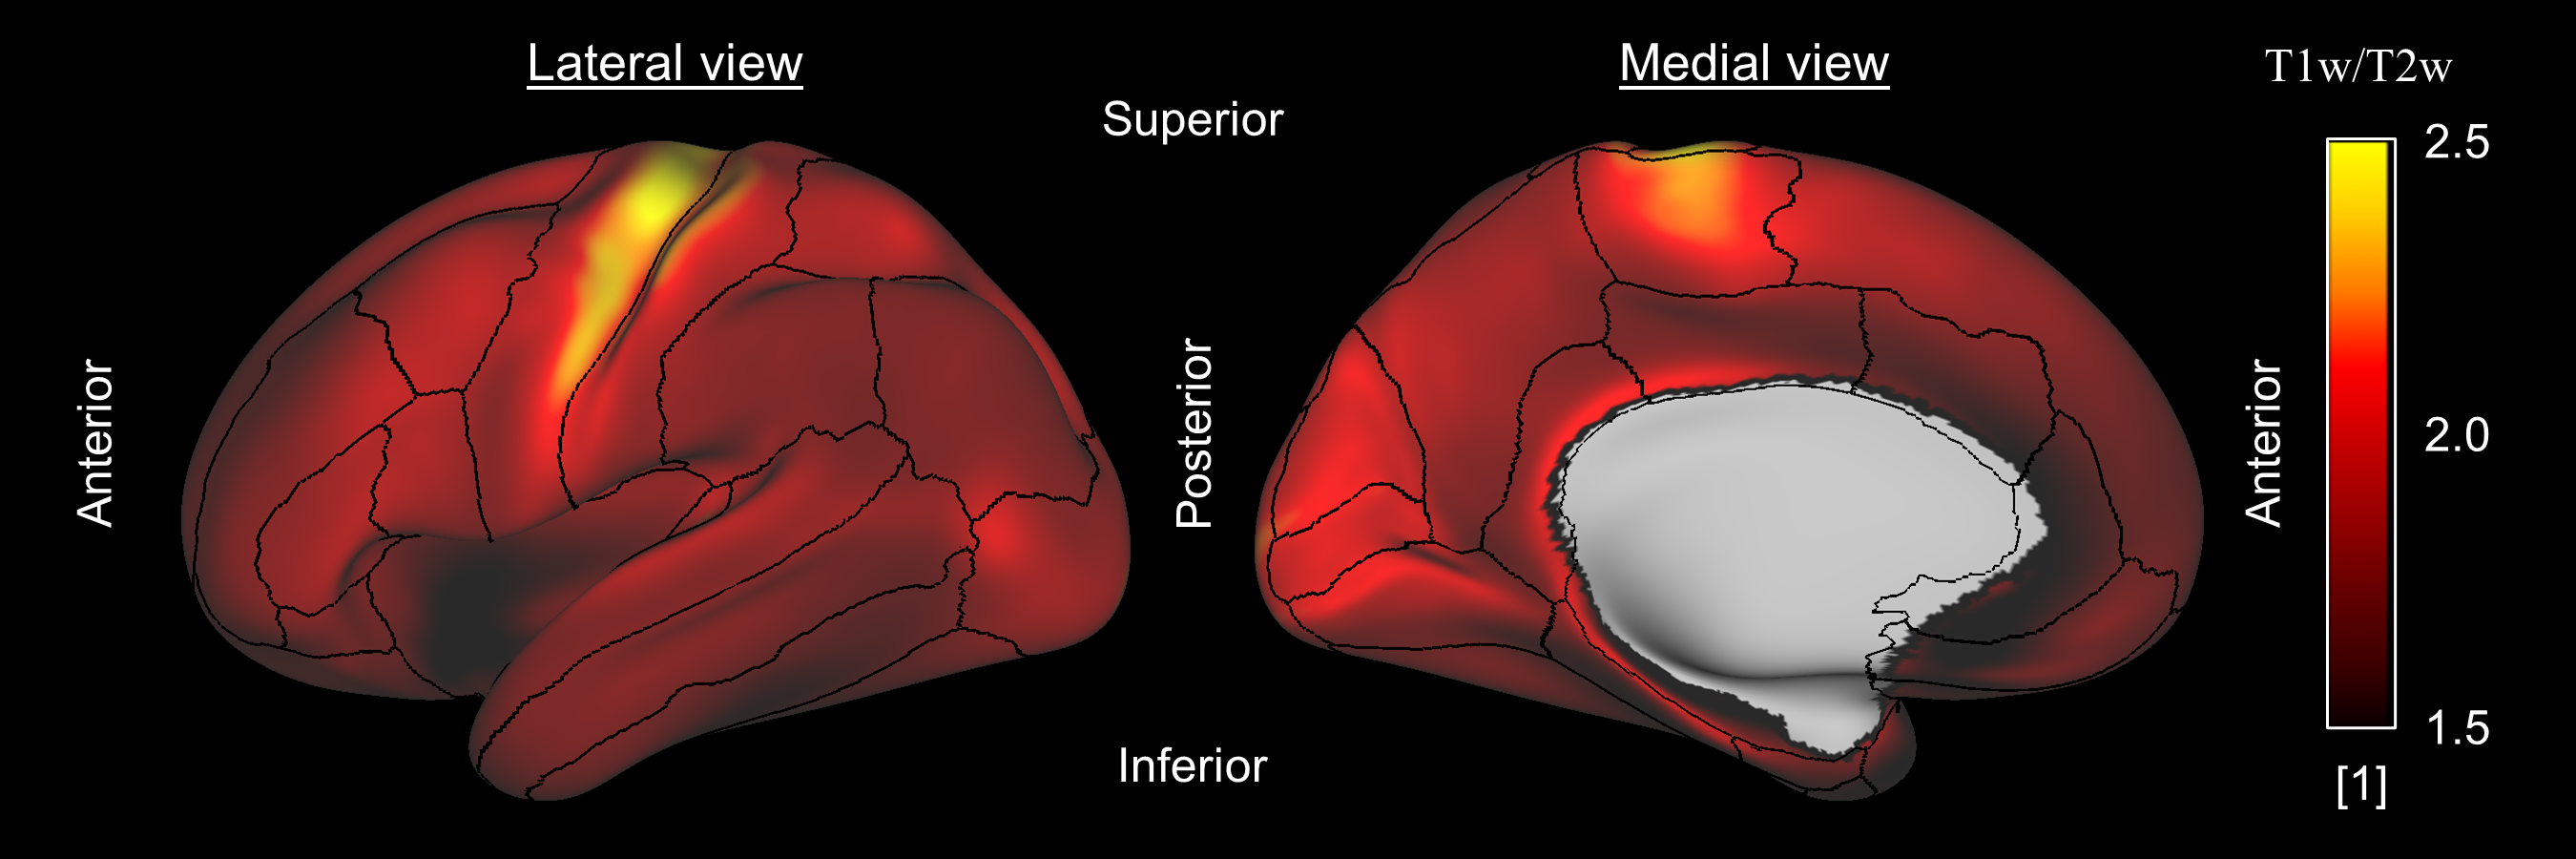
Fig. 4 Approximation of cortical myelin concentration based on the T1-weighted over T2-weighted MRI data in the group level in the left-hemisphere cortical surface view. The images were reproduced from previously reported data (Glasser et al., Neuroimage, 2022, 258:119360), which was correlated with the measured cortical orientation effect strength in the QSM result.
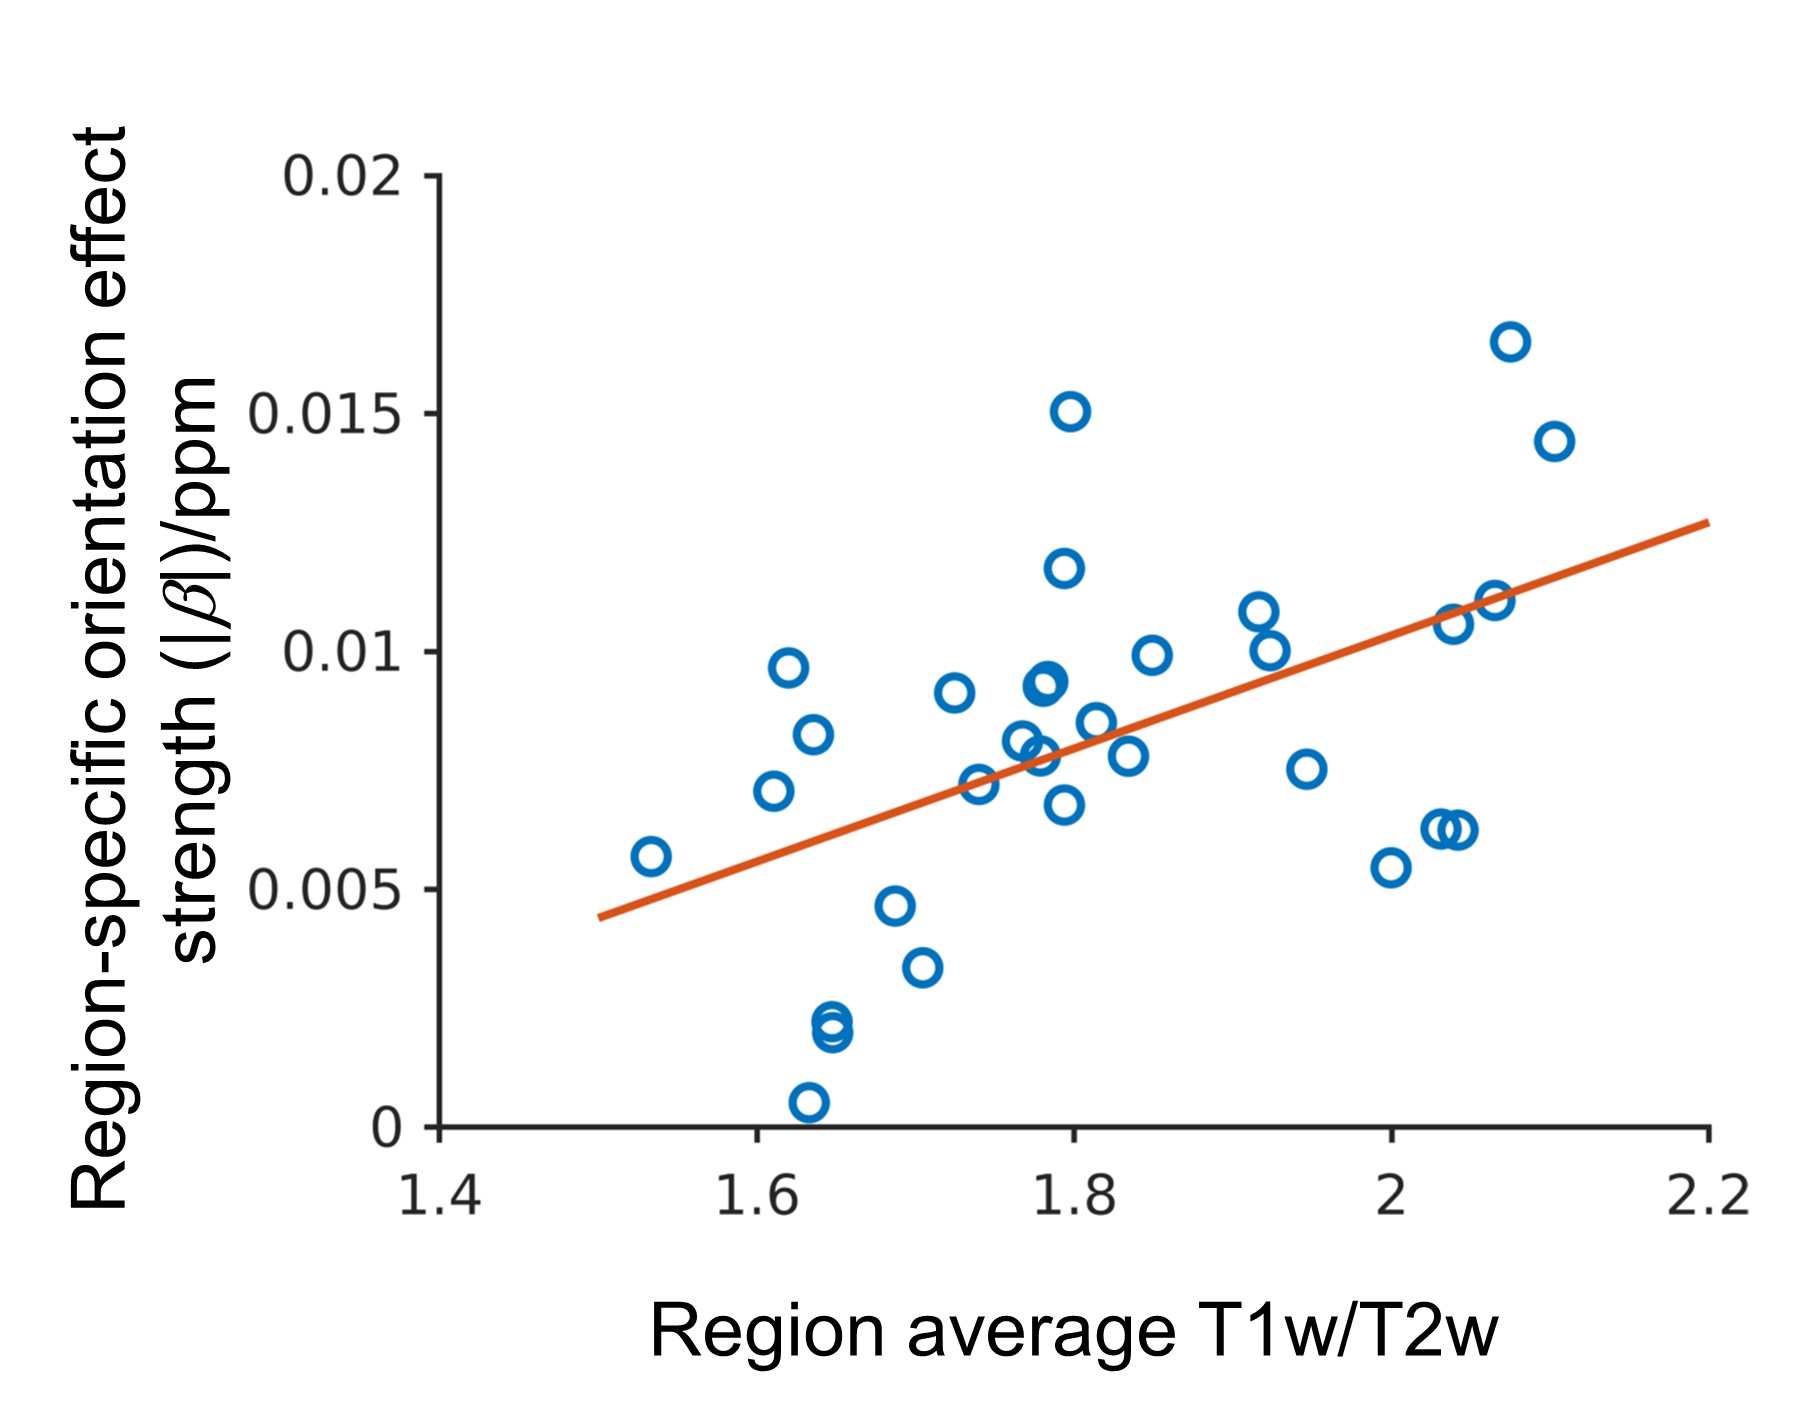
Fig. 5 Significant correlation (Pearson’s r=0.52, p-value=0.0025) was observed between the region-average myelin estimation (T1w/T2w) and region-specific orientation effect strength (|b|) in all cortical regions. Circles represent data from cortical regions, and the straight line delineates the linear fitting to the data.