2455
Estimating the Spatial Distribution of Iron in Deep Gray Matter Nuclei over the Lifespan Using Quantitative Susceptibility Mapping1Shanghai Key Laboratory of Magnetic Resonance, School of Physics and Electronic Science, East China Normal University, Shanghai, China, 2Shanghai Mental Health Center, Shanghai Jiao Tong University School of Medicine, Shanghai, China, 3MR Scientific Marketing, Siemens Healthineers, Shanghai, China, 4Department of Radiology, Weill Medical College of Cornell University, New York, NY, United States
Synopsis
Keywords: Data Processing, Aging
Motivation: Studies have demonstrated that iron accumulation rates in various gray matter nuclei are different throughout an individual’s lifetime, yet no study has quantitatively evaluated how the spatial distribution of brain iron might evolve with normal physiological development and aging.
Goal(s): This study was to investigate the change trajectories of spatially distribution of iron in the deep gray matter nuclei as a function of ageing using QSM.
Approach: 3D texture analyses were performed on QSM maps to calculate the texture features using the GLCM.
Results: The quadratic regression results characterized differential age-dependent trajectories of texture features in gray matter of basal ganglia, midbrain and cerebellum.
Impact: Quantitatively evaluated the spatial distribution properties of brain iron during lifespan might provide critical information for understand the brain development and aging, as well as predicting cognitive or neurodegenerative diseases.
Introduction
In vivo and in vitro studies have demonstrated that iron concentration increases in deep gray matter (DGM) nuclei during the lifespan 1-3. No study has quantitatively evaluated how the spatial distribution properties of magnetic susceptibility might evolve with normal physiological development and aging. The objective of this study was to demonstrate the change trajectories of spatially heterogeneous of iron in the DGM nuclei by development and ageing process from 14 to 70 years of age.Methods
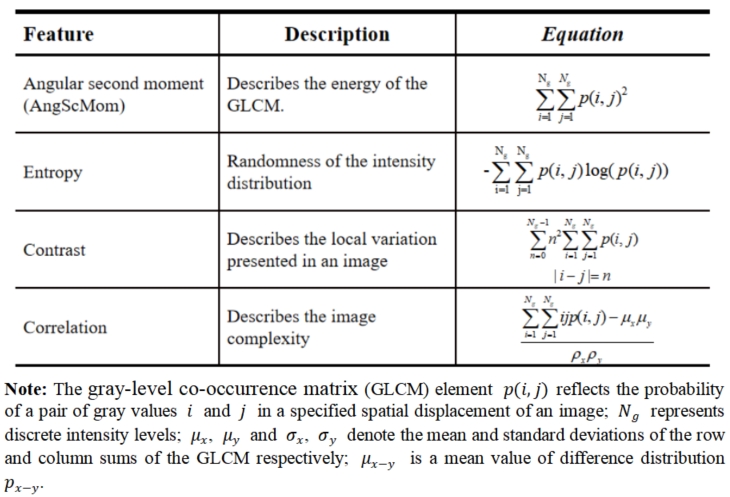
A total of 220 healthy participants with 105 males aged 14–70 years (41.65 ± 15.70 years) and 115 females aged 14–70 years (43.47 ± 15.00 years) were measured on a clinical 3T MR scanner with a 12-channel matrix coil. The QSM images were generated from a 3D spoiled GRE sequence with the following parameters: TR = 60ms, TE1 = 6.8ms, ΔTE = 6.8ms, echoes number = 8, flip angle = 15˚, FOV = 240*180 mm2, in-plane resolution=0.625*0.625mm2, slice thickness= 2mm, number of slices = 96.QSM maps were reconstructed from the phase data using the morphology enabled dipole inversion (MEDI) algorithm 4. Six iron-rich regions of interest (ROIs) assessed in this study included: CN, PUT, GP, SN, RN and DN. The 3D texture analyses were performed using MaZda software 5. The second-order texture features including angular second moment (AngScMom), entropy, contrast and correlation were derived from the gray-level co-occurrence matrix (Table1). The parameters were: 8 bits per pixel, the distance was 1 voxel, and the direction was (1,0, 0) for 0o.
The mean magnetic susceptibility and second-order texture features of the QSM images were obtained to perform quadratic regression analysis. All statistical analyses were carried out using IBM SPSS Statistics 23 and MATLAB R2019a.
Results
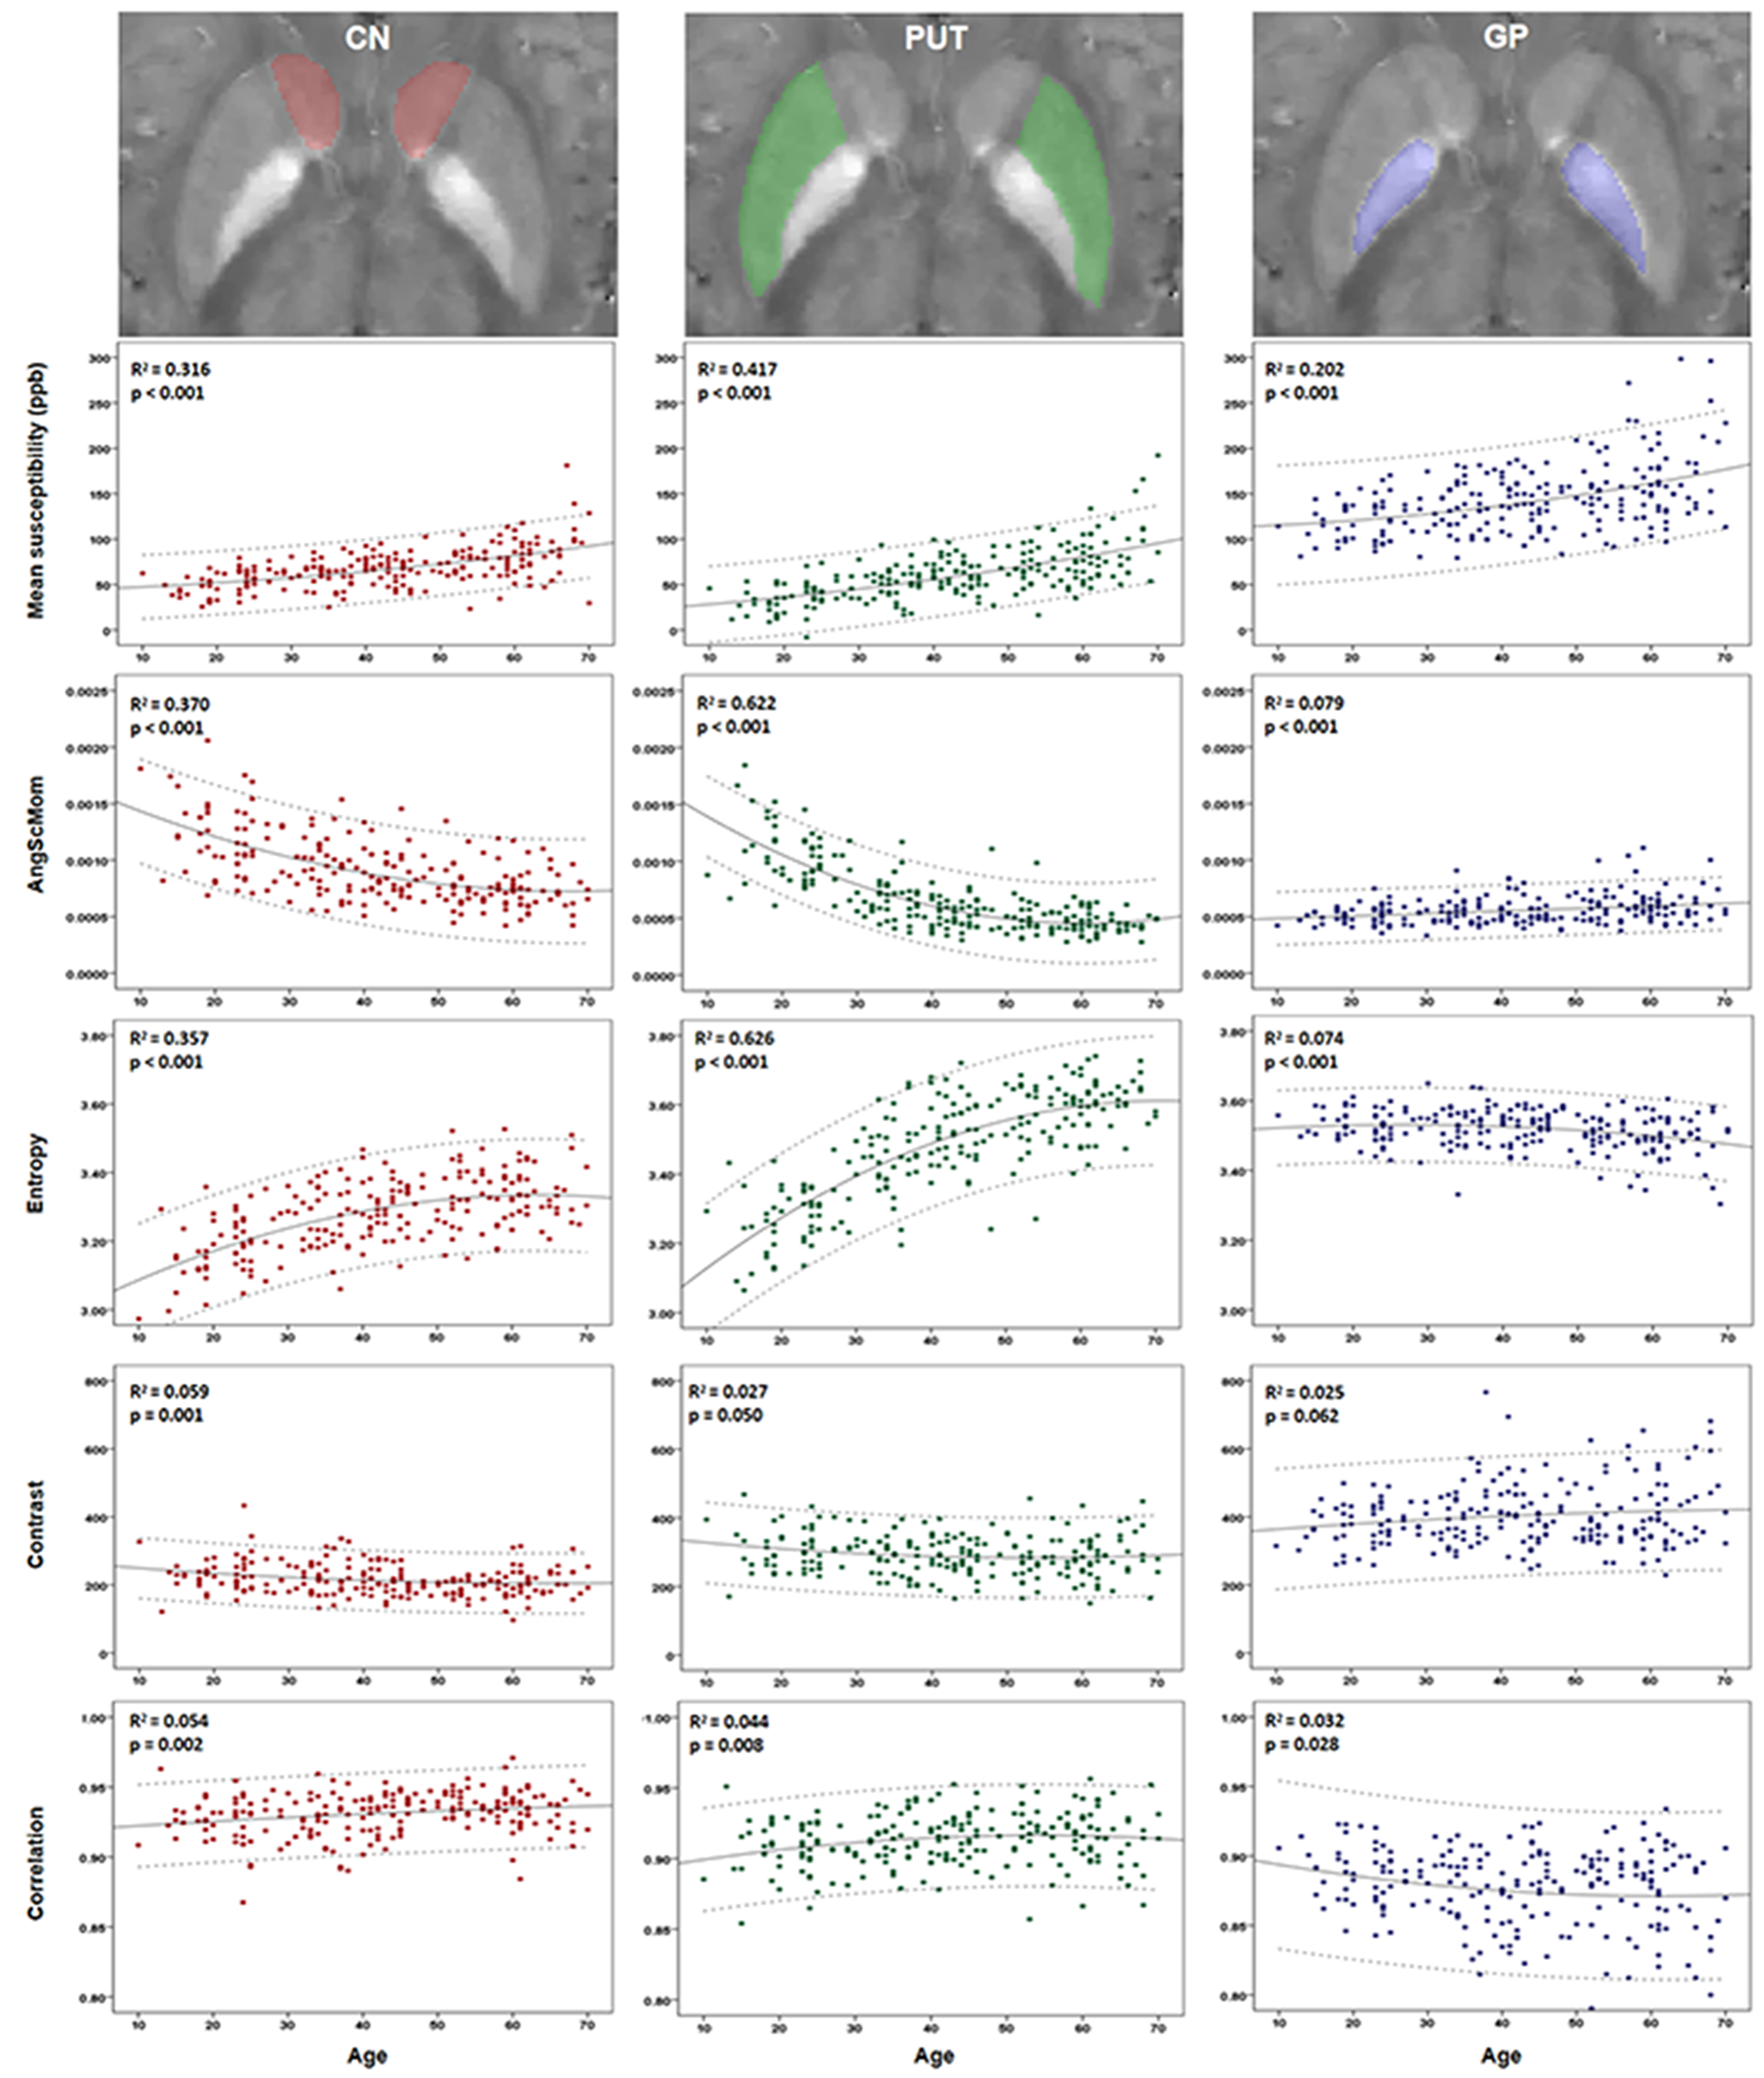
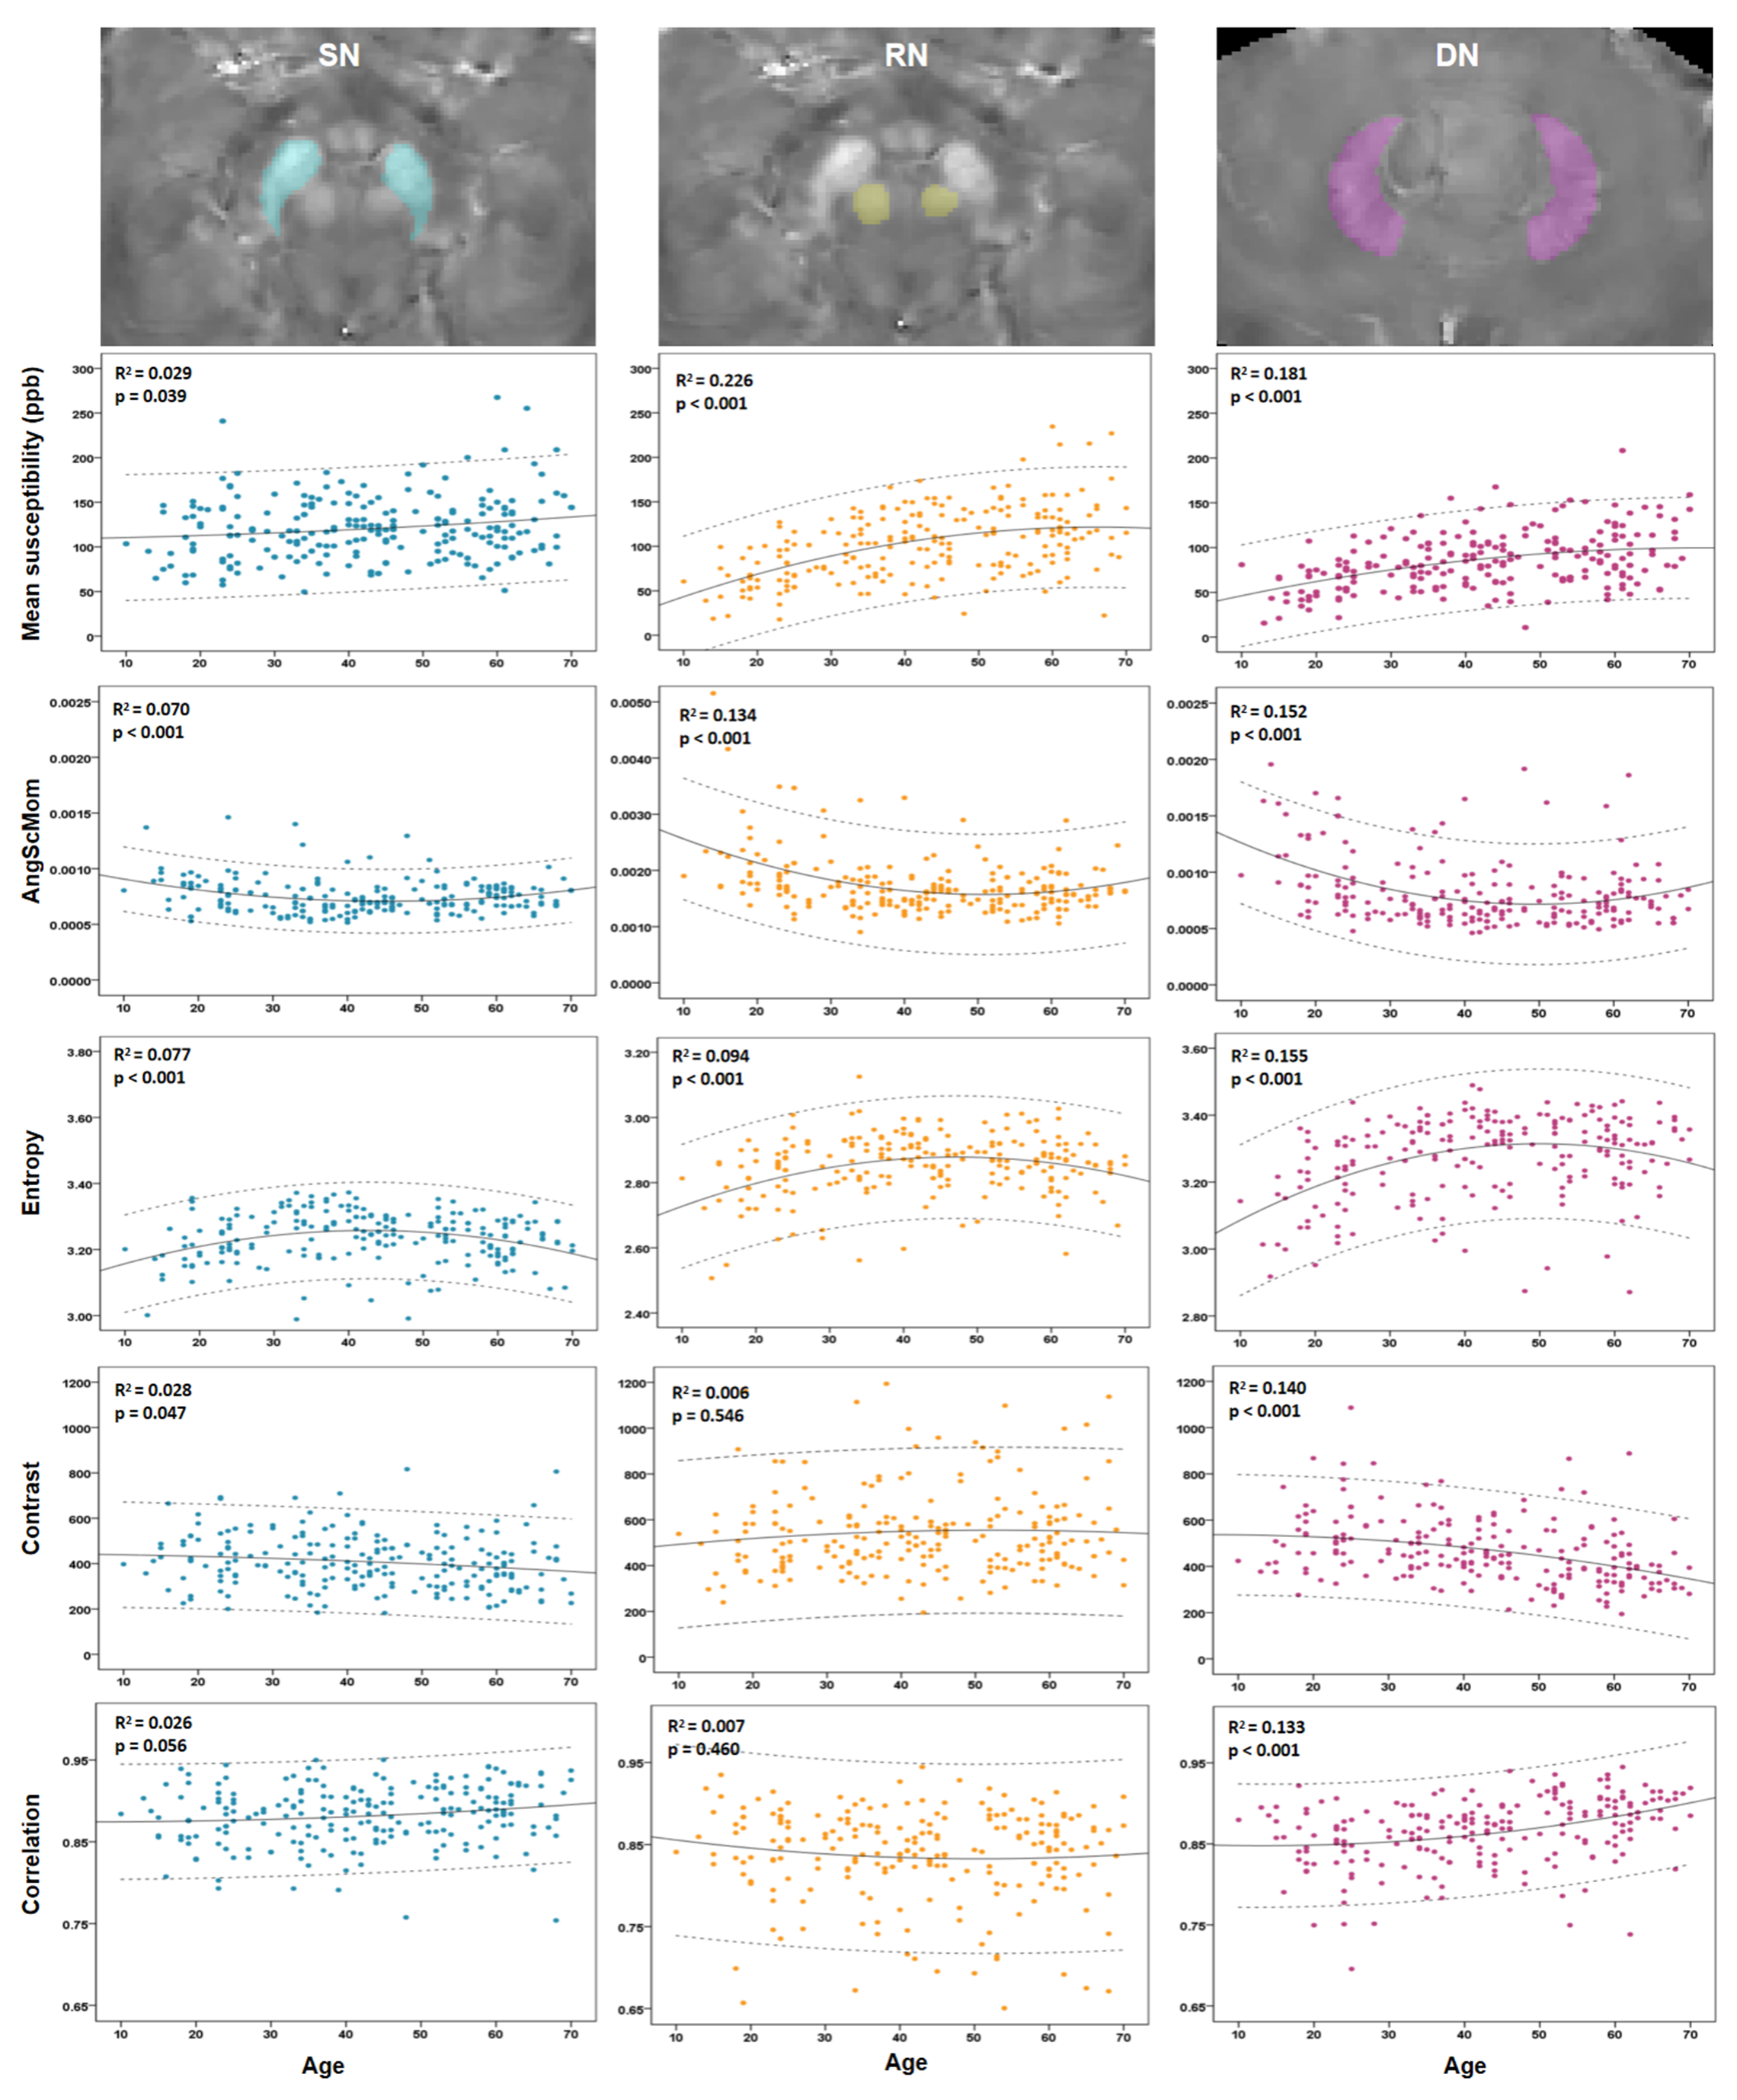
Figure 1 shows the scatter plots and quadratic fitting results of mean magnetic susceptibility and second-order texture features against age for the basal ganglia nuclei in all subjects. Quadratic relationships between AngScMom and age were the strongest for the PUT (R2 = 0.622, p < 0.001), followed by the CN (R2 = 0.370, p < 0.001) and GP (R2 = 0.079, p < 0.001). There was a significant quadratic change between entropy and age in the PUT (R2 = 0.626, p < 0.001), followed by the CN (R2 = 0.357, p < 0.001) and GP (R2 = 0.074, p < 0.001). There was a significant quadratic change between contrast and age in the CN (R2 = 0.059, p = 0.001). For correlation, quadratic relationships were found in the CN (R2 = 0.054, p = 0.002), PUT (R2 = 0.044, p = 0.008) and GP (R2 = 0.032, p = 0.028).Figure 2 plots the results of the quadratic fits of second-order texture features versus age for midbrain nuclei and cerebellum nucleus. Quadratic relationships were found for the AngScMom (SN: R2 = 0.070, p < 0.001 and RN: R2 = 0.134, p < 0.001), entropy (SN: R2 = 0.077, p < 0.001 and RN: R2 = 0.094, p < 0.001), and contrast in SN (R2 = 0.028, p = 0.047). There was a significant quadratic change in the DN for all four second-order texture features: AngScMom (R2 = 0.152, p < 0.001), contrast (R2 = 0.140, p = 0.047), correlation (R2 = 0.133, p < 0.001), and entropy (R2 = 0.155, p < 0.001).
Discussion
This was the first study to evaluate the distribution characteristic of magnetic susceptibility in-vivo through the lifespan. Differential temporal trajectories were identified in DGM nuclei for each texture feature. A significant decline of AngScMom indicates less homogeneous iron distribution through age in all ROI, except for GP. Age was associated with a strong rise of entropy in CN and PUT, which characterizes the disorder of iron distribution. Especially in the PUT, AngScMom and entropy demonstrate a particularly strong changes on homogeneous and disorder of iron distribution (R2 > 0.6) with age. Interestingly, in the GP, there were an increase in AngScMom and decrease in entropy, which indicates more homogeneous iron distribution through age. There was decrease with age in contrast values in CN, SN and DN indicating a lesser local variation of iron distribution over the entire ROI. There was increase in correlation in CN, PUT and DN indicating lower complexity of the iron distribution.Conclusions
In summary, texture analysis in the QSM could be used to describe trajectories of spatial distribution of iron deposition through the lifespan, which might provide critical information for understanding brain development and aging, as well as predicting cognitive or neurodegenerative diseases.Acknowledgements
No acknowledgement found.References
1. Hallgren B, Sourander P. The effect of age on the non-haem in iron in the human brain. J Neurochem.1958;3:41–51.
2. Langkammer C, Schweser F, Krebs N, et al. Quantitative susceptibility mapping (QSM) as a means to measure brain iron? A post mortem validation study. Neuroimage. 2012;62(3):1593-9.
3. Li G, Tong R, Zhang M, et al. Age-dependent changes in brain iron deposition and volume in deep gray matter nuclei using quantitative susceptibility mapping. Neuroimage. 2023;269:119923.
4. Liu Z, Spincemaille P, Yao Y, et al. MEDI+0: Morphology enabled dipole inversion with automatic uniform cerebrospinal fluid zero reference for quantitative susceptibility mapping. Magn Reson Med. 2018;79(5):2795-803.
5. Hwang EJ, Kim HG, Kim D, et al. Texture analyses of quantitative susceptibility maps to differentiate Alzheimer’s disease from cognitive normal and mild cognitive impairment. Medical Physics. 2016;43(8): 4718-4728.
Figures