2454
Practical Considerations for DECOMPOSE-QSM in the Human Brain1Department of Medical Physics and Biomedical Engineering, University College London, London, United Kingdom, 2Bernard and Irene Schwartz Center for Biomedical Imaging, Department of Radiology, New York University Grossman School of Medicine, New York, NY, United States, 32 Center for Advanced Imaging Innovation and Research (CAI2R), Department of Radiology, New York University Grossman School of Medicine, New York, NY, United States, 4Department of Electrical Engineering and Computer Sciences, University of California, Berkeley, Berkeley, CA, United States, 5Helen Wills Neuroscience Institute, University of California, Berkeley, Berkeley, CA, United States
Synopsis
Keywords: Susceptibility/QSM, Quantitative Susceptibility mapping, Source Separation, DECOMPOSE, Multi-echo
Motivation: DECOMPOSE-QSM is a susceptibility source separation method that has the potential for many clinical applications. However, its sensitivity to input QSM acquisition parameters and reconstruction method, and its repeatability are unknown.
Goal(s): To investigate the performance and repeatability of DECOMPOSE-QSM with QSM calculated using various acquisition schemes and multiple dipole inversion methods.
Approach: Eight different QSM dipole-inversion methods were used as inputs for DECOMPOSE-QSM. Multi-echo GRE were acquired with different protocols to evaluate reproducibility and sensitivity to the acquisition.
Results: We reduced susceptibility contrast differences from different QSM methods by normalizing input susceptibilities. DECOMPOSE-QSM results were repeatable across different subjects.
Impact: We showed that, with normalization, inputting QSM from different inversion methods yields similar DECOMPOSE-QSM separation maps and that this technique is reproducible. Taking into account its sensitivity to different acquisition parameters will facilitate further clinical applications of DECOMPOSE-QSM.
Introduction
Quantitative susceptibility mapping (QSM) is used to reconstruct bulk tissue magnetic susceptibility. Its values reflect the joint effect from both paramagnetic and diamagnetic susceptibility sources. This means the true susceptibility composition could vanish if paramagnetic and diamagnetic components co-localize within one imaging voxel. To disentangle these susceptibility sources, several techniques have recently been presented1-4. DECOMPOSE-QSM requires only multi-echo GRE data to separate QSM into diamagnetic and paramagnetic component susceptibilities (DCS and PCS) by performing non-linear parameter fitting of a three component multi-exponential model1. Previously, Ahmed et al. demonstrated its applicability to develop biomarkers for Alzheimer ‘s Disease and neurodegeneration5.DECOMPOSE-QSM requires multi-echo susceptibility maps as an input along with the corresponding multi-echo magnitude images. Various methods are available to perform QSM dipole inversion6, with each potentially yielding susceptibility maps with different contrasts. Previously it was observed that these methods also influence the DECOMPOSE-QSM reconstruction7. Here we explore this effect further, looking at quantitative differences in both white matter and deep gray matter regions, and more dipole inversion methods.
Methods
We compared various dipole inversion methods using an ROI-based analysis, with segmentations of the Thalamus, Caudate, Putamen, Globus Pallidus and Substantia Nigra from MRICloud8, and of the Corpus Callosum using Freesurfer9. These segmentations required an additional $$$T_1$$$ weighted acquisition. We compared the DECOMPOSE-QSM output values with the original input susceptibility values to check consistency. The inversion methods tested are FANSI10, ILSQR11, Iterative Tikhonov12, NDI13, MEDI14, MEDI+015, QSM-STAR16, and TKD17,18. All methods were tuned using an L-curve analysis and applied to two subjects scanned with protocol 1 described in Table 1.It was observed that DECOMPOSE-QSM fails to converge for the QSM input from some inversion methods. The resulting DECOMPOSE-QSM maps look like thresholded susceptibility maps and, in some cases, even contain voxels with flipped susceptibility (diamagnetic as opposed to paramagnetic or vice versa). Normalizing the susceptibility input (rescaling data between the 1st and 99th percentiles to [-0.07,0.07]) remedies this convergence issue, and was applied in all subsequent experiments.
We investigated the repeatability of DECOMPOSE-QSM by scanning two different subjects with an identical protocol (protocol 1 in Table 1). The overall QSM pipeline used followed recommendations of the recent QSM consensus paper6: ROMEO phase unwrapping19 followed by V-SHARP background field removal20 and reconstruction with NDI13 unless stated otherwise. Results were analysed using the same ROIs as above.
Results
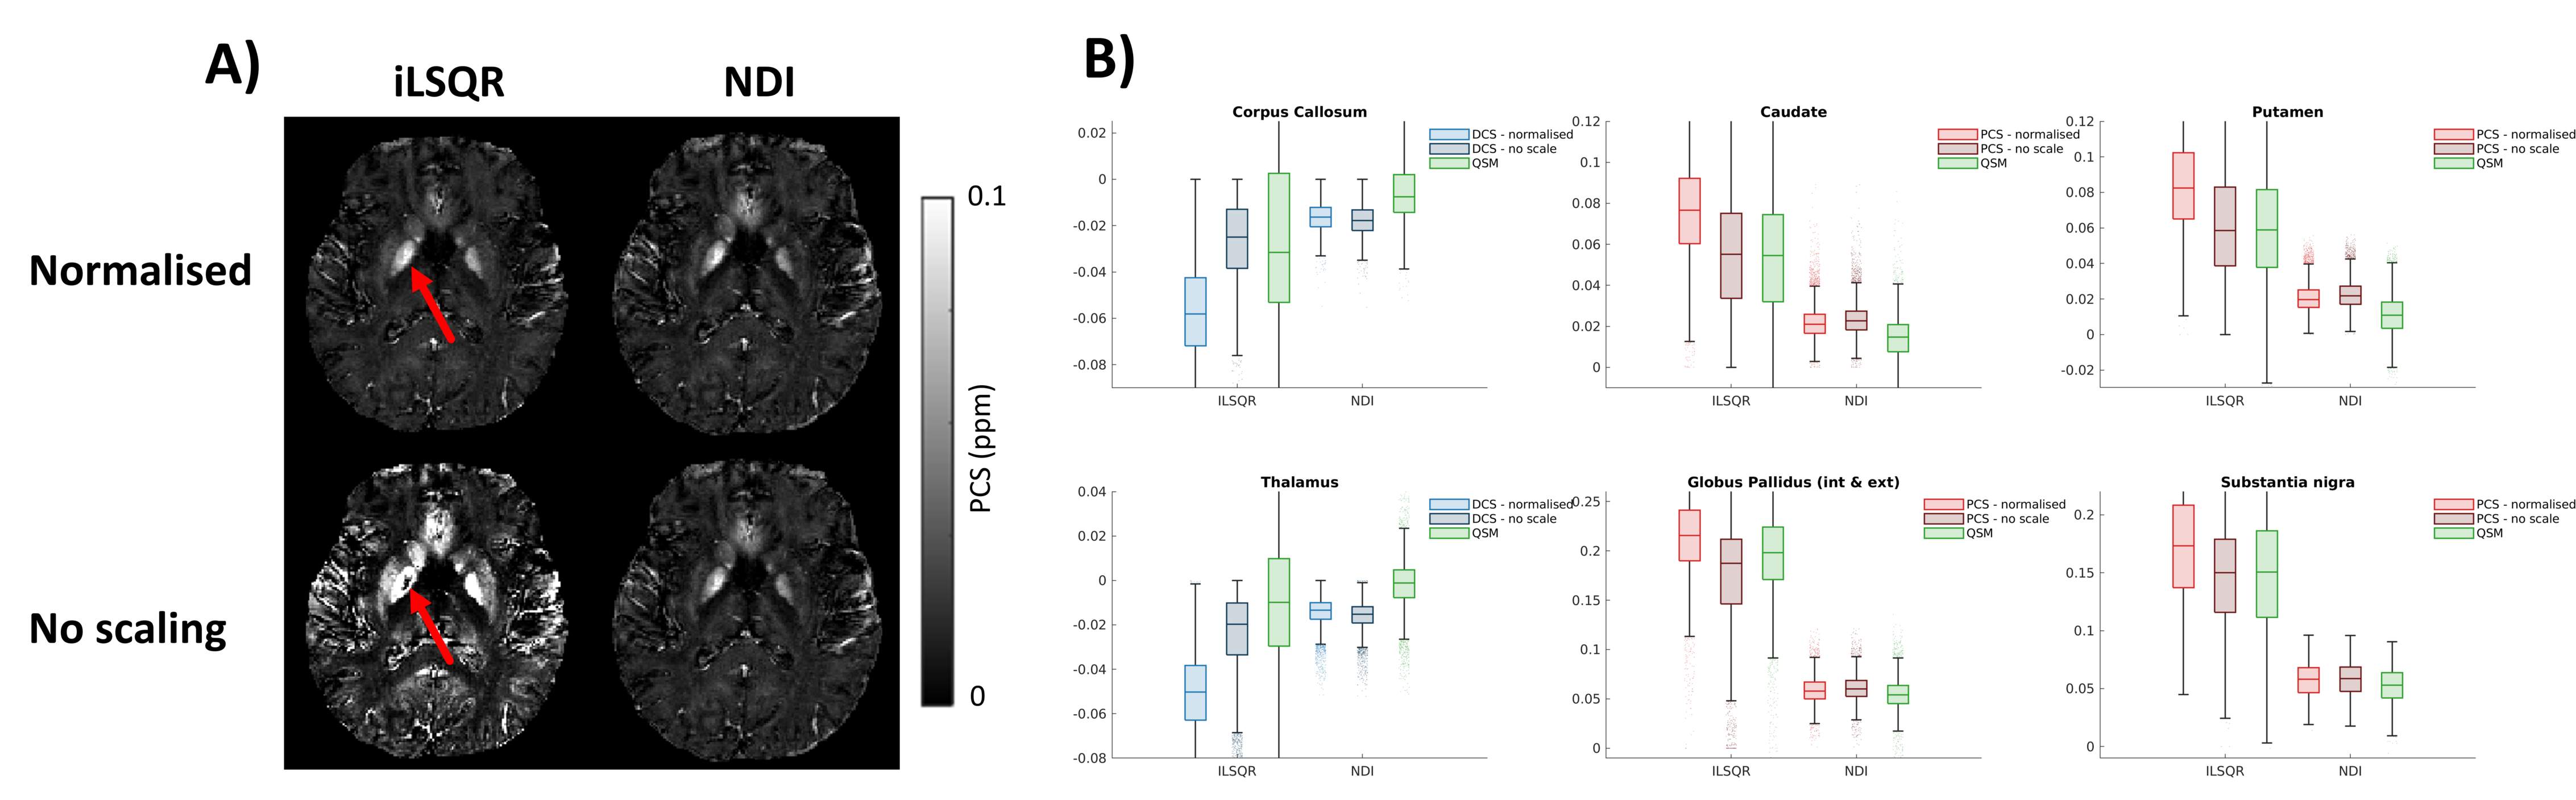
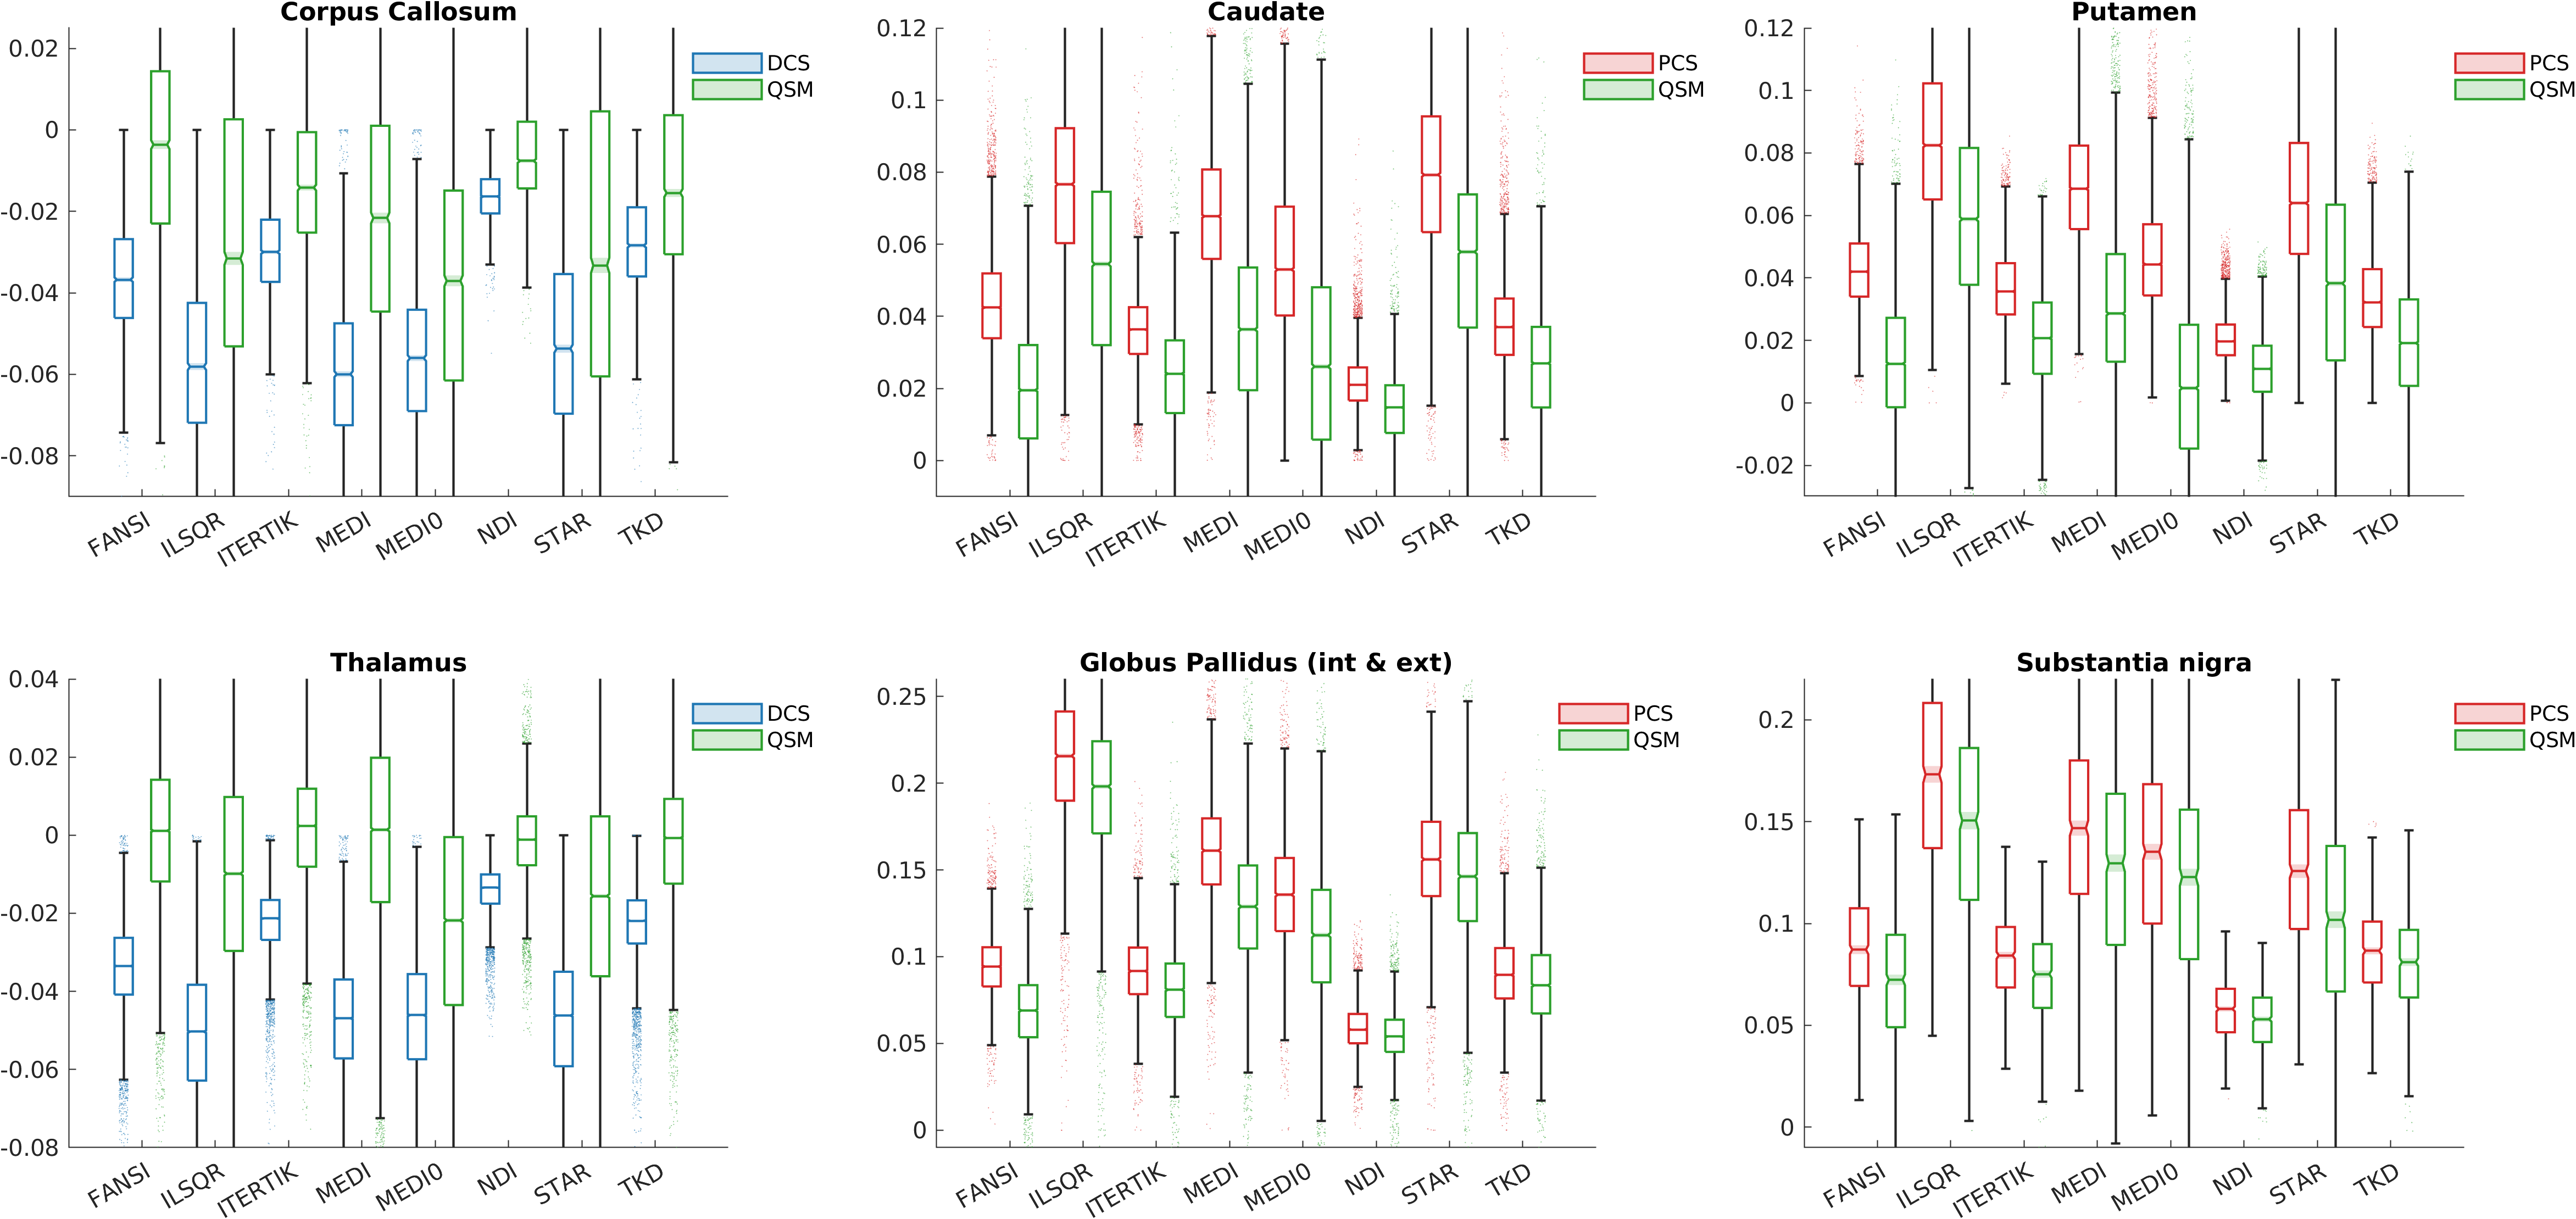
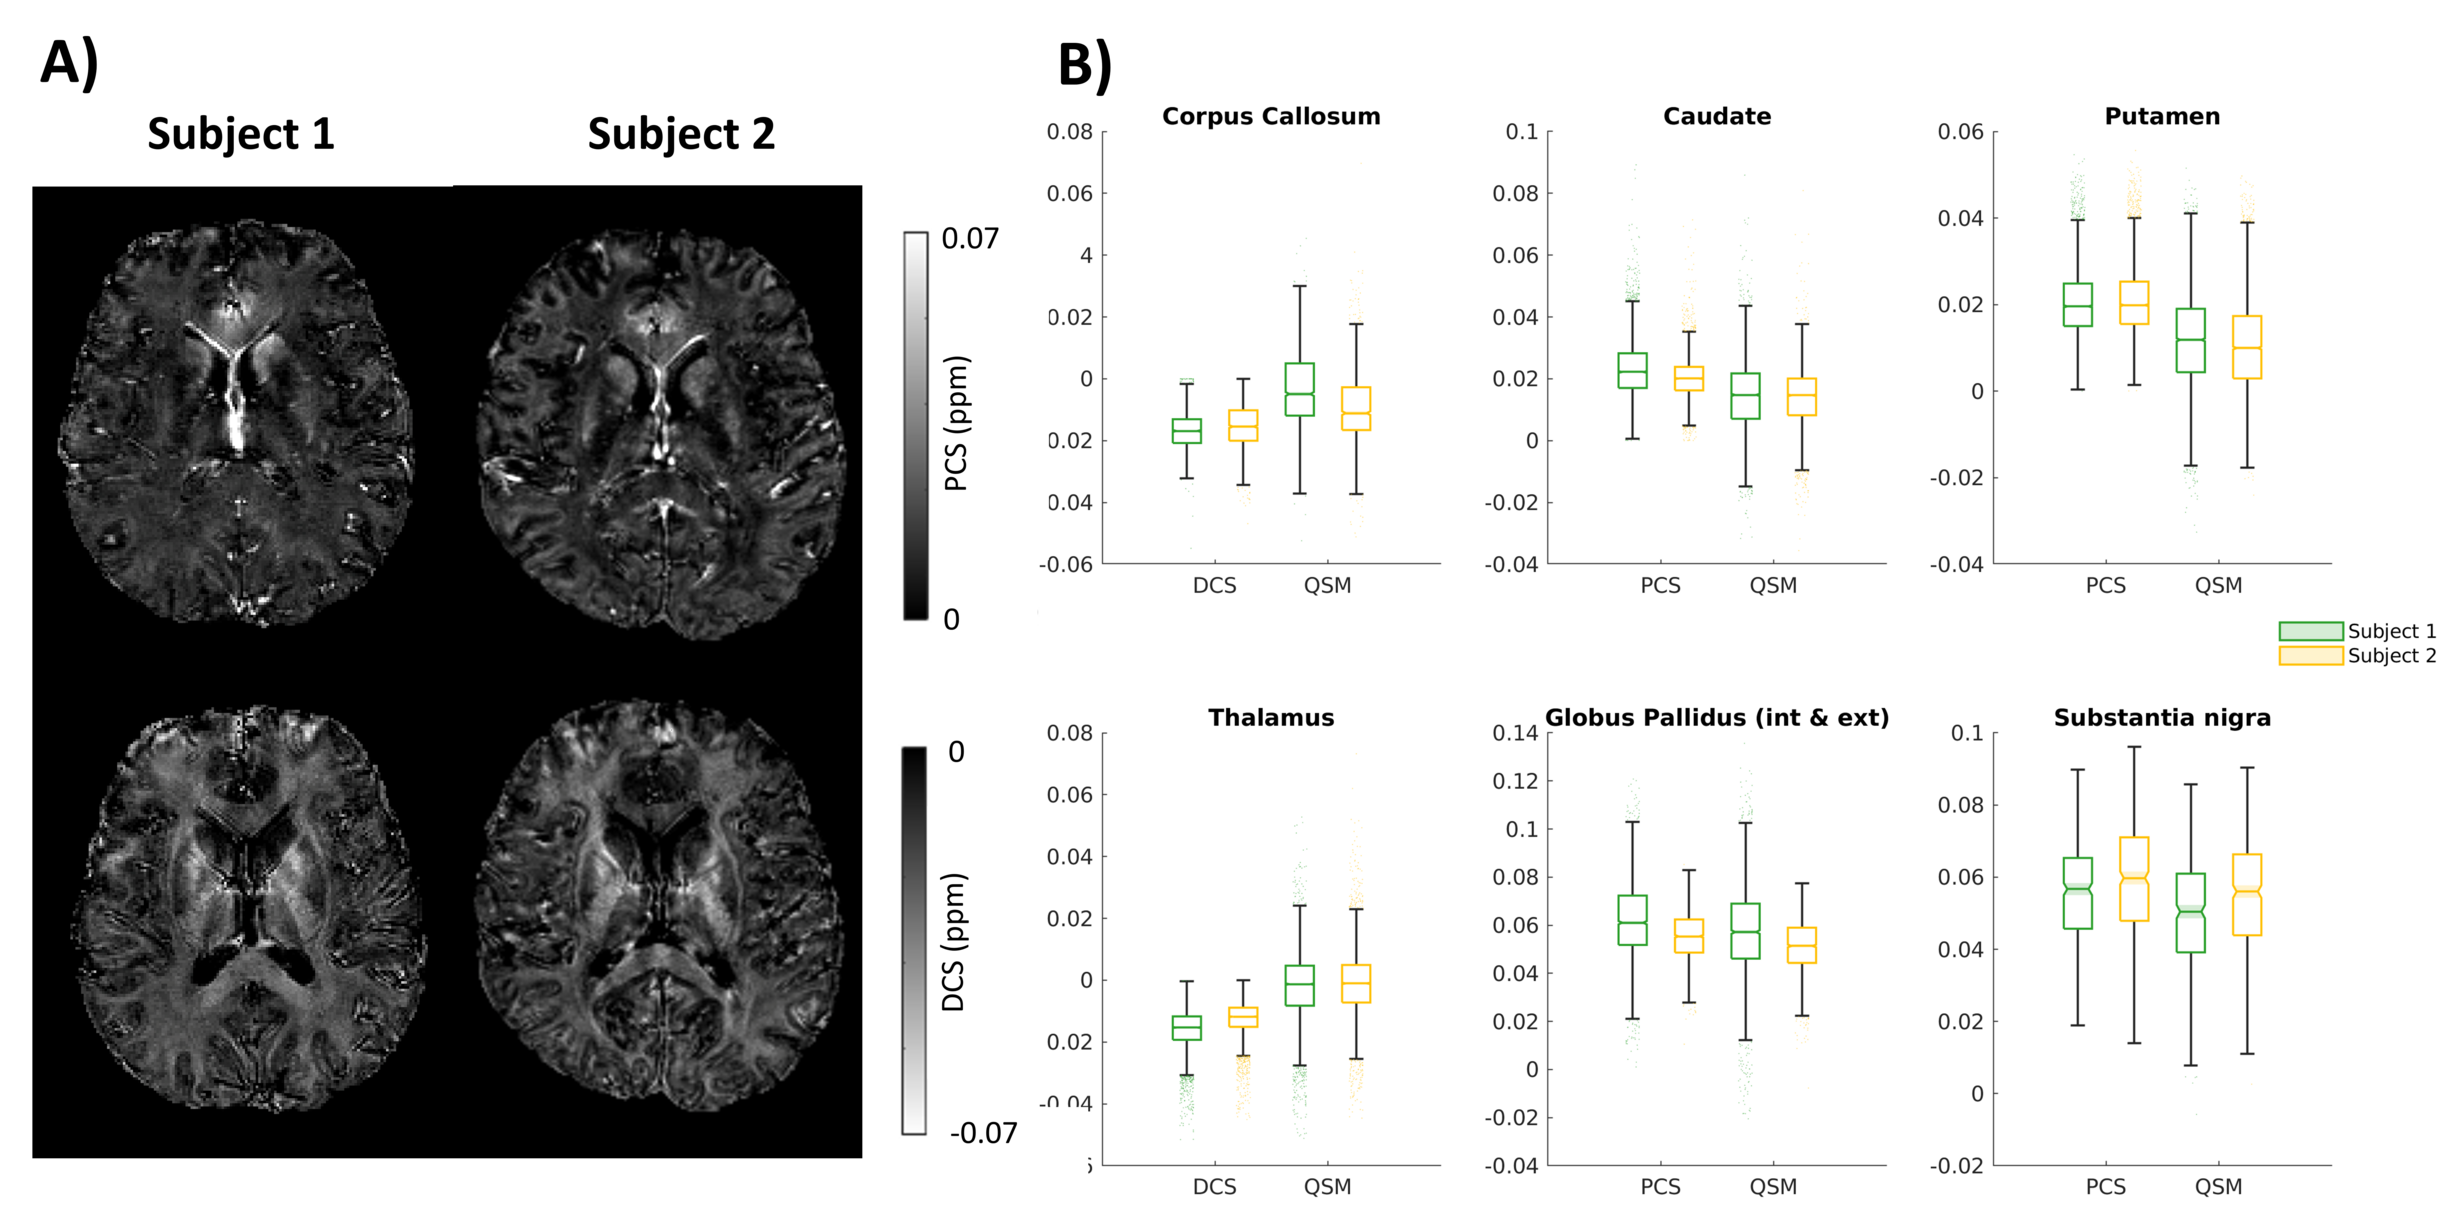
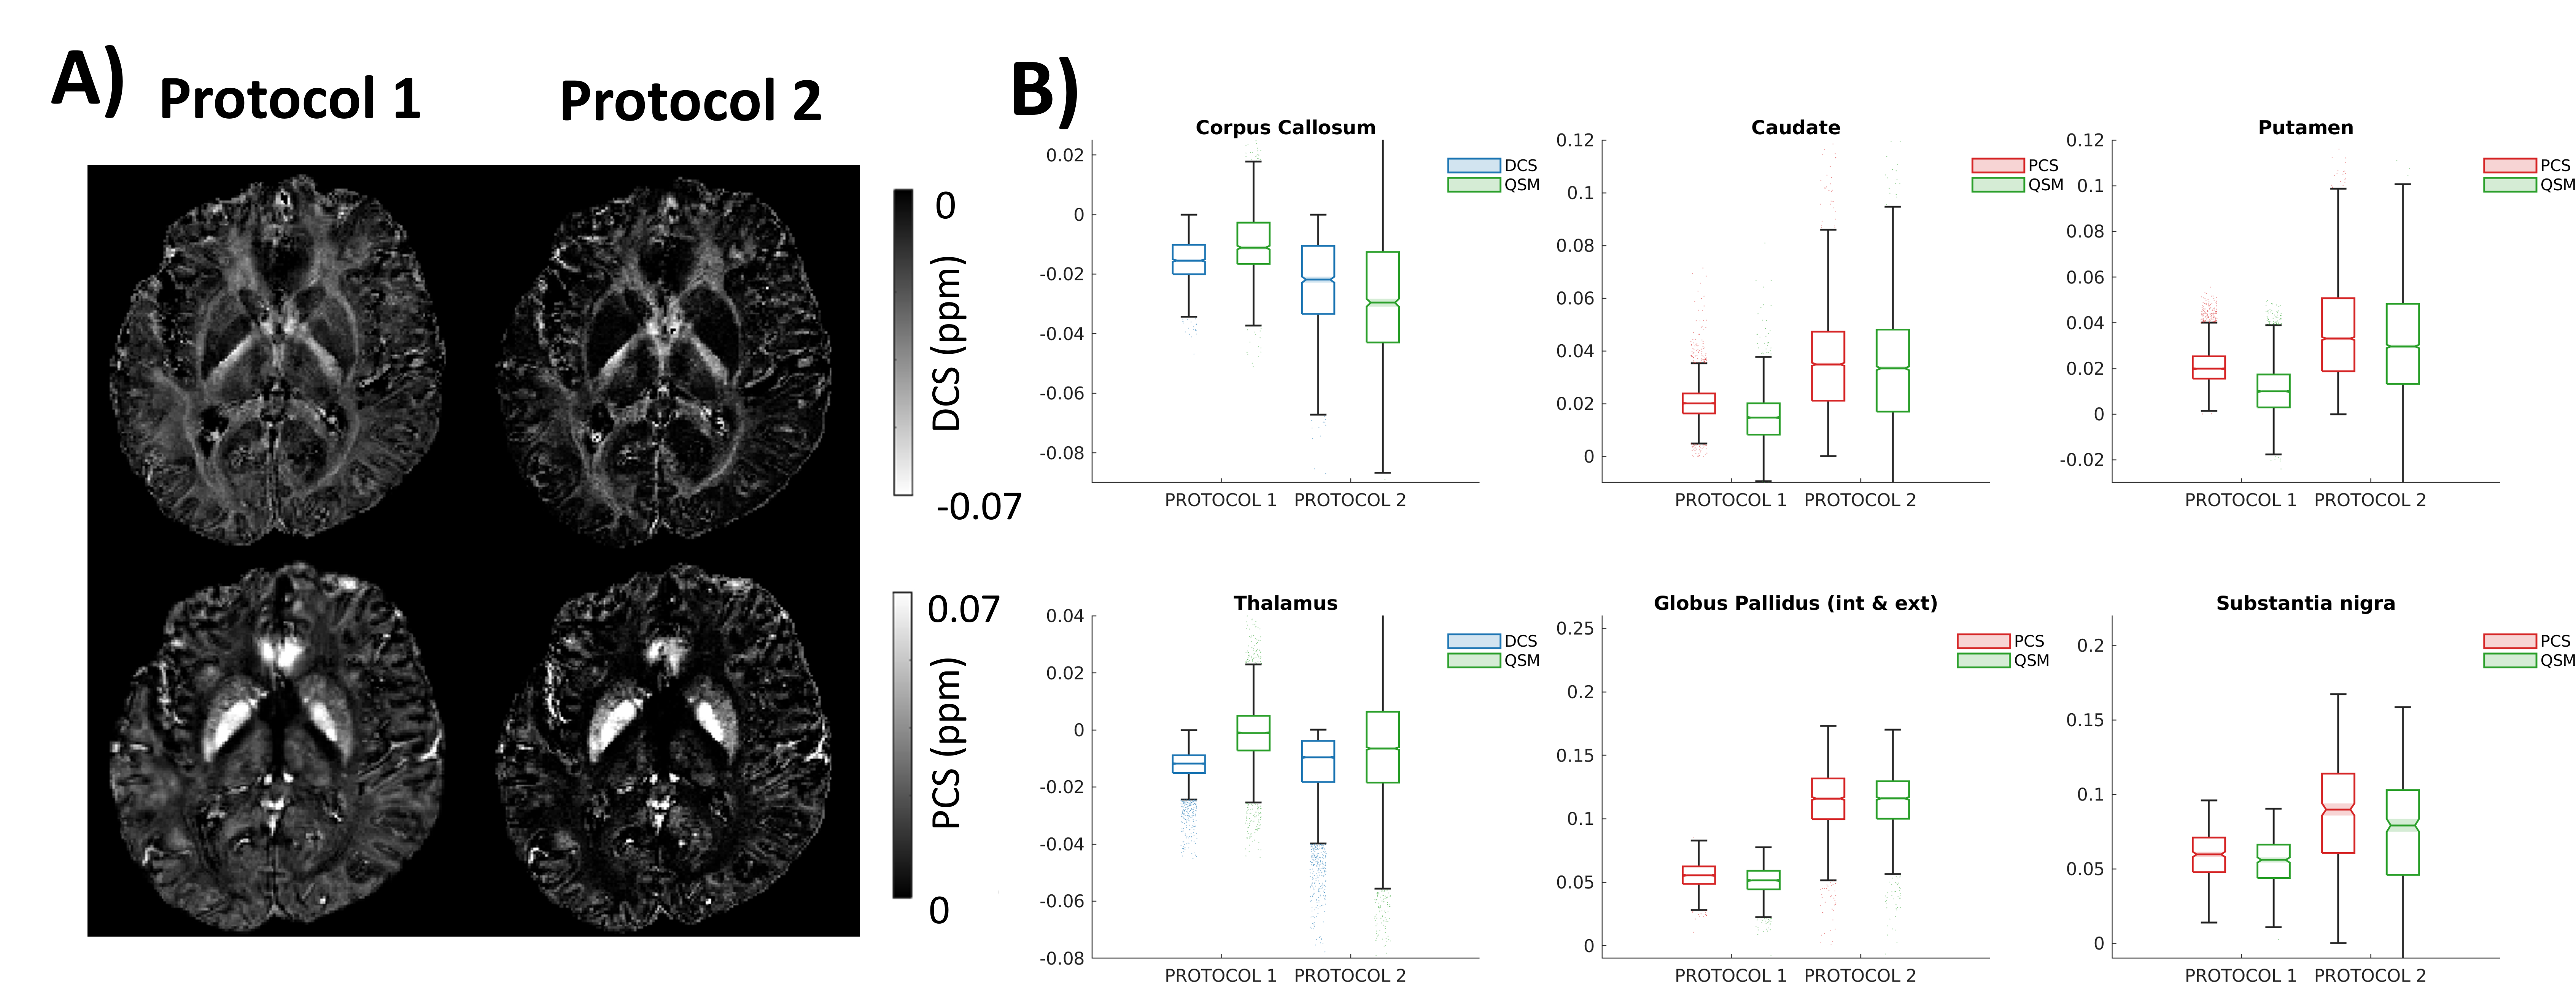
Different dipole inversion methods led to different DECOMPOSE-QSM results, illustrated in Figure 1. In this acquisition, without scaling, DECOMPOSE-QSM did not converge for input QSMs reconstructed with iLSQR (Figure 1A). Figure 1B shows DECOMPOSE-QSM results for normalized vs. unscaled inputs. No major differences are seen in the NDI reconstruction as this is already on the same scale as normalized maps. Despite different streaking artifact levels, similar, rich paramagnetic and diamagnetic susceptibility contrasts (Figure 1A) are revealed for normalized inputs with all methods, as can be seen in Figure 2. Figure 3 shows the repeatability of the DCS and PCS with different subjects using the same scanning protocol, and different protocols are compared in Figure 4.Discussion
DECOMPOSE-QSM is sensitive to the scaling of the input susceptibility map, which we can resolve by normalization (Figure 1). This did not remove the dependence of the separated maps on the input susceptibilities, as can be seen in Figure 2, where dipole inversion methods that usually have a higher contrast, such as iLSQR, also yield PCS and DCS with larger values.The robustness of DECOMPOSE-QSM is highlighted by its good agreement across subjects (Figure 3). Our results show that some acquisition parameters yield more precise separation: in Figure 4 a 16-echo acquisition with short echo spacing, and a 5-echo robust6 clinical acquisition are compared. The 16-echo sequence provides a better DECOMPOSE-QSM fit, as can be observed specifically in the Putamen and Thalamus where the protocol 1 DECOMPOSE maps (red) show significantly higher contrast relative to the input QSM (green) compared to protocol 2. Additionally, the 16-echo sequence has lower overall standard deviation in both QSM as well as DECOMPOSE maps.
Conclusion
We have illustrated practical considerations for DECOMPOSE-QSM. Specifically, scaling the input QSM with different dipole inversions reduces susceptibility misclassifications and contrast differences. We showed that acquisition parameters play a crucial role in the results of DECOMPOSE-QSM. Our observations suggest that more echoes and a finer echo spacing can be beneficial. The results presented here show that DECOMPOSE-QSM is repeatable across subjects and provide examples of applying DECOMPOSE-QSM to clinical datasets.Acknowledgements
PF and KS are supported by European Research Council Consolidator Grant DiSCo MRI SFN 770939.References
- Chen, J., Gong, N. J., Chaim, K. T., Otaduy, M. C. G., & Liu, C. (2021). Decompose quantitative susceptibility mapping (QSM) to sub-voxel diamagnetic and paramagnetic components based on gradient-echo MRI data. Neuroimage, 242, 118477.
- Li, Z., Feng, R., Liu, Q., Feng, J., Lao, G., Zhang, M., ... & Wei, H. (2023). APART-QSM: an improved sub-voxel quantitative susceptibility mapping for susceptibility source separation using an iterative data fitting method. NeuroImage, 274, 120148.
- Dimov, A. V., Nguyen, T. D., Gillen, K. M., Marcille, M., Spincemaille, P., Pitt, D., ... & Wang, Y. (2022). Susceptibility source separation from gradient echo data using magnitude decay modeling. Journal of Neuroimaging, 32(5), 852-859.
- Lee, S., Shin, H. G., Kim, M., & Lee, J. (2023). Depth-wise profiles of iron and myelin in the cortex and white matter using χ-separation: A preliminary study. NeuroImage, 273, 120058.
- Ahmed, M., Chen, J., Arani, A., Senjem, M. L., Cogswell, P. M., Jack Jr, C. R., & Liu, C. (2023). The diamagnetic component map from quantitative susceptibility mapping (QSM) source separation reveals pathological alteration in Alzheimer’s disease-driven neurodegeneration. NeuroImage, 280, 120357.
- Bilgic, B., Costagli, M., Chan, K. S., Duyn, J., Langkammer, C., Lee, J., ... & ISMRM Electro-Magnetic Tissue Properties Study Group. (2023). Recommended Implementation of Quantitative Susceptibility Mapping for Clinical Research in The Brain: A Consensus of the ISMRM Electro-Magnetic Tissue Properties Study Group. ArXiv.
- Patrick Fuchs, Jingjia Chen, Oliver C Kiersnowski, Russell Murdoch, Chunlei Liu, and Karin Shmueli. (2023). RECOMPOSE – Reproducing DECOMPOSE Using Susceptibility Maps Acquired For Clinical Research. Proceedings of the ISMRM annual meeting 2023. 4475
- Li, X., Chen, L., Kutten, K., Ceritoglu, C., Li, Y., Kang, N., ... & Faria, A. V. (2019). Multi-atlas tool for automated segmentation of brain gray matter nuclei and quantification of their magnetic susceptibility. Neuroimage, 191, 337-349.
- Fischl, B. (2012). FreeSurfer. Neuroimage, 62(2), 774-781.
- Milovic, C., Bilgic, B., Zhao, B., Acosta‐Cabronero, J., & Tejos, C. (2018). Fast nonlinear susceptibility inversion with variational regularization. Magnetic resonance in medicine, 80(2), 814-821.
- Li, W., Wang, N., Yu, F., Han, H., Cao, W., Romero, R., ... & Liu, C. (2015). A method for estimating and removing streaking artifacts in quantitative susceptibility mapping. Neuroimage, 108, 111-122.
- Karsa, A., Punwani, S., & Shmueli, K. (2020). An optimized and highly repeatable MRI acquisition and processing pipeline for quantitative susceptibility mapping in the head‐and‐neck region. Magnetic Resonance in Medicine, 84(6), 3206-3222.
- Polak, D., Chatnuntawech, I., Yoon, J., Iyer, S. S., Milovic, C., Lee, J., ... & Bilgic, B. (2020). Nonlinear dipole inversion (NDI) enables robust quantitative susceptibility mapping (QSM). NMR in Biomedicine, 33(12), e4271.
- Liu, T., Liu, J., De Rochefort, L., Spincemaille, P., Khalidov, I., Ledoux, J. R., & Wang, Y. (2011). Morphology enabled dipole inversion (MEDI) from a single‐angle acquisition: comparison with COSMOS in human brain imaging. Magnetic resonance in medicine, 66(3), 777-783.
- Liu, Z., Spincemaille, P., Yao, Y., Zhang, Y., & Wang, Y. (2018). MEDI+ 0: Morphology enabled dipole inversion with automatic uniform cerebrospinal fluid zero reference for quantitative susceptibility mapping. Magnetic resonance in medicine, 79(5), 2795-2803.
- Wei, H., Dibb, R., Zhou, Y., Sun, Y., Xu, J., Wang, N., & Liu, C. (2015). Streaking artifact reduction for quantitative susceptibility mapping of sources with large dynamic range. NMR in Biomedicine, 28(10), 1294-1303.
- Shmueli, K., de Zwart, J. A., van Gelderen, P., Li, T. Q., Dodd, S. J., & Duyn, J. H. (2009). Magnetic susceptibility mapping of brain tissue in vivo using MRI phase data. Magnetic Resonance in Medicine: An Official Journal of the International Society for Magnetic Resonance in Medicine, 62(6), 1510-1522.
- Schweser, F., Deistung, A., Sommer, K., & Reichenbach, J. R. (2013). Toward online reconstruction of quantitative susceptibility maps: superfast dipole inversion. Magnetic resonance in medicine, 69(6), 1581-1593.
- Dymerska, B., Eckstein, K., Bachrata, B., Siow, B., Trattnig, S., Shmueli, K., & Robinson, S. D. (2021). Phase unwrapping with a rapid opensource minimum spanning tree algorithm (ROMEO). Magnetic resonance in medicine, 85(4), 2294-2308.
- Schweser, F., Lehr, B. W., Andreas, D., & Rainer, R. J. (2010). Sophisticated harmonic artifact reduction for phase data (SHARP). Proceeding Proc GC Intl Soc Mag Reson Med.
- Modat, et al. (2014). Global image registration using a symmetric block-matching approach. Journal of Medical Imaging, 1(2), 024003–024003. doi:10.1117/1.JMI.1.2.024003
Figures