2451
Flexible Echo Time Selection for In-Phase-like Body QSM Acquisitions1Department of Diagnostic and Interventional Radiology, School of Medicine, Klinikum rechts der Isar, Technical University of Munich, Germany, Munich, Germany, 2Philips Research, Hamburg, Germany, Hamburg, Germany, 3Philips GmbH Market DACH, Hamburg, Germany, Hamburg, Germany
Synopsis
Keywords: Susceptibility/QSM, Susceptibility, Fat/Water Separation
Motivation: Gradient echo imaging using in-phase echoes has been proposed to simplify the fieldmap estimation in water–fat regions. The use of so-called effective multi-peak in-phase echo times allow for the bias-free QSM estimation in body regions in the presence of complex fat-models. Conventionally, the in-phase paradigm rigidly constrains the selection of echo times, often balancing acquisition speed, resolution, and SNR against one another.
Goal(s): .
Approach: .
Results: This study demonstrates the feasibility of a nearly unrestricted selection of the first echo time, without introducing significant quantification bias. This advance allows for a more flexible and efficient imaging process.
Impact: This work introduces a simple, flexible and bias-free body QSM acquisition strategy based on so-called pseudo in-phase echos that allows for considerably faster acquisitions while simultaneously increasing the SNR efficiancy
Introduction
Quantitative susceptibility mapping (QSM)1 has been applied in many tissues outside the brain, e.g. to distinguish osteolytic/osteoblastic bone changes in the spine2, to characterize lesions and calcifications in breast disease1,3, to measure bone density4,5 or liver iron overload6,7,8.Gradient echo imaging using effective multi-peak in-phase echoes has been proposed for$$$\,$$$the bias-free susceptibility estimation in body regions, accommodating physiologically accurate multi-peak fat-models9. However, the in-phase acquisition paradigm restricts the selection of$$$\,$$$echo times to a limited number. For body QSM at 3T, the potential echo times are estimated to be $$$[2.38,4.6,6.81,9.17,11.62,13.92]$$$ms. Such constraints may lead$$$\,$$$to compromises in resolution and a decrease in SNR efficiency, necessitating the selection of larger echo time increments or$$$\,$$$late first echo times10. In this$$$\,$$$work, we propose the$$$\,$$$use of pseudo in-phase echo times, which enable a$$$\,$$$nearly unrestricted selection of the$$$\,$$$first echo time, thereby allowing for a substantially more flexible in-phase acquisition strategy.Methods
Pseudo in-phase echo timesThe multi-peak signal model reads:$$\boldsymbol{s}(t_n)=\left(\rho_W+c_n\rho_F\right)e^{\gamma{t_n}},\quad\gamma=i2\pi{f_B}-R_2^*\\c_n=\sum_{p=1}^{P}a_pe^{i2\pi\Delta{f_p}t_n},\quad\text{with}\quad\sum_{p=1}^{P}a_p=1$$where $$$t_1,t_2,...,t_N\,$$$different echo times,$$$\,{f_B}\,$$$fieldmap,$$$\,{\rho_W}\,$$$and$$$\,{\rho_F}\,$$$complex signal of the water and fat components with an equal transverse relaxation rate$$$\,{R_2^*}$$$. The fat spectrum is assumed to have$$$\,P\,$$$ spectral peaks with corresponding relative amplitudes$$$\,{a_p}\,$$$ and chemical shift$$$\,\Delta{f_p}$$$. For$$$\,$$$the definition of the above effective multi-peak in-phase echo$$$\,$$$times, the time points where$$$\,\angle{c_{n}}=0\,$$$are selected representing the time points where the mean phase of all individual fat peak phasor is zero9. This leads to the simplification of$$$\,$$$the signal model to$$\boldsymbol{s}(t_n)=M_{0}e^{\gamma t_n},$$where$$$\,M_{0}=\rho_W+\rho_F\,$$$is the complex signal at$$$\,{t_{0}}$$$.
Instead of a zero phase condition, in this work we propose a methodology that allows for the selection of echo times at points where the phase of$$$\,$$$fat does not return to$$$\,$$$zero but either adds a constant term and is absorbed in$$$\,M_{0}\,$$$or fluctuates around a mean value--a 'pseudo in-phase' condition. The key insight is$$$\,$$$that while individual echo times may$$$\,$$$not yield a zero phase, the average added phase term across echoes remains constant, and by extension, allows for a non-biased estimation of the fieldmap parameter$$$\,{f_{B}}$$$.
Monte Carlo Simulation
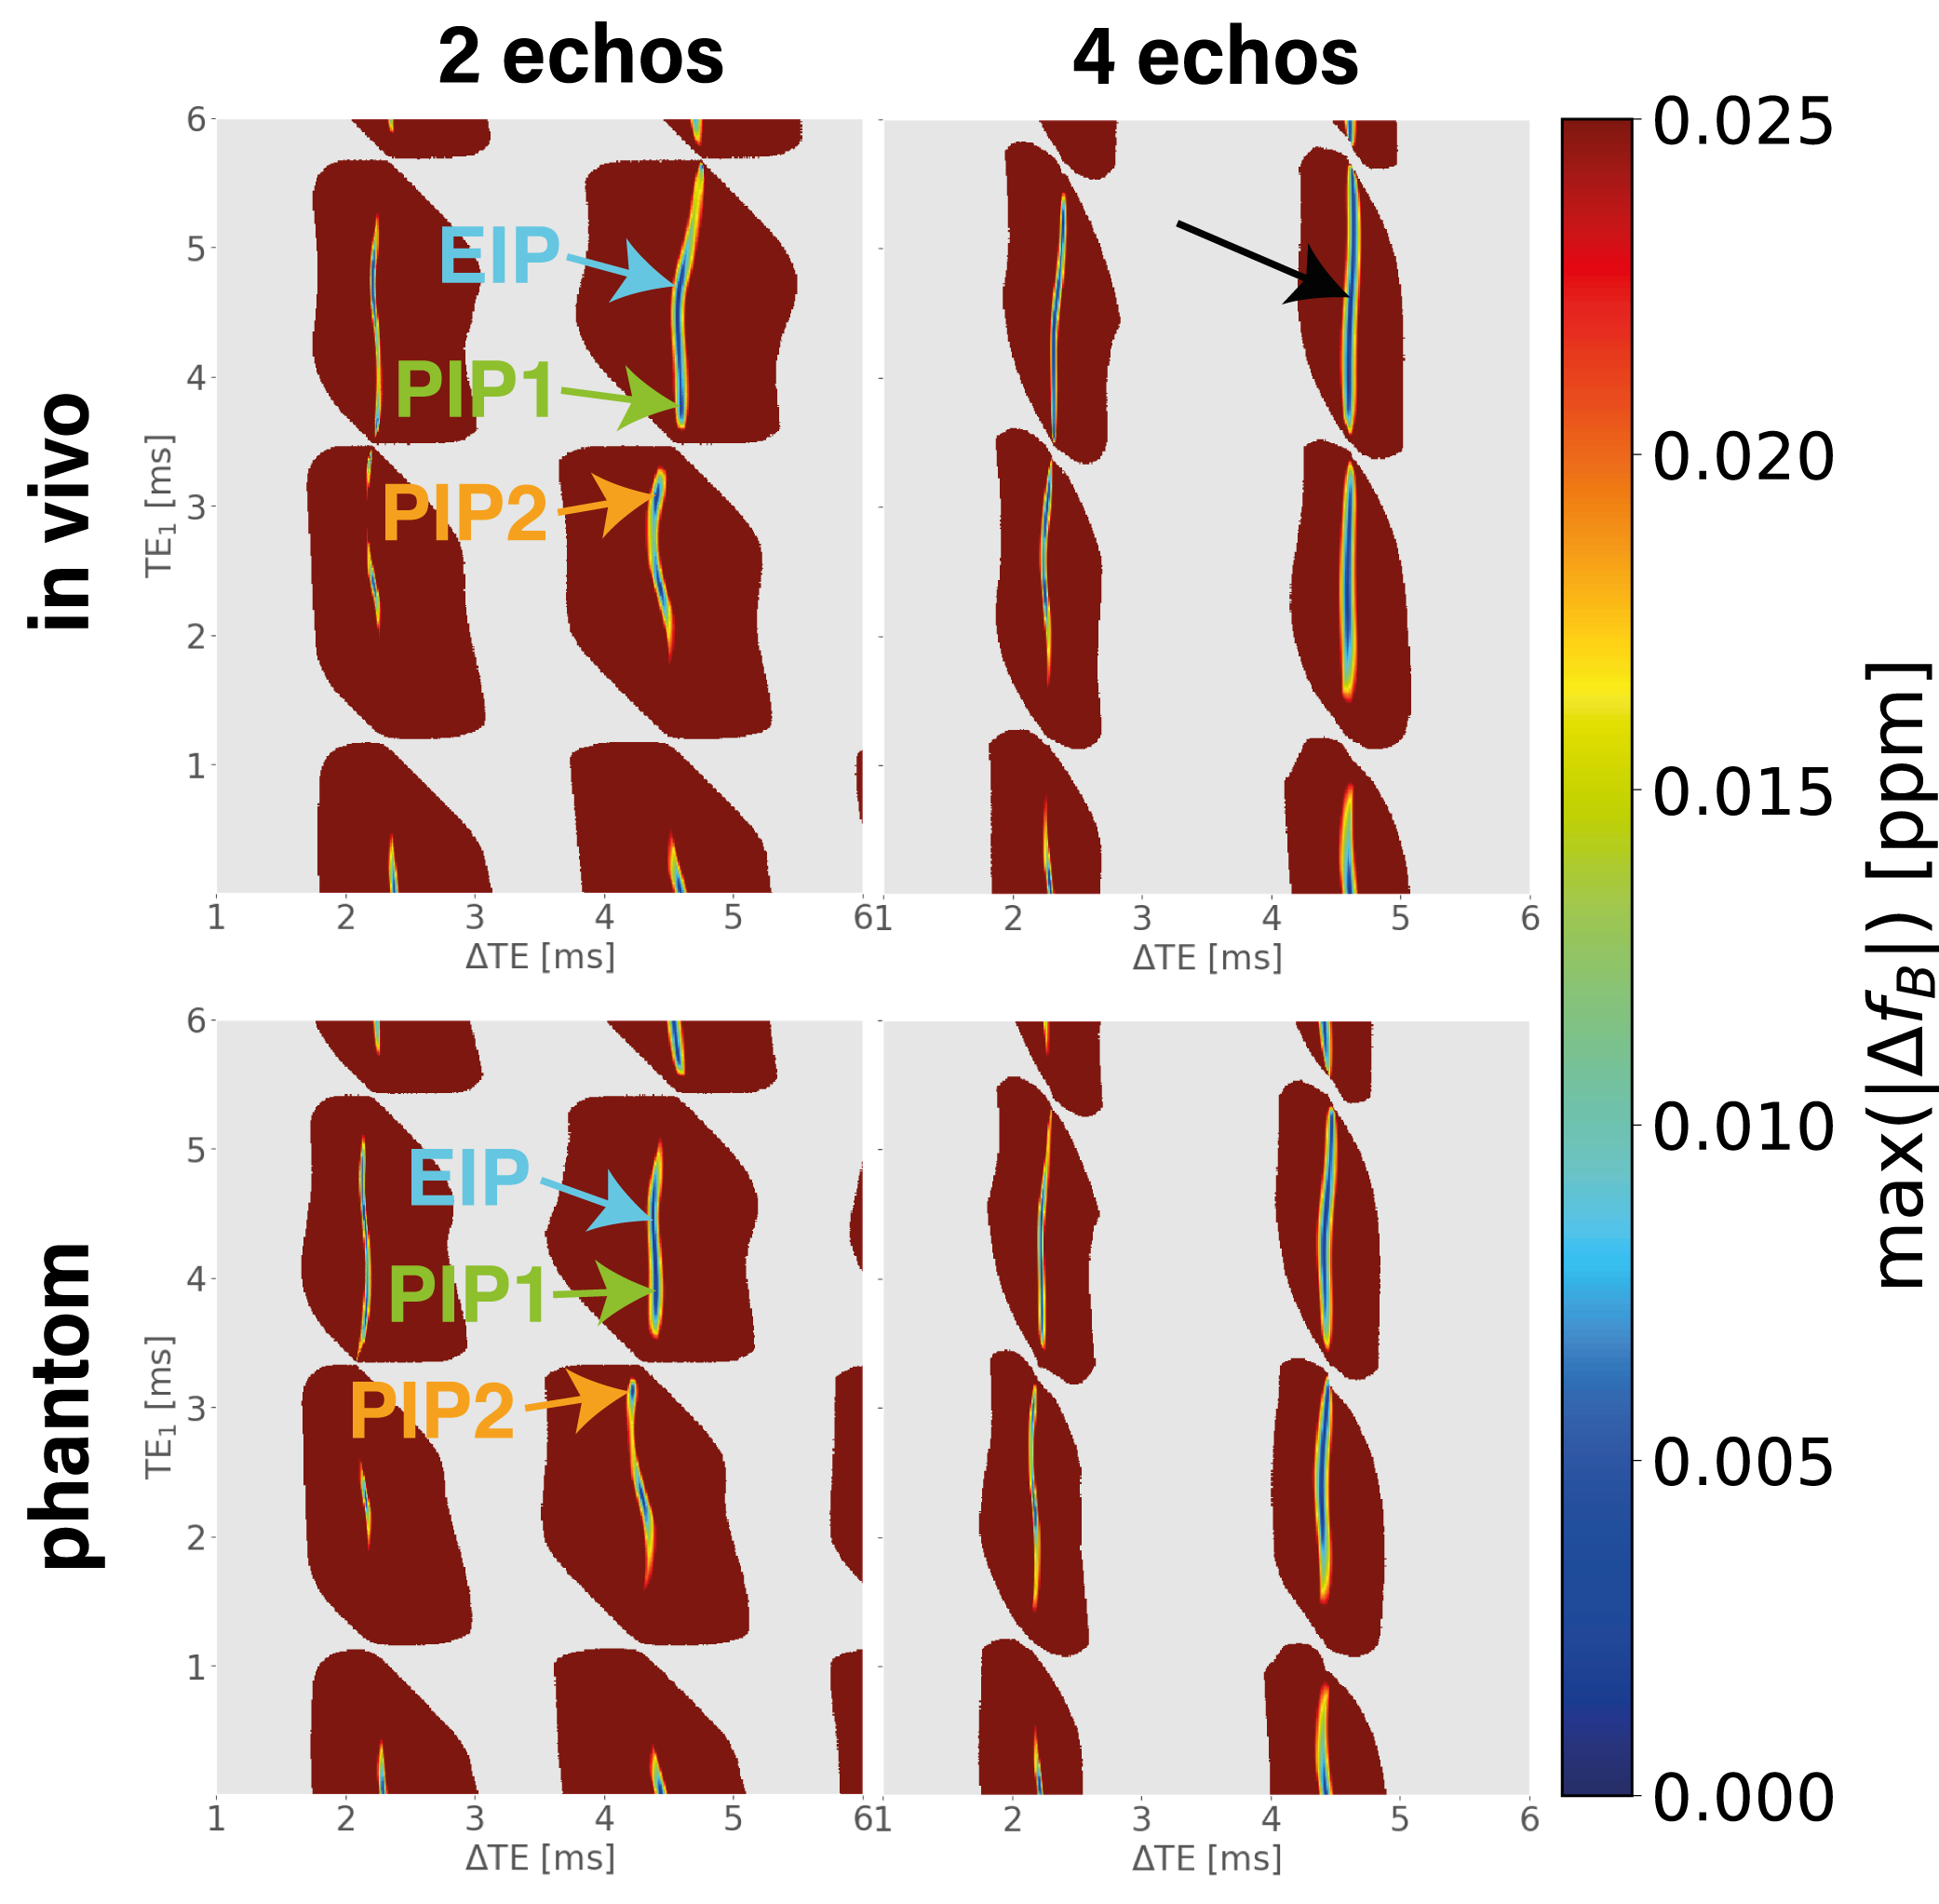
To estimate the pseudo in-phase echo times, a Monte Carlo simulation was performed for TE1 intervals ranging from 0$$$\,$$$to$$$\,$$$6ms and ∆TE intervals from 1$$$\,$$$to$$$\,$$$6ms, similar to the simulation performed in Ref.(9). The simulation was performed for 2$$$\,$$$or$$$\,$$$4 echo acquisitions. For in-vivo echo times a fat-model specific to bone marrow has$$$\,$$$been used11 and a temperature-corrected peanut oil model12 for the phantom.
Phantom measurement
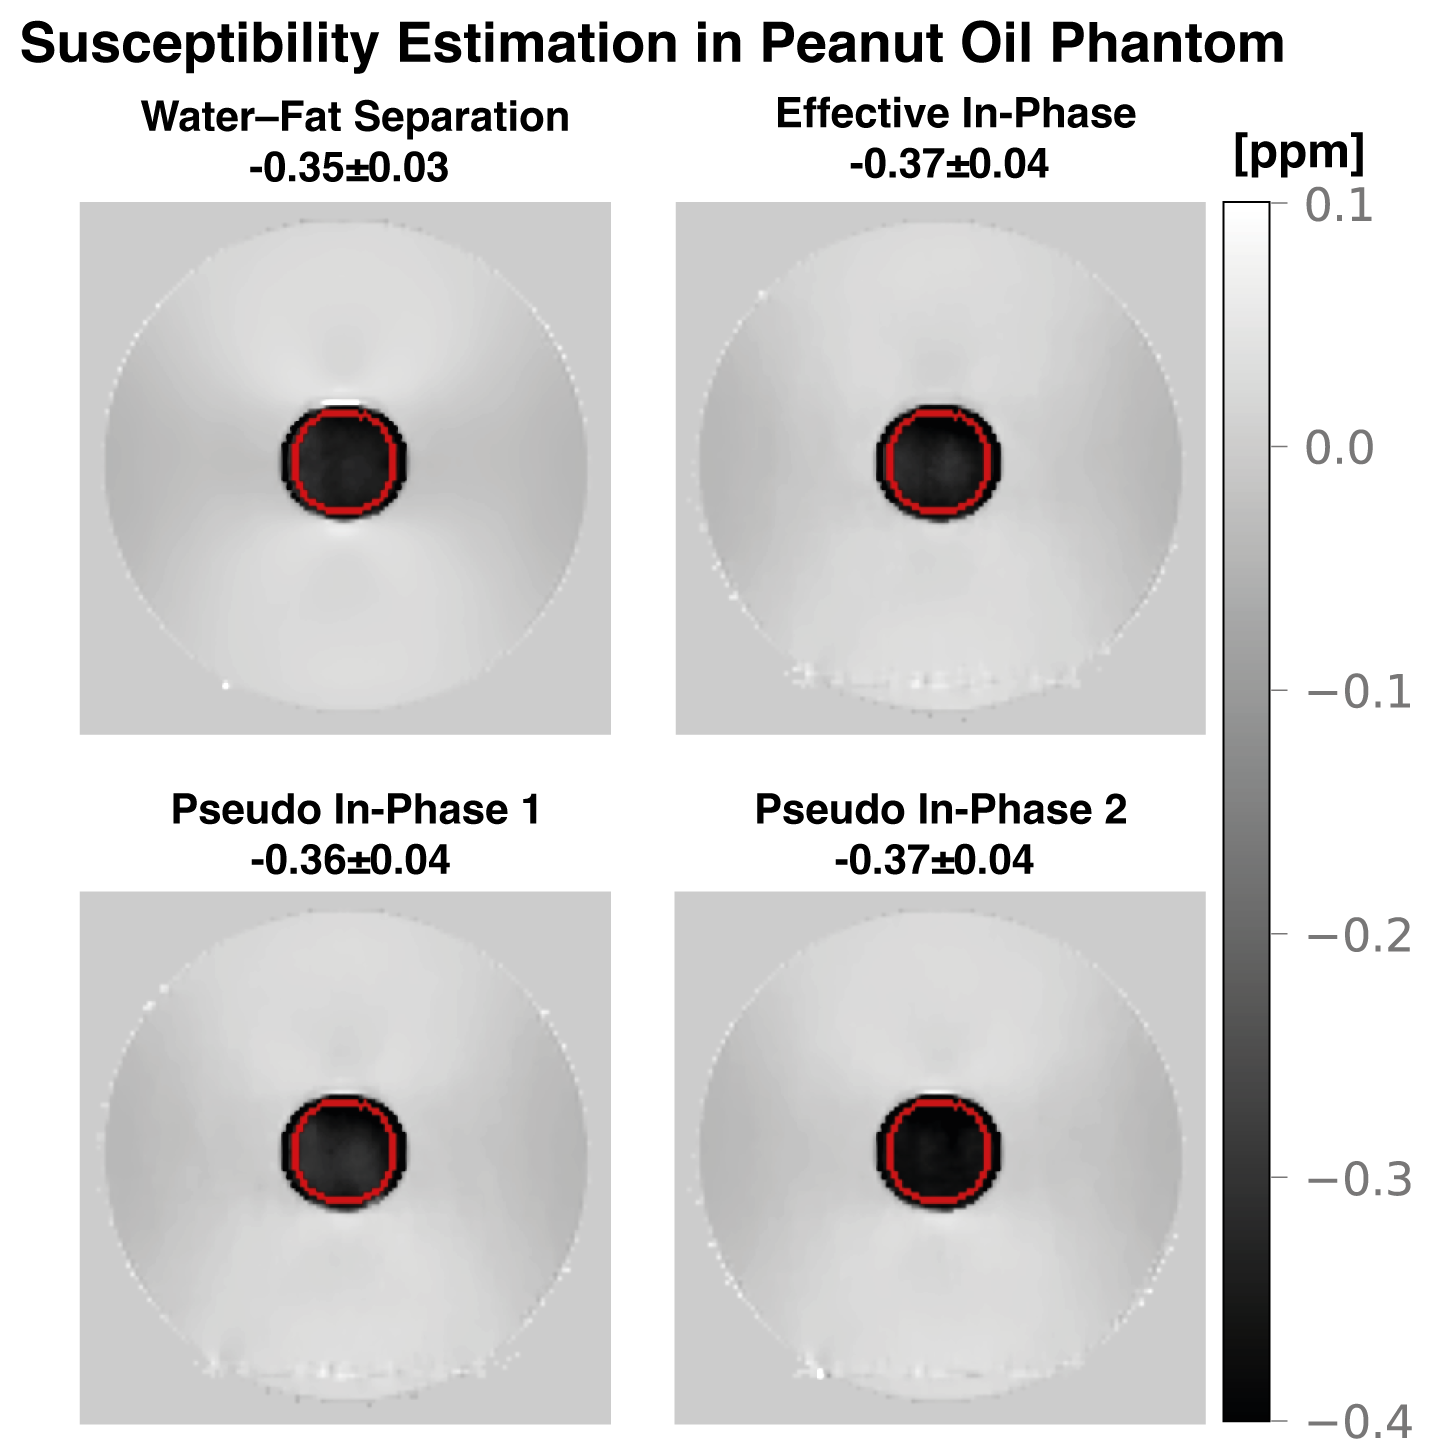
Validation of the pseudo in-phase echo times was performed using a peanut oil vial encased in a cylindrical container filled with water. Reference measurements were obtained from a 10-echo multi-echo gradient-echo sequence, with conventional water-fat separation and field-mapping performed using the above temperature-corrected fat-model and a graph-cut algorithm13 followed by$$$\,$$$a nonlinear total field inversion algorithm14. This processing was applied to all data in this study. The reference scan was then compared to a 2-echo acquisition with effective multi-peak in-phase echo times TE$$$_{\mathrm{EIP}}=[4.44,8.82]$$$ and two sets of pseudo in-phase echo times, TE$$$_{\mathrm{PIP1}}=[4.08,8.48]$$$ and TE$$$_{\mathrm{PIP2}}=[3.13,7.35]$$$ as estimated from the Monte Carlo simulation. Scanning was performed on a 3$$$\:$$$T scanner (Ingenia, Philips Healthcare, Best, The Netherlands).
In-vivo measurements
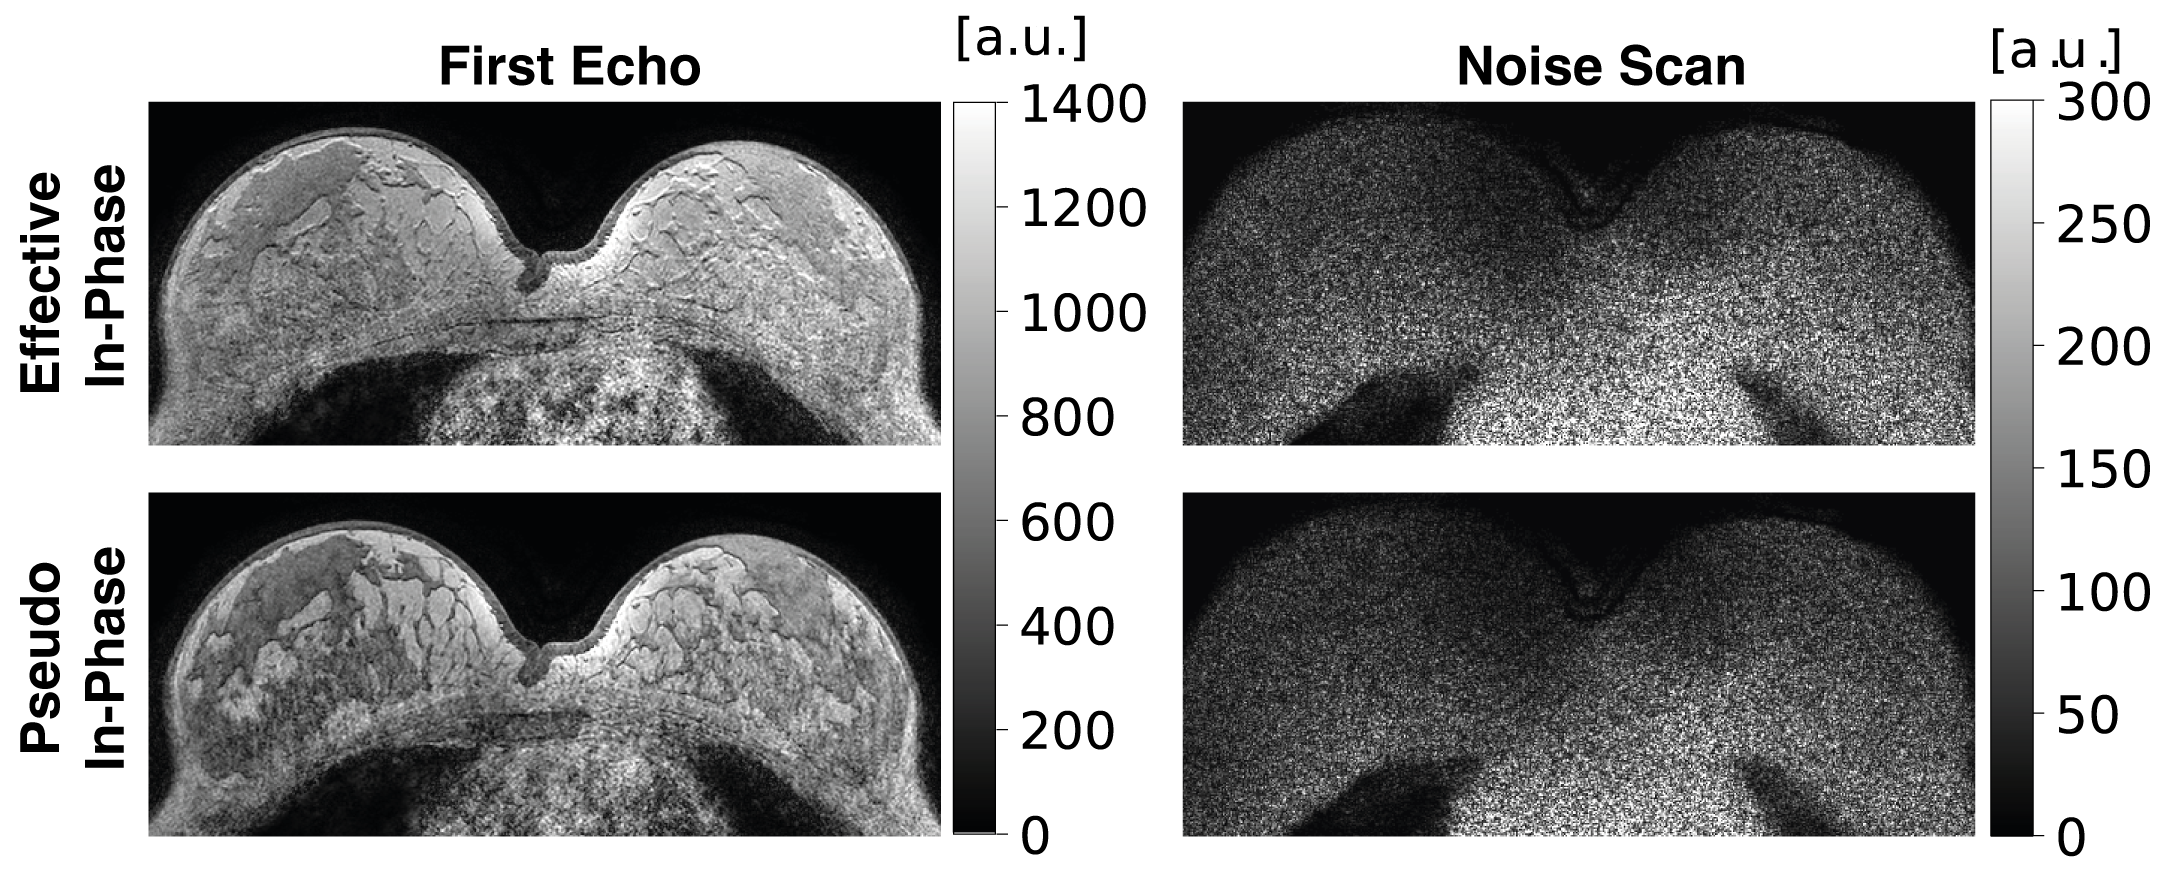
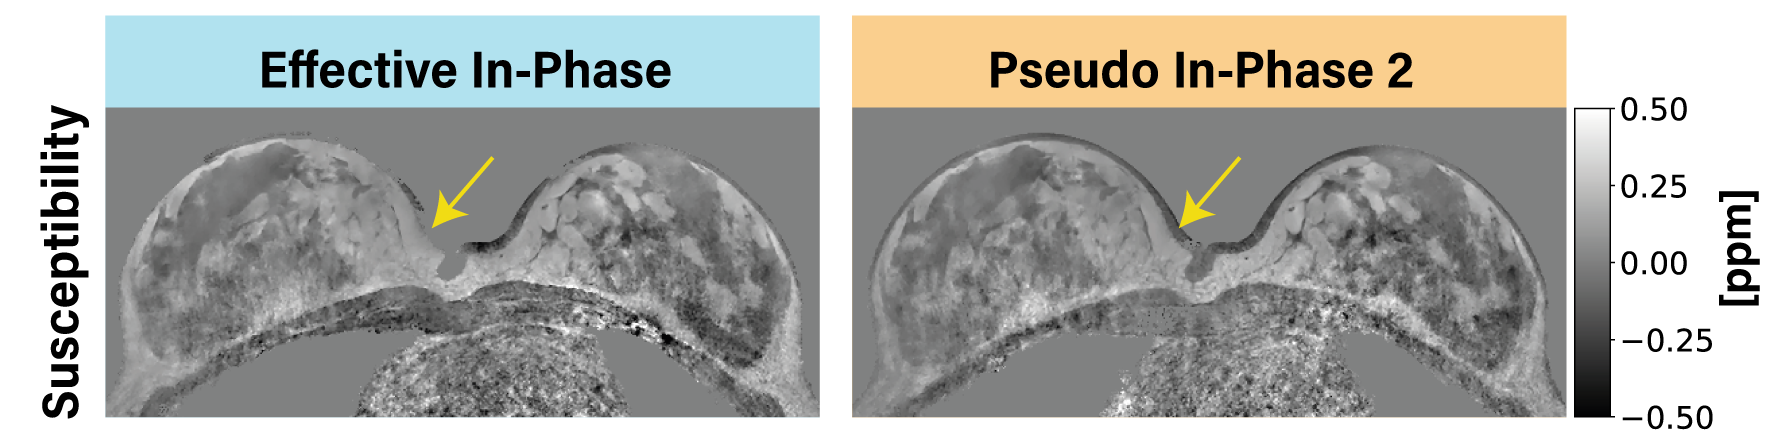
For the in-vivo validation a scan of$$$\,$$$the breast in a volunteer was performed.The effective multi-peak in-phase acquisition for breast microcalfications detection similar to10 with echo times TE$$$_{\mathrm{EIP}}=[4.6,9.17]$$$ was compared to a pseudo in-phase acquisition TE$$$_{\mathrm{PIP2}}=[3.08,7.49]$$$ as estimated by the Monte Carlo simulation. Additionally, both scans where once scanned without RF pulses to$$$\,$$$get an estimate of relative SNR increase offered by$$$\,$$$the pseudo in-phase paradigm compared to the effective in-phase approach. Furthermore, a numerical simulation based on the in-vivo scans was performed with the two echo time sets to$$$\,$$$get a theoretical estimate of the SNR improvement.
Results
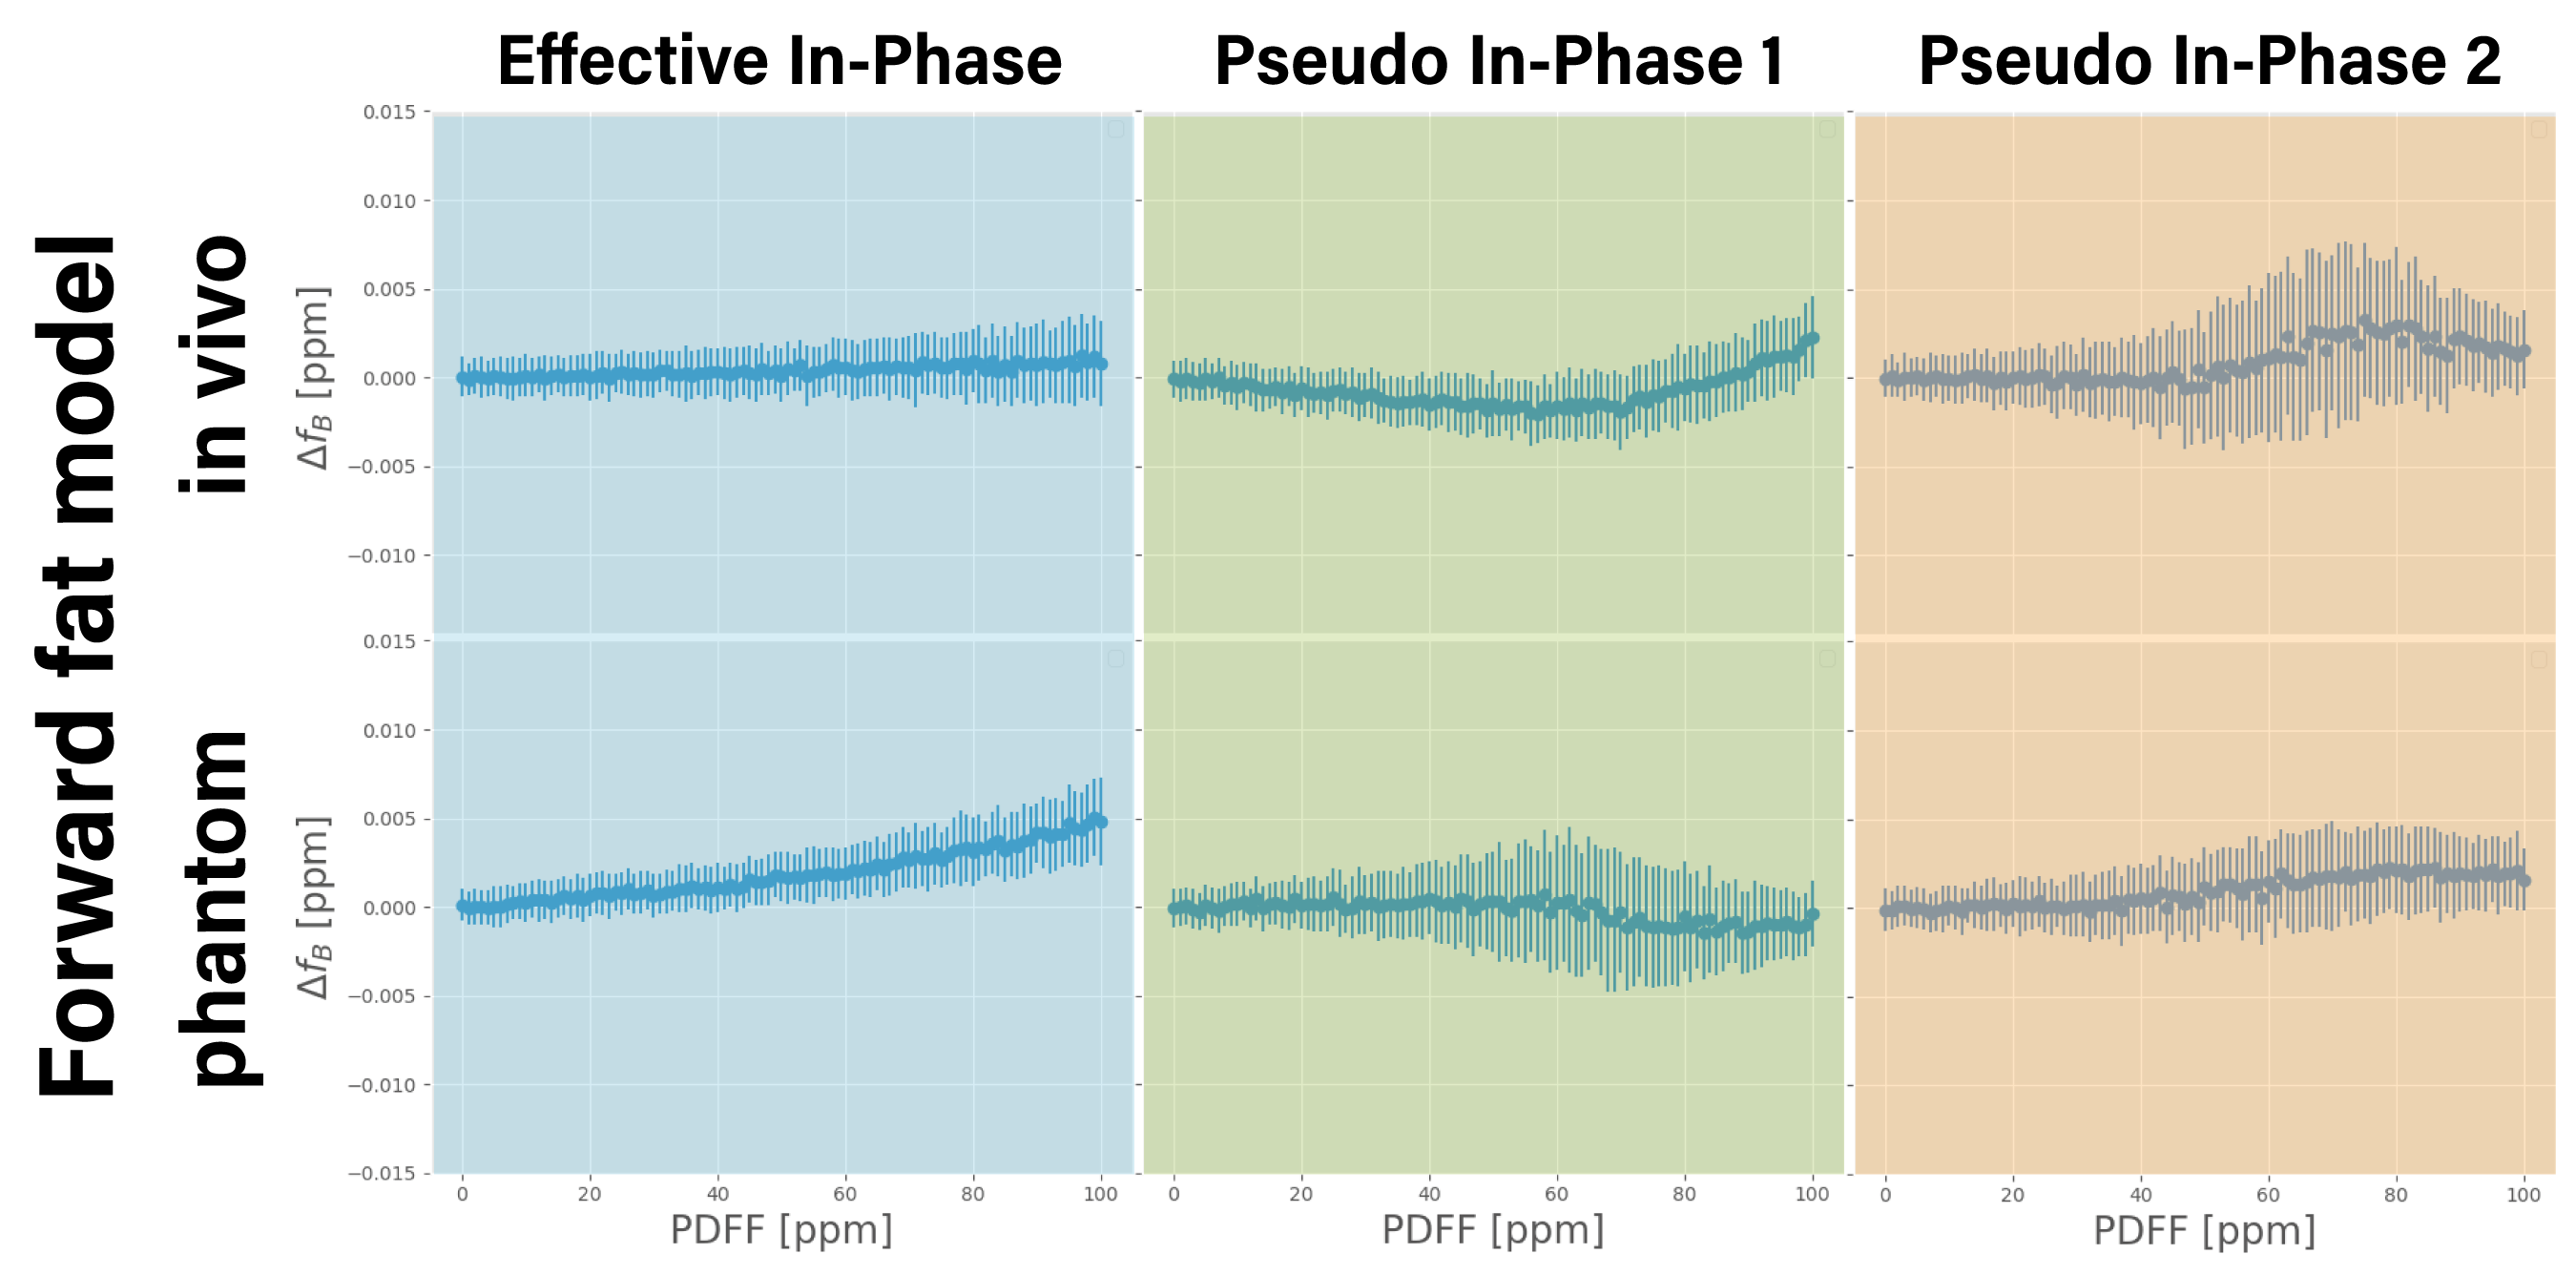
Fig.1 reveals the presence of$$$\,$$$many echo$$$\,$$$time combinations that allow for$$$\,$$$the bias free fieldmap estimation in water–fat regions. As the number of echoes increases,a$$$\,$$$broader range of TE1 becomes viable. Fig.2 shows$$$\,$$$the underlying Monte Carlo simulation of$$$\,$$$each point, depicting the fieldmap quantification bias$$$\,$$$as a function of fat fraction. The correlation is markedly non-monotonic for$$$\,$$$the pseudo in-phase echo times, which appears to efficiently constrain fieldmap quantification bias. Fig.3 shows that QSM results in the phantom measurement are consistent across$$$\,$$$all estimation methods. Fig.4 reveals the SNR boost in$$$\,$$$the pseudo in-phase protocol, which is quantified at 6.75%, aligning with$$$\,$$$the simulation-predicted enhancement of 6.44%. Fig.5 shows that in-vivo QSM results are comparable for effective and pseudo in-phase echoes.Conclusion
Pseudo in-phase echo times can be used for$$$\,$$$the bias-free quantification of susceptibility in body regions simultaneously circumventing the restrictive echo time constraints of conventional in-phase acquisition paradigms, providing more flexibility in$$$\,$$$echo time selection and potentially improving the trade-off between acquisition parameters allowing for 6% SNR boost and 22% faster acquisition for$$$\,$$$the breast acquisition example.Acknowledgements
The authors acknowledge research support from Philips Healthcare.References
[1] Wang Y, Liu T. Quantitative Susceptibility Mapping (QSM): Decod-ing MRI Data for a Tissue Magnetic Biomarker. Magnetic Resonance inMedicine 2014; 73:82–101. 10.1002/mrm.25358.
[2] Boehm C, Sollmann N, Meineke J, Ruschke S, Dieckmeyer M, Weiss K,Zimmer C, Makowski MR, Baum T, Karampinos DC. PreconditionedWater–fat Total Field Inversion: Application To Spine Quantitative Sus-ceptibility Mapping. Magnetic Resonance in Medicine 2021; 87:417–430.10.1002/mrm.28903.
[3] Schweser F, Hermann KH, Deistung A, Atterbury M, Baltzer PA, Burmeis-ter HP, Kaiser WA, Reichenbach JR. Quantitative Magnetic SusceptibilityMapping (QSM) in Breast Disease Reveals Additional Information for MR-Based Characterization of Carcinoma Calcification. In: Proceedings 19.Annual Meeting International Society for Magnetic Resonance in Medicine,Montreal, 2011. p. 1014.
[4] Dimov AV, Liu Z, Spincemaille P, Prince MR, Du J, Wang Y. Bone Quanti-tative Susceptibility Mapping Using a Chemical Species-Specific R2* SignalModel With Ultrashort and Conventional Echo Data. Magnetic Resonancein Medicine 2017; 79:121–128. 10.1002/mrm.26648.
[5] Diefenbach MN, Meineke J, Ruschke S, Baum T, Gersing A,Karampinos DC. On the Sensitivity of Quantitative Susceptibility Mappingfor Measuring Trabecular Bone Density. Magnetic Resonance in Medicine2018; . 10.1002/mrm.27531.
[6] Sharma SD, Hernando D, Horng DE, Reeder SB. Quantitative Sus-ceptibility Mapping in the Abdomen As an Imaging Biomarker of Hep-atic Iron Overload. Magnetic Resonance in Medicine 2014; 74:673–683.10.1002/mrm.25448.
[7] Lin H, Wei H, He N, Fu C, Cheng S, Shen J, Wang B, Yan X, Liu C,Yan F. Quantitative Susceptibility Mapping in Combination With Water–Fat Separation for Simultaneous Liver Iron and Fat Fraction Quantification.European Radiology 2018; 28:3494–3504. 10.1007/s00330-017-5263-4.
[8] Jafari R, Sheth S, Spincemaille P, Nguyen TD, Prince MR, Wen Y, Guo Y,Deh K, Liu Z, Margolis D, Brittenham GM, Kierans AS, Wang Y. RapidAutomated Liver Quantitative Susceptibility Mapping. Journal of MagneticResonance Imaging 2019; 50:725–732. 10.1002/jmri.26632.
[9] Boehm C, Schlaeger S, Meineke J, Weiss K, Makowski MR,Karampinos DC. On the Water-Fat In-phase Assumption for QuantitativeSusceptibility Mapping. Magnetic Resonance in Medicine 2022; 89:1068–1082. 10.1002/mrm.29516 ss295.
[10] Boehm C, Komenda A, Weiss K, Stelter JK, Borde T, Meineke J,Makowski MR, Fallenberg EM, Karampinos DC. High spatial resolutionquantitative susceptibility mapping using in-phase echoes enables the de-piction of breast microcalcifications. In: Proceedings 31. Annual Meet-ing International Society for Magnetic Resonance in Medicine, Toronto,Canada, 2023. p. 0189.
[11] Ren J, Dimitrov I, Sherry AD, Malloy CR. Composition of Adipose Tis-sue and Marrow Fat in Humans By1h Nmr At 7 Tesla. Journal of LipidResearch 2008; 49:2055–2062. 10.1194/jlr.d800010-jlr200.
[12] Bydder M, Girard O, Hamilton G. Mapping the double bonds in triglyc-erides. Magn Reson Imaging 2011; 29:1041–1046.
[13] Stelter JK, Boehm C, Ruschke S, Weiss K, Diefenbach MN, Wu M, Borde T,Schmidt GP, Makowski MR, Fallenberg EM, Karampinos DC. Hierar-chical Multi-Resolution Graph-Cuts for Water-Fat-Silicone Separation inBreast Mri. IEEE Transactions on Medical Imaging 2022; 41:3253–3265.10.1109/tmi.2022.3180302.
[14] Nguyen TD, Wen Y, Du J, Liu Z, Gillen K, Spincemaille P, Gupta A,Yang Q, Wang Y. Quantitative Susceptibility Mapping of Carotid PlaquesUsing Nonlinear Total Field Inversion: Initial Experience in PatientsWith Significant Carotid Stenosis. Magnetic Resonance in Medicine 2020;84:1501–1509. 10.1002/mrm.28227.
[15] Karsa A, Punwani S, Shmueli K. An Optimized and Highly Repeatable MriAcquisition and Processing Pipeline for Quantitative Susceptibility Map-ping in the Head-and-neck Region. Magnetic Resonance in Medicine 2020;84:3206–3222. 10.1002/mrm.28377.
Figures