2450
Acceleration of Diffusion-Relaxation Multidimensional MRI acquisition exploiting Locally low-rank with Block Adaptive Regularization1National Institute on Aging, Baltimore, MD, United States
Synopsis
Keywords: Microstructure, Microstructure, Multidimensional MRI, Diffusion and Relaxation
Motivation: Multidimensional (MD)-MRI provides valuable sub-voxel information. However, it suffers from prohibitively long acquisition time making it impractical for routine clinical use.
Goal(s): To reduce MD-MRI scan time via partial k-space sampling in conjunction with a novel reconstruction framework.
Approach: Achieve data reduction by using random incoherent sampling, followed by locally low-rank reconstruction with block adaptive regularization, and comparison with ground-truth.
Results: In-vivo performance of MD-MRI image reconstruction method that achieves R=4 reduction factor was demonstrated. This framework provides whole-brain coverage with 2mm$$$^3$$$ voxels in 20 minutes, while maintaining robustness and accuracy. This innovation has significant potential for clinical neurological applications.
Impact: Multidimensional MRI is crucial for investigating tissue microstructure, brain connectivity, and pathology in clinical study. Here we present a novel image reconstruction framework that allows R=4 k-space data reduction factor, providing whole-brain coverage with 2mm$$$^3$$$ voxels MD-MRI data in 20minutes.
Introduction
Diffusion MRI1 is commonly employed in neurological diagnosis for probing intravoxel biological information. Multidimensional MRI (MD-MRI) extends these capabilities by simultaneously capturing diffusion and relaxation data, which can be analyzed using a model-free approach to obtain distributions of valuable quantitative metrics2-4. This information is crucial for investigating tissue microstructure5, brain connectivity6, and pathology7,8 When free gradient waveforms are used in diffusion acquisition, it allows for the exploration of frequency-dependent and tensor-related characteristics within the encoding spectrum9,10.However, MD-MRI requires lengthy scan times due to diverse acquisition parameters. Although a 40-minute protocol with whole-brain coverage and 2mm$$$^3$$$ voxels has been developed, it remains impractical for routine clinical use. To address this, our study introduces an innovative MD-MRI reconstruction framework that significantly shortens scan times (as low as 20 minutes) while preserving image quality. This novel approach combines incoherent random sampling with advanced optimization techniques.Our study marks a significant step in making MD-MRI more practical for real clinical applications. We tested this method with five adult participants, affirming its effectiveness.Material and Method
$$$\textbf{Data Acquisition}$$$: Five healthy participants were each scanned on a 3T MRI scanner using 2D multi-slice single-shot EPI. The acquisition parameters were set as follows:FOV=228×228×110, 2mm$$$^3$$$ voxels, in-plane acceleration factor 2 using GRAPPA reconstruction. Numerically optimized linear11, planar, and spherical b-tensors were employed with b-values ranging between 0.1 and 3ms/$$$\mu$$$m$$$^2$$$, in the range of 6.6-21Hz centroid frequencies ($$$\omega/2\pi$$$), and with different combinations of repetition times, TR=(0.62,1.75,3.5,5,7,7.6)s and echo times, TE=(40,63,83,150)ms, comprising a total of 139 volumes and 40 minutes acquisition time12. In our retrospective study, data initially reconstructed using conventional GRAPPA is Fourier transformed to generate fully-sampled data (referred to as the Reference). This Reference data is then retrospectively under-sampled using random incoherent masks, maintaining the same spatial resolution. The reduced data sets are reconstructed using our proposed method and compared to two other methods: global low rank(LR), which uses a single image as a patch for each acquisition index, and conventional SENSE.$$$\textbf{Locally Low Rank with Block adaptive regularization}$$$: The proposed method uses locally low-rank priors with block adaptive regularization to reduce noise and preserve contrast. It involves defining blocks, organizing them by b-value, and interpolating missing signals through a constrained optimization problem. This approach leverages the shared structural and coil information in each block of MD-MRI data. The mathematical formulation is expressed as:
$$arg\min_{\mathbf{X_{B}}}=\frac{1}{2}||\mathbf{Y_B}-\mathbf{E_B}\mathbf{X_B}||^2_2+\lambda_\mathbf{B}\sum^{}_{q\in\Omega}||\mathbf{P_q(X_B)}||_{*}$$ where $$$\mathbf{Y_B}$$$ is the group of acquired k-space signals, $$$\mathbf{B}$$$ denotes the group of training blocks, $$$\mathbf{E_B}$$$ is the encoding operator, $$$\mathbf{X_B}$$$ is target artifact free MD-MRI images, $$$\lambda_\mathbf{B}$$$ is Block-adaptive regularization parameter that depends on the block, $$$\mathbf{P}$$$ is an operator that extracts and reshapes one local spatial patch at pixel-index,$$$q$$$, as a vector in $$$\mathbf{B}$$$. $$$\Omega$$$ is the set of all non-overlapping covering patches.
$$$\textbf{Estimation of diffusion and relaxation parameters}$$$: Data were processed using the Monte Carlo inversion algorithm10,13. Briefly, the $$$\mathbf{b}(\omega)-\text{TE}-\text{TR}$$$ encoded signal $$$S$$$ is modeled as a sum of contributions; the $$$i$$$-th component is characterized by its signal weight, $$$f_i$$$, tensor-valued diffusion spectra $$$\mathbf{D}_{i}(\omega)$$$, and longitudinal and transverse relaxation rates $$$R_{1,i}$$$ and $$$R_{2,i}$$$ according to 10.
$$S[\mathbf{b}(\omega),\text{TE},\text{TR}]=\sum_{i}{f_{i}\exp{\left(-\int_{-\infty}^{\infty}{\mathbf{b}(\omega):\mathbf{D}_{i}(\omega)\, \text{d}\omega}\right)}} \left[1-\exp{(-\text{TR}R_{1,i})}\right]\exp{(-\text{TE}R_{2,i})}$$ where the colon denotes a generalized scalar product.
Result
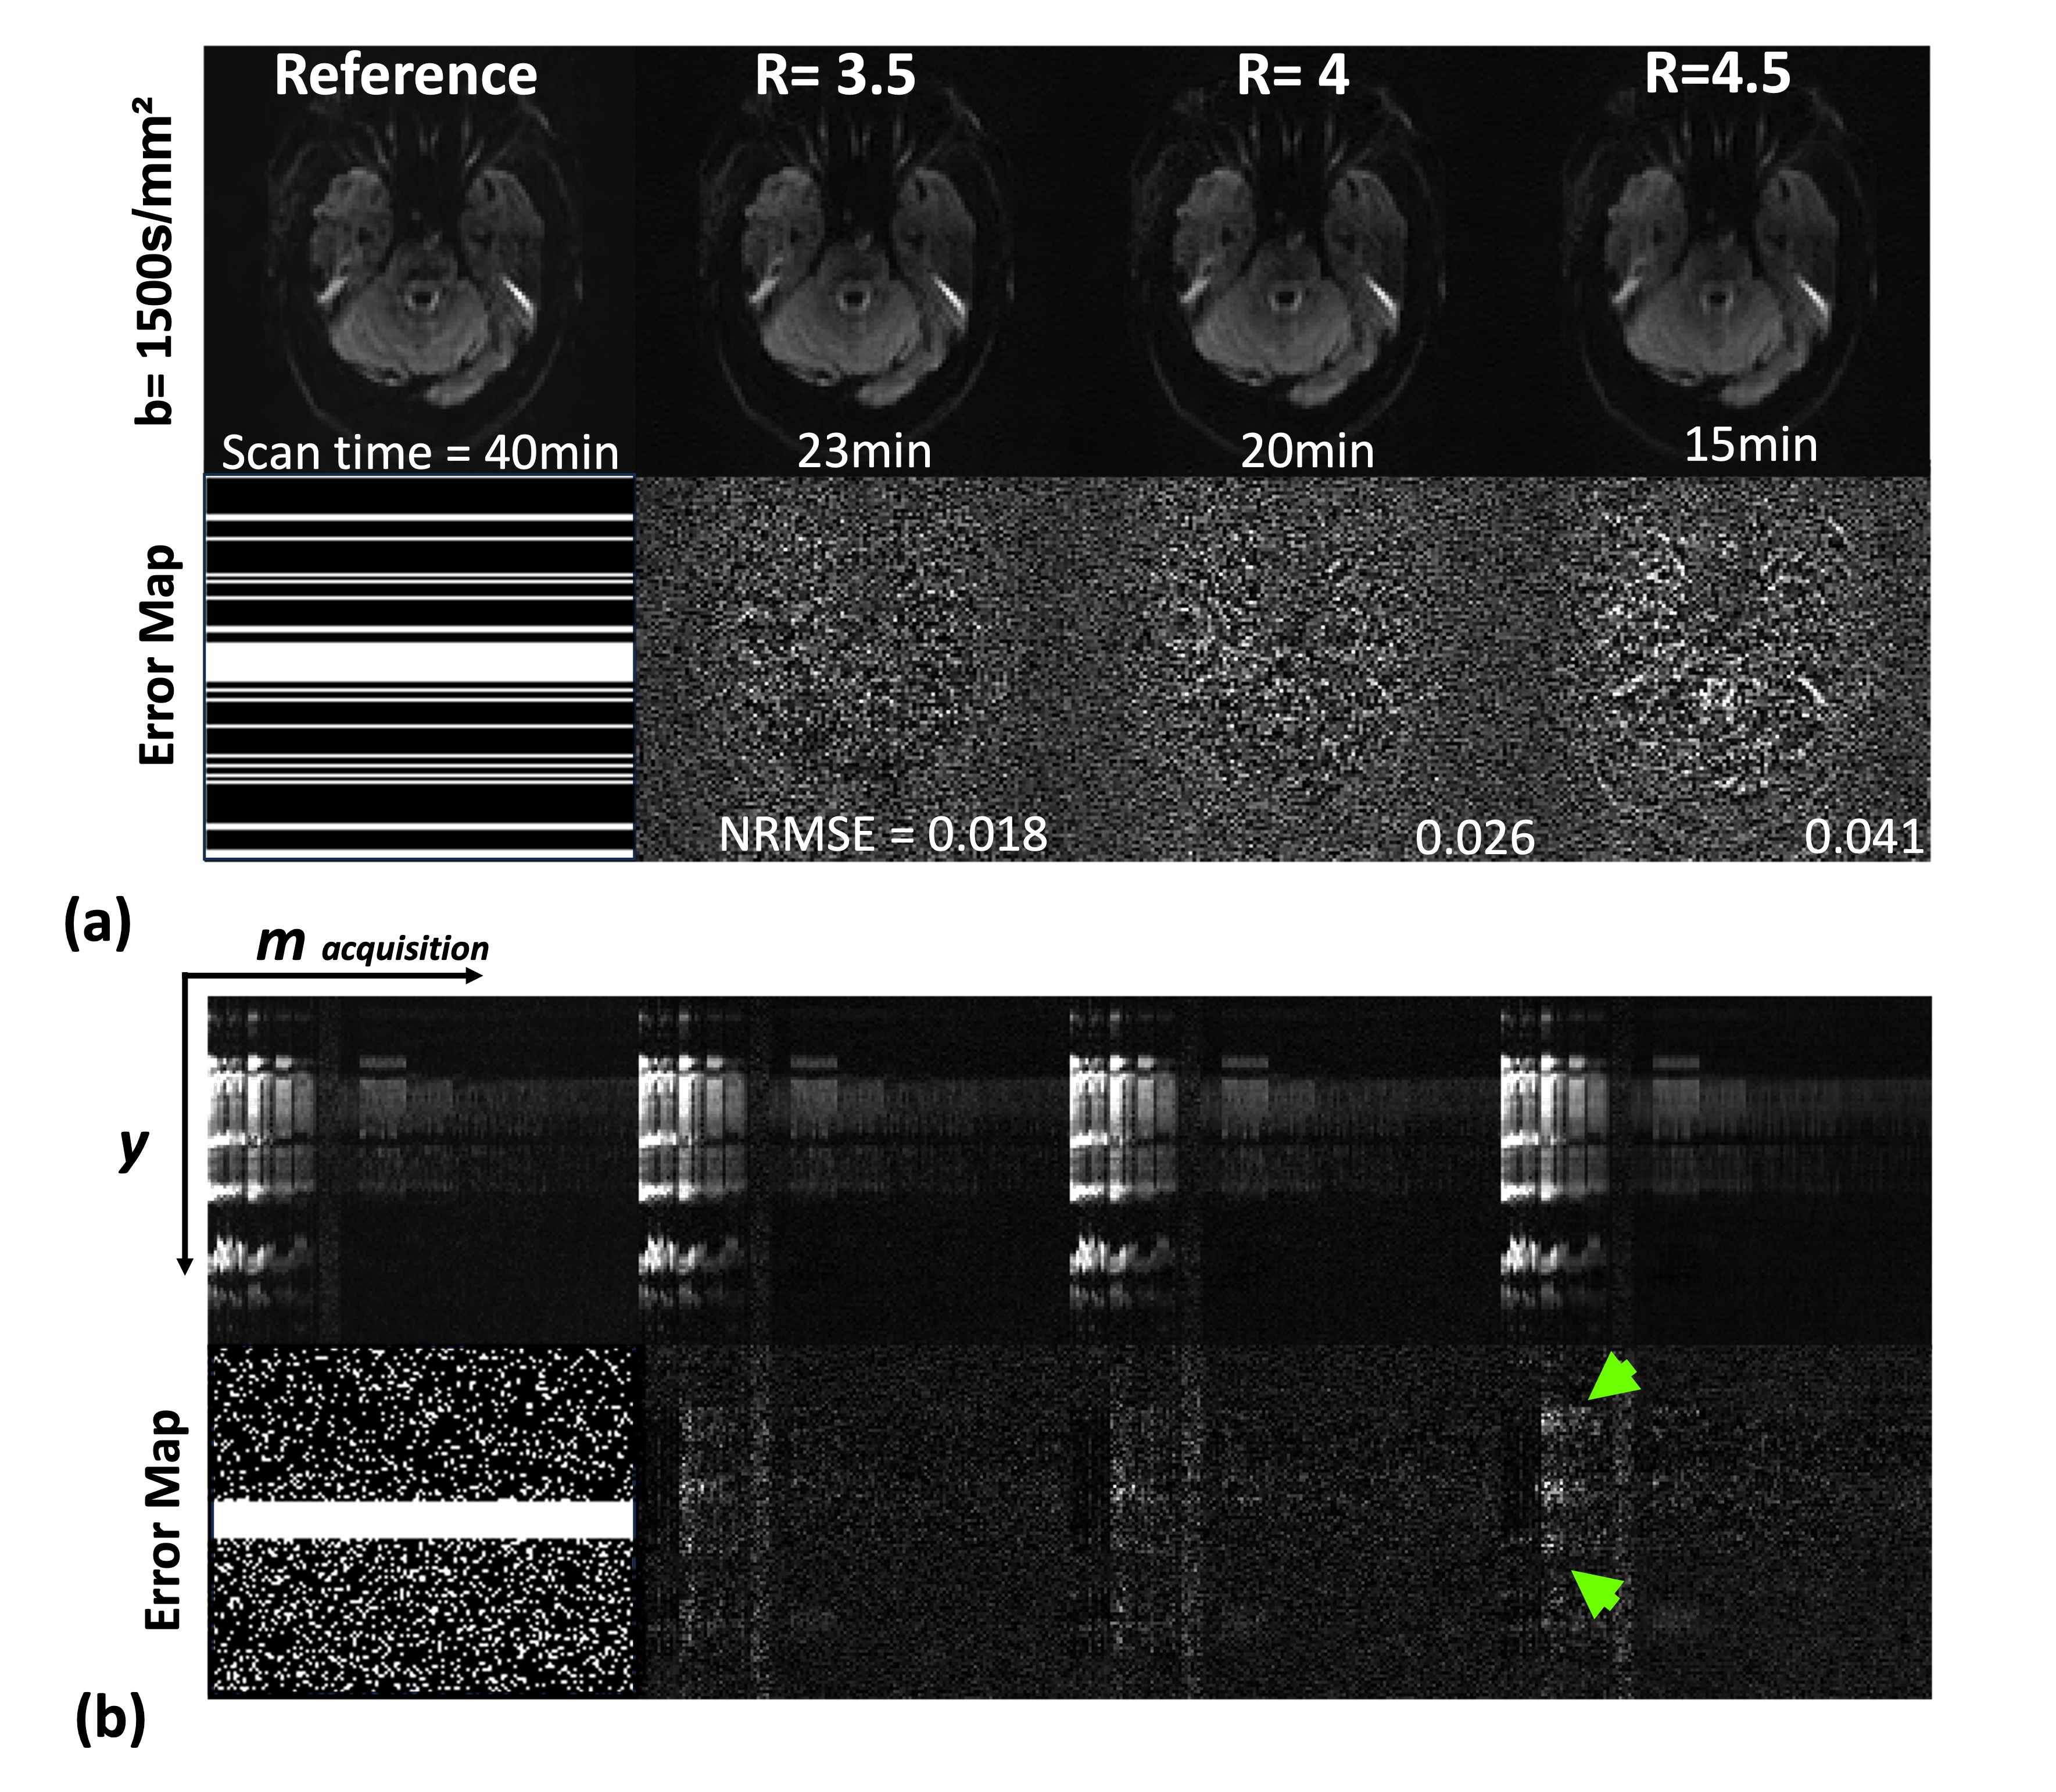

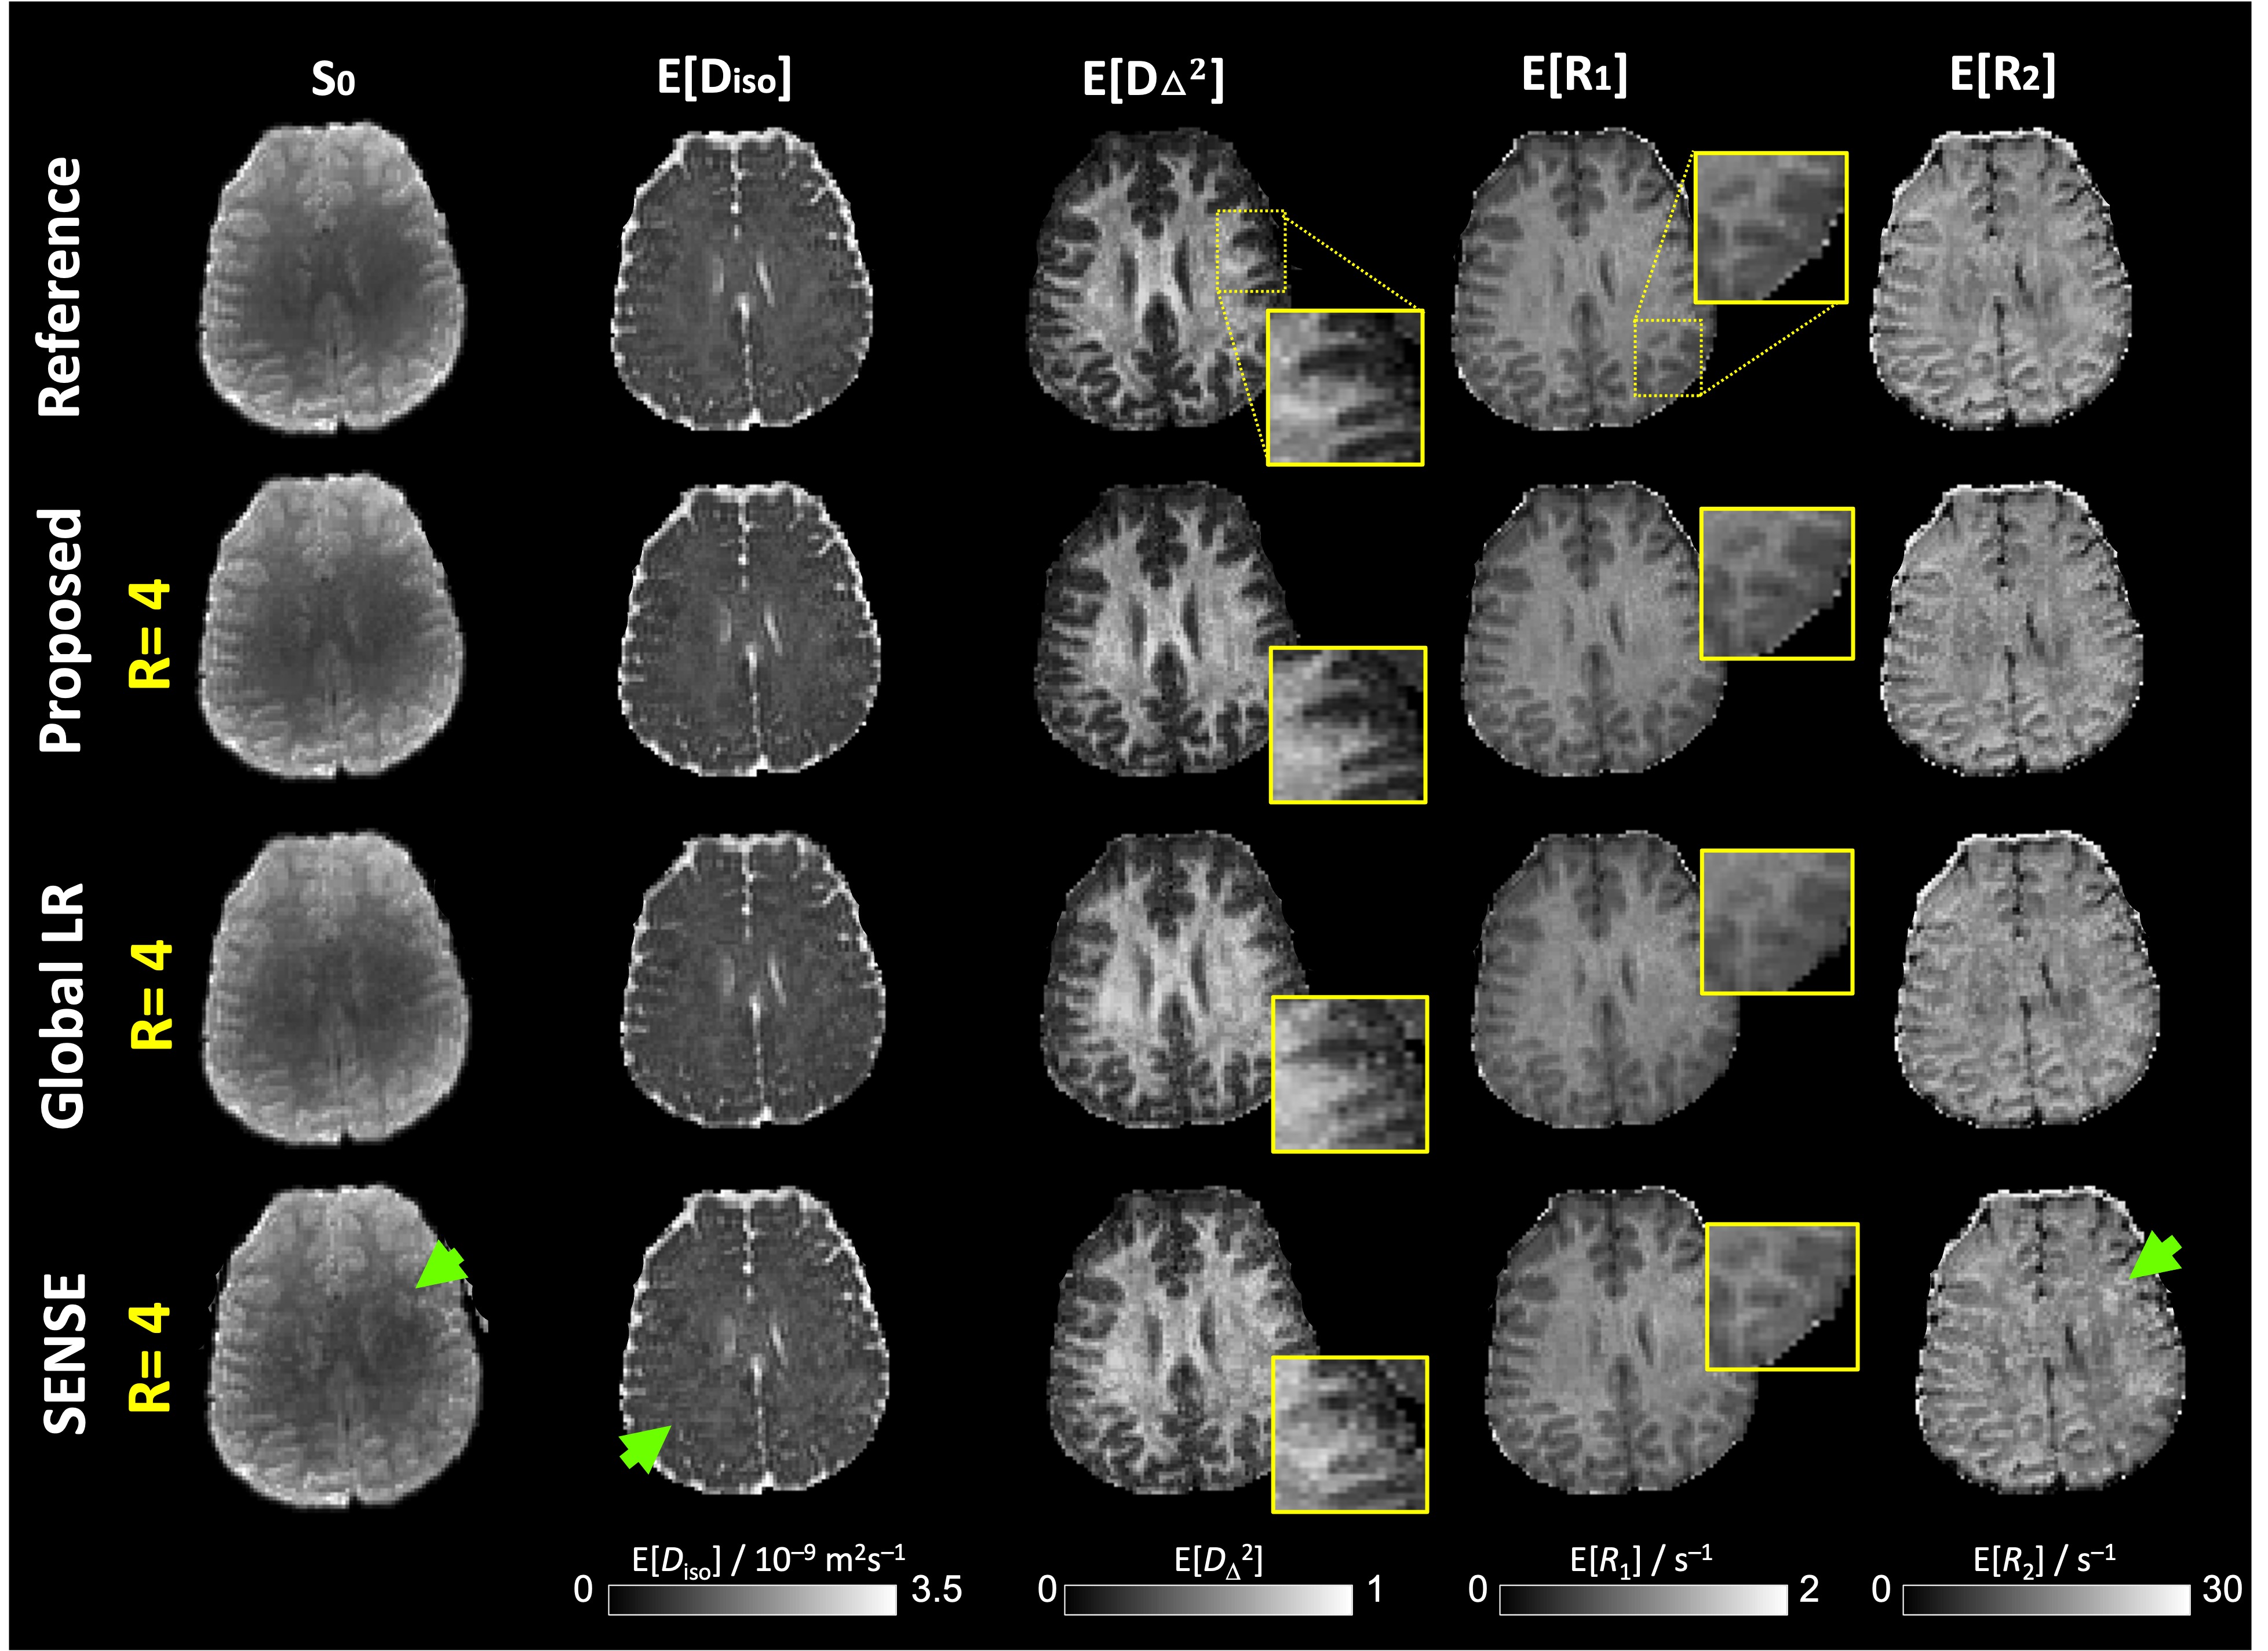
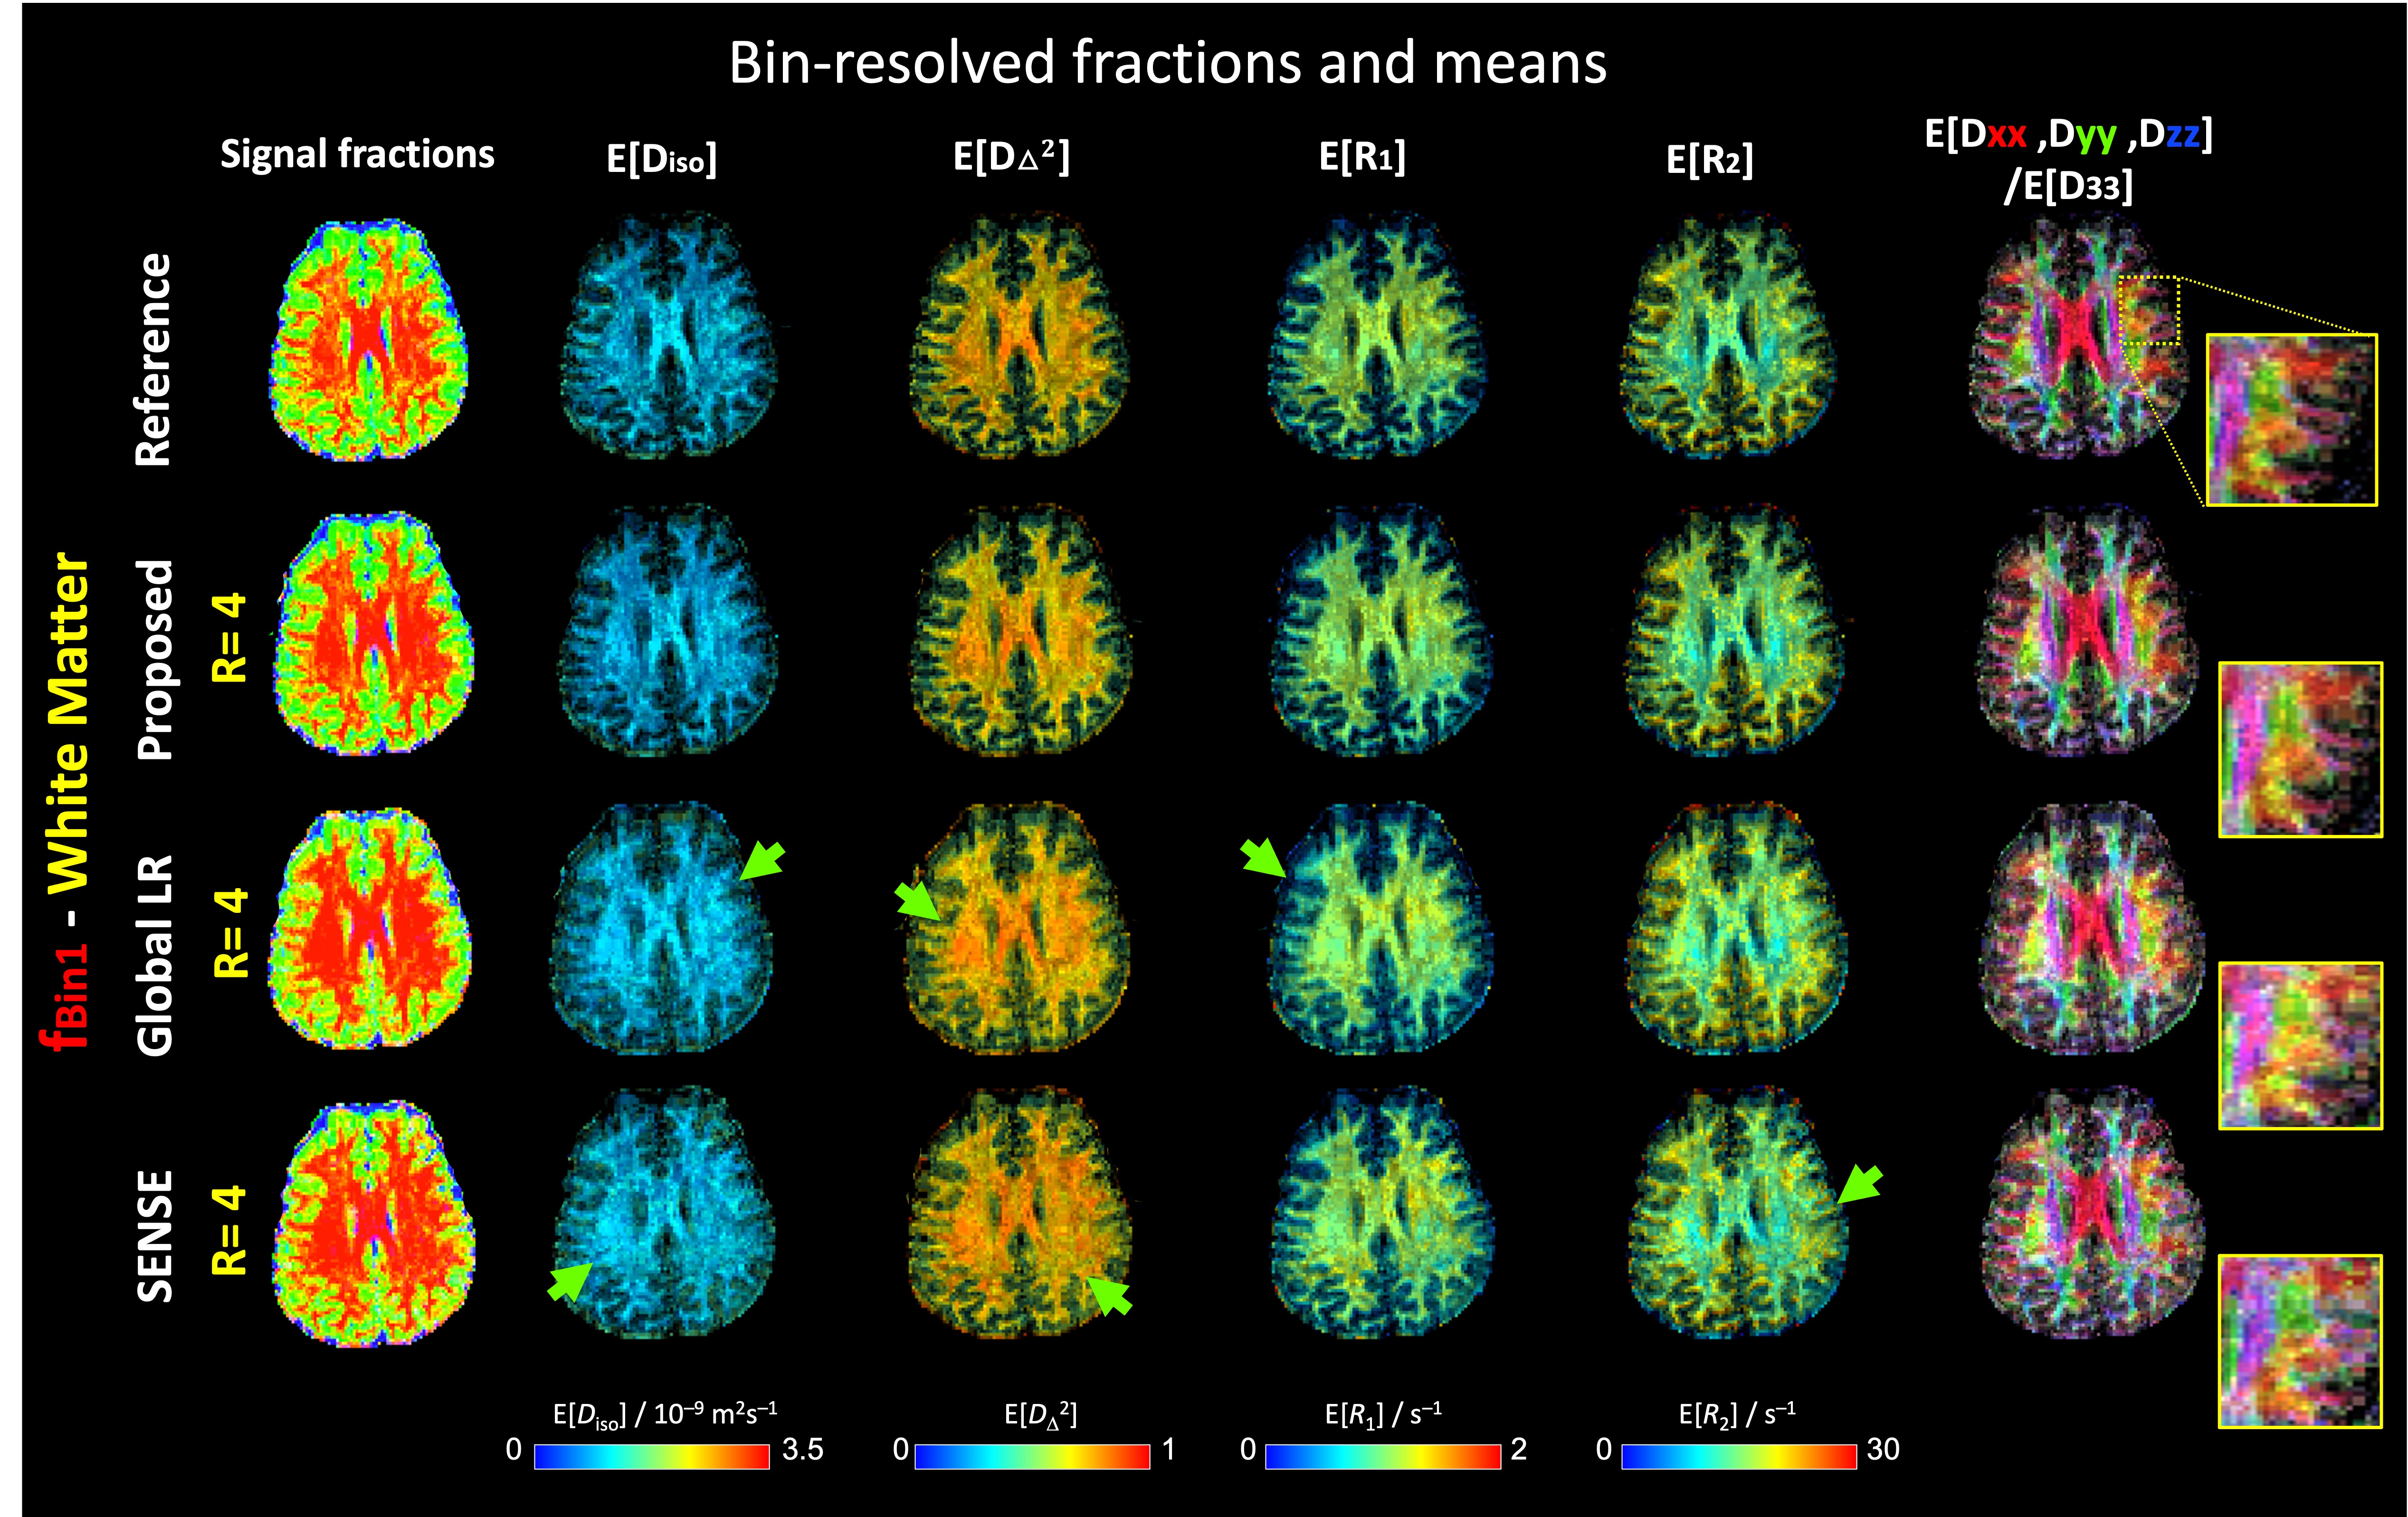
Figure 1 shows the reconstructed MD-MRI raw images and corresponding error maps by using the proposed method with varying reduction factors, R=3.5 to 4.5.Compared with R=4.5, R=4 image shows better suppression of noise and aliasing artifact in both spatial and acquisition domains. Figure 2 displays MD-MRI images reconstructed at R=4 with associated normalized RMSE and structural similarity index (SSIM). Our method demonstrates the lowest reconstruction error and the highest SSIM, preserving image quality throughout the acquisition domain. Moving to processed MD-MRI parametric maps, we examine the performance on estimated voxel-wise signal intensity ($$$S_{0}$$$), mean isotropic diffusivity (E[$$$D_{iso}$$$]), mean squared normalized anisotropy (E[$$$D_{\Delta}^2$$$]), mean longitudinal and transverse relaxation rates (E[$$$R_1$$$], and E[$$$R_2$$$], respectively).In Figure 3, our approach at R=4 outperforms global LR and SENSE in preserving fine structural details and reducing noise in all parametric maps.The means in Figure 3 can be computed over different distribution space bins, typically representing WM, GM, and CSF11. Figure 4 compares signal fractions, WM bin-resolved mean diffusion, relaxation, and DEC maps at R=4 using various reconstruction methods and Reference maps.Conclusion
We introduced a MD-MRI image reconstruction method that achieves R=4 reduction factor, and successfully demonstrated its performance $$$\textit{in-vivo}$$$ using Reference data in a retrospective study design. This framework provides whole-brain, 2mm$$$^3$$$voxels, MD-MRI data in about 20 minutes, while maintaining robustness and accuracy of the processed maps. This work is expected to expend its clinical feasibility and application to various neurological disease.Acknowledgements
This work was supported by the Intramural Research Program of the National Institute on Aging.References
[1] P. J. Basser, J. Mattiello, and D. LeBihan. Mr diffusion tensor spectroscopy and imaging. Bio-physical journal, 66(1):259–267, 1994.
[2] D. Benjamini and P. J. Basser. Multidimensional correlation mri. NMR in Biomedicine, 33, 122020.
[3] P. Galvosas and P. T. Callaghan. Multi-dimensional inverse laplace spectroscopy in the nmr ofporous media. Comptes Rendus Physique, 11(2):172–180, 2010.
[4] M. D. Hurlimann, L. Burcaw, and Y.-Q. Song. Quantitative characterization of food productsby two-dimensional d– and – distribution functions in a static gradient. Journal of Colloid andInterface Science, 297:303–311, 5 2006.
[5] D. Benjamini and P. J. Basser. Magnetic resonance microdynamic imaging reveals distinct tissuemicroenvironments. NeuroImage, 163:183–196, 12 2017.
[6] J. P. de Almeida Martins, C. M. W. Tax, A. Reymbaut, F. Szczepankiewicz, M. Chamberland,D. K. Jones, and D. Topgaard. Computing and visualising intra-voxel orientation-specific relax-ation–diffusion features in the human brain. Human Brain Mapping, 42:310–328, 2 2021.
[7] D. Benjamini, D. S. Priemer, D. P. Perl, D. L. Brody, and P. J. Basser. Mapping astrogliosis inthe individual human brain using multidimensional mri. Brain, 8 2022.
[8] D. Kim, E. K. Doyle, J. L. Wisnowski, J. H. Kim, and J. P. Haldar. Diffusion-relaxation correla-tion spectroscopic imaging: A multidimensional approach for probing microstructure. MagneticResonance in Medicine, 78:2236–2249, 12 2017.
[9] H. Lundell, M. Nilsson, T. B. Dyrby, G. J. M. Parker, P. L. H. Cristinacce, F.-L. Zhou, D. Top-gaard, and S. Lasiˇc. Multidimensional diffusion mri with spectrally modulated gradients revealsunprecedented microstructural detail. Scientific Reports, 9:9026, 6 2019.
[10] O. Narvaez, L. Svenningsson, M. Yon, A. Sierra, and D. Topgaard. Massively multidimensionaldiffusion-relaxation correlation mri. Frontiers in Physics, 9:793966, 2022.
[11] J. Sj ̈olund, F. Szczepankiewicz, M. Nilsson, D. Topgaard, C.-F. Westin, and H. Knutsson. Con-strained optimization of gradient waveforms for generalized diffusion encoding. Journal of Mag-netic Resonance, 261:157–168, 12 2015.3
[12] J. T. Johnson, M. O. Irfanoglu, E. Manninen, T. J. Ross, Y. Yang, F. B. Laun, J. Martin,D. Topgaard, and D. Benjamini. In vivo disentanglement of diffusion frequency-dependence,tensor shape, and relaxation using multidimensional mri. bioRxiv, pages 2023–10, 2023.
[13] M. Nilsson, F. Szczepankiewicz, B. Lampinen, A. Ahlgren, J. ao P. de Almeida Martins, S. Lasic,C.-F. Westin, and D. Topgaard. An open-source framework for analysis of multidimensionaldiffusion mri data implemented in matlab. Proceedings of the International Society for MagneticResonance in Medicine, Paris, France, 2018.
[14] J. Martin, A. Reymbaut, M. Schmidt, A. Doerfler, M. Uder, F. B. Laun, and D. Topgaard.Nonparametric d-r1-r2 distribution mri of the living human brain. NeuroImage, 245:118753, 122021.
Figures