2448
Inversion Recovery Quasi-Diffusion Tensor Imaging1Neurosciences Research Centre, St George's, Univerisity of London, London, United Kingdom
Synopsis
Keywords: Diffusion Acquisition, Brain
Motivation: To provide a clinically feasible Quasi-Diffusion Tensor Imaging (QDTI) acquisition with free water suppression.
Goal(s): To assess the effect of inversion recovery (IR) on QDTI measures in grey and white matter and determine measurement accuracy in clinically feasible data acquisitions.
Approach: dMRI were acquired (8 b-values) with and without IR. QDTI measures were computed in brain tissue. Measurement bias was quantified for 4 and 3 b-value data subsets.
Results: IR reduced free water effects by lowering grey matter diffusion coefficients in grey matter and raising tissue anisotropy. QDTI $$$\alpha$$$ was robust to effects of IR. Clinically feasible acquisitions provide accurate IR-QDTI measures.
Impact: Our results suggest that IR-QDTI is a straightforward and robust method applicable to clinical studies for accurately characterising non-Gaussian diffusion in diseases of cortical grey matter, and white matter lesions/tumour where substantial numbers of voxels have high free water content.
Introduction
High b-value diffusion MRI (dMRI) has potential to provide more accurate and sensitive detection of brain tissue microstructural characteristics1,2. Partial volume of CSF within a dMRI voxel can be modelled using tissue compartments3,4,5, or suppressed by acquiring Inversion Recovery (IR) dMRI before parameter estimation6,7,8,9,10. We investigate the effect of IR on Quasi-Diffusion Tensor Imaging (QDTI)11,12,13.Quasi-Diffusion MRI (QDI) represents normal effective diffusion derived from the Continuous Time Random Walk model of diffusion dynamics11,12,13. It describes diffusion signal, $$$S$$$, as a stretched Mittag-Leffler function ($$$E_\alpha$$$)11,12,13,
$$E_{\alpha}(-(D_{1,2}b)^{\alpha})=\sum_{k=0}^\infty \frac{(-1)^{k}(D_{1,2}b)^{\alpha k}}{\Gamma(\alpha k + 1)}=\frac{S_{b}}{S_{0}}\quad \quad [1]$$ where $$$\Gamma(x)$$$ is the gamma function, $$$D_{1,2}$$$ the diffusion coefficient (in mm2s-1), and $$$\alpha$$$ is a fractional exponent indicating the negative power law of signal decay at ultra-high b. Gaussian diffusion occurs when $$$\alpha=1$$$ , and non-Gaussian when $$$0<\alpha<1$$$. As QDI is based on a model of diffusion dynamics suppression of free water is preferable to tissue compartment modelling.
Here we assess the impact of IR on QDTI measures estimated from 8-b value dMRI data. We also investigate the accuracy of IR-QDTI measurements in clinically feasible acquisitions with fewer b-values.
Methods
Image acquisition: dMRI were acquired from 6 healthy participants (mean age 22±4.5 years) at 3T. Data were acquired with and without IR using: TE/TR/TI=90/6000/1800ms, δ/Δ=22.8/44.6ms, 20 axial slices, in-plane resolution 1.5mm×1.5mm, slice gap 1mm, slice thickness 5mm; 10 $$$b=0$$$ smm-2 images and 7 b-value shells ($$$\{500,750,1000,1500,2250,3500,5000\}$$$ smm-2) in 6 diffusion gradient directions. b-value shells were averaged $$$1,1,2,2,3,4,5$$$ times, respectively (acquisition time 11 minutes 48 seconds).Image analysis: dMRI were corrected for Gibbs ringing14, motion/eddy current distortions15, and Rician noise13. Eq.1 was fitted in each diffusion gradient direction to estimate $$$D_{1,2}$$$ and $$$\alpha$$$ using the trust-region-reflective algorithm16. QDTI maps of mean $$$\alpha$$$ (MD), $$$D_{1,2}$$$ anisotropy (FA), mean $$$\alpha$$$ (MA) and $$$\alpha$$$ anisotropy (AA) were computed11,13. To investigate effects of IR on QDTI measures our model was fitted to all b-values and mean values were calculated within grey (GM) and white matter (WM).
To investigate whether IR-QDTI maps can be reliably estimated from clinically feasible acquisitions, QDTI measures were estimated from $$$b_{mid}=\{0,500,2250,5000\}$$$ smm-2 (acquisition time 6 mins 24 seconds) and $$$b_{short}=\{0,1000,5000\}$$$ smm-2 (acquisition time 5 mins 12 seconds); corresponding to optimal 4 and 3 b-value acquisitions13. Voxel bias (shorter acquisition measures minus full acquisition) and Intraclass Correlation Coefficients (ICC) were calculated for QDTI measures in GM and WM.
Results
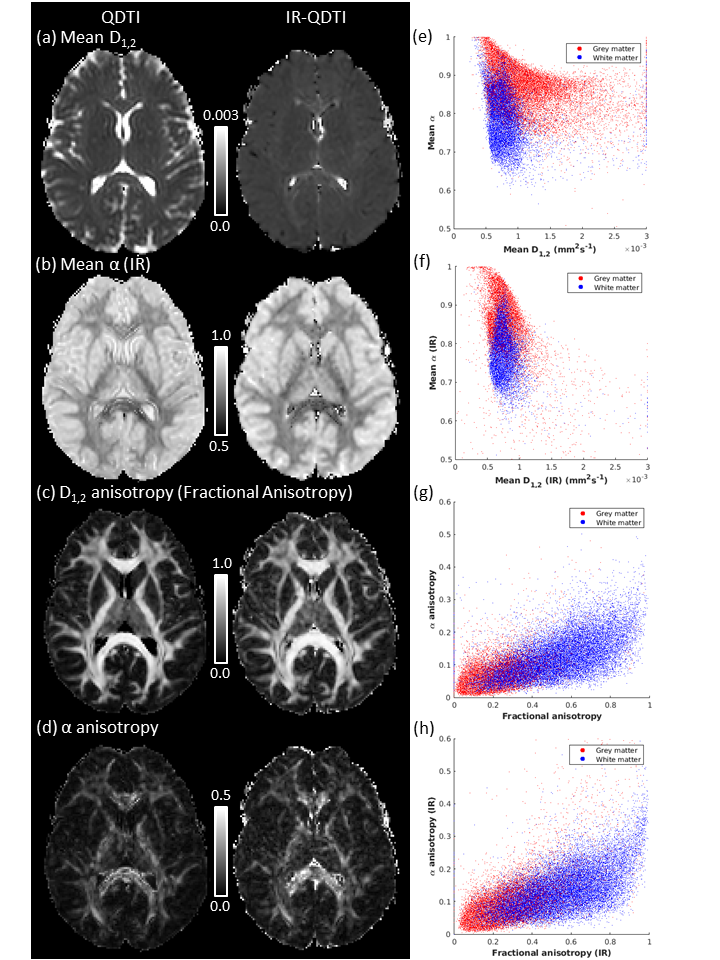
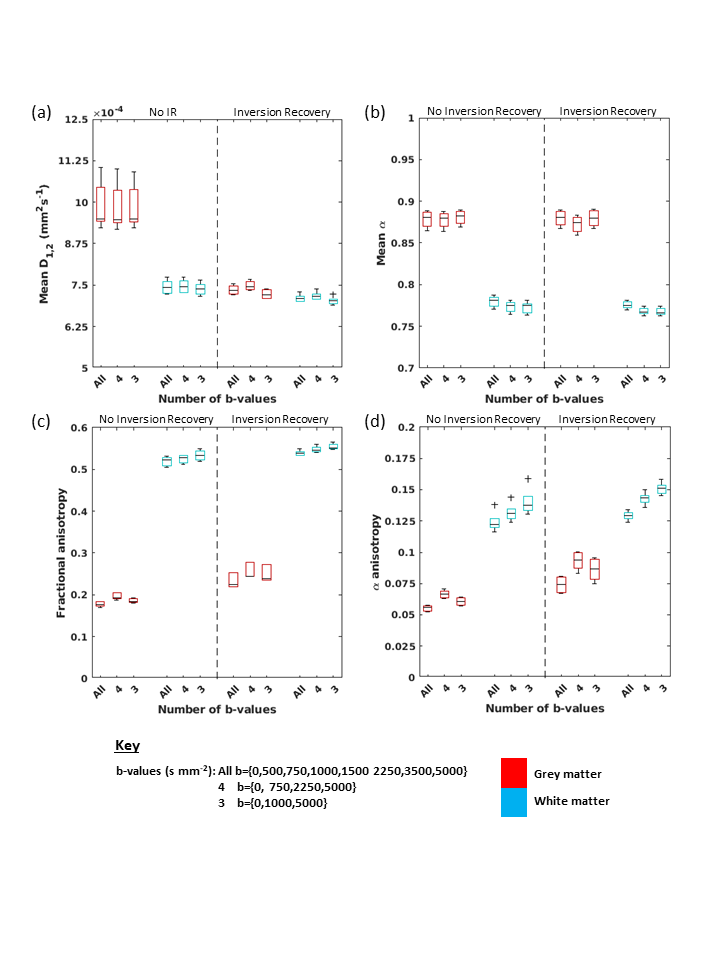
The effect of IR on QDTI measures is shown in Figs.1&2. The largest effect was a significant reduction of average MD in GM (Fig2.a, no-IR 0.990×10⁻³mm2s-1, IR 0.736×10⁻³mm2s-1, tpaired=-6.72, p=0.003) with small significant reductions in WM (no-IR 0.745×10⁻³mm2s-1, IR 0.710×10⁻³mm2s-1, tpaired=-4.31, p=0.013). Small but significant effects were found in MA (Fig2.b, GM: no-IR 0.878, IR 0.880, tpaired=3.54, p=0.024; WM: no-IR 0.780, IR 0.776, paired tpaired=-3.50, p=0.025). IR effects are evident in voxelwise distributions of MA against MD where free water effects are removed in GM (Fig1.e&f).Larger increases with IR were found in anisotropy for GM (FA: no-IR 0.177, IR 0.233, tpaired=10.07, p<0.001; AA: no-IR 0.055, IR 0.074, tpaired=7.39, p=0.002) than WM (FA: no-IR 0.519, IR 0.539, tpaired=6.32, p=0.003; AA: no-IR 0.124, IR 0.129, tpaired=1.28, p=0.271) (Fig2.c&d). Inclusion of IR did not alter voxelwise distributions of AA against FA (Fig1.g&h).
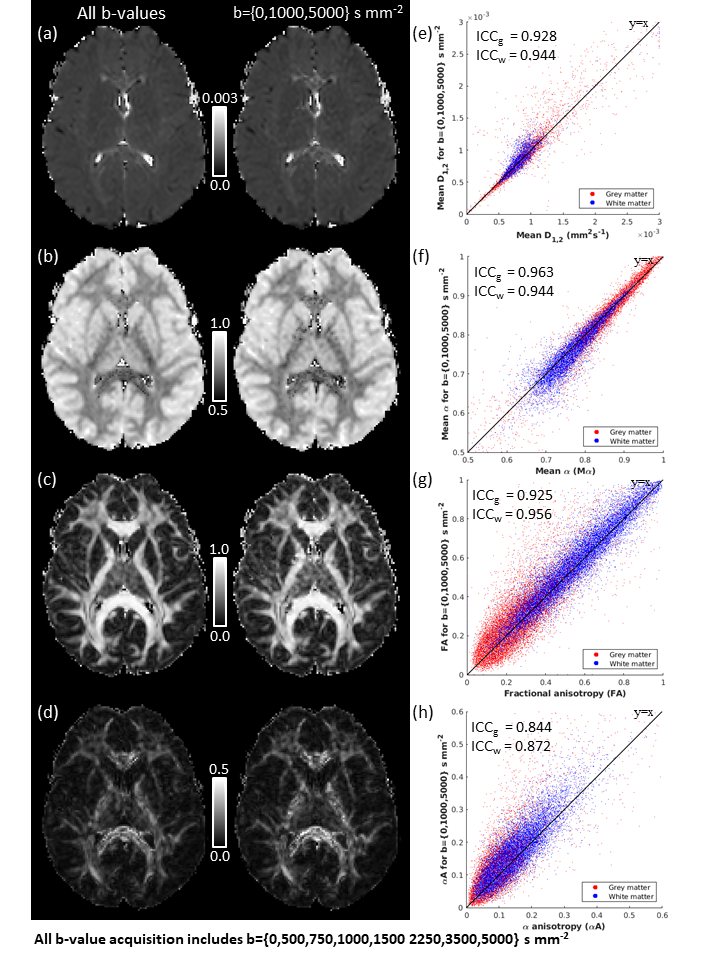
Fig.3 shows QDTI measures are highly accurate and reproducible when estimated from $$$b_{short}$$$ compared to the full acquisition. ICCs were high across brain tissue for $$$b_{short}$$$ (ICC: MD>0.92, MA>0.95, FA>0.92, AA>0.87) and were higher for $$$b_{mid}$$$. Measurement bias in IR-QDTI for $$$b_{short}$$$ was small, ~3% of MD, ~1% of MA, with tissue specific anisotropy effects that were greater for AA (FA: GM ~8%, WM ~3%; AA: GM ~20%; WM 12%). Biases were smaller for $$$b_{mid}$$$.
Discussion and Conclusions
We have shown that CSF suppression enables accurate IR-QDTI maps to be obtained in clinically feasible acquisition times. IR improved image quality by removing point spread functions at CSF/tissue boundaries. Inclusion of IR decreased diffusion coefficients and increased anisotropy due to CSF suppression, consistent with previous studies6,7,8,9,10. Effects of IR on MA were consistent and small (within 0.6% in GM and WM) indicating $$$\alpha$$$ is robust to CSF partial volume effects. Our results suggest $$$\alpha$$$ is more robust to free water effects than Diffusional Kurtosis Imaging (DKI)6. In WM, IR-QDTI measures were within 5% of QDTI measures indicating it is more robust to CSF contamination than DKI6.In conclusion, our results suggest that IR-QDTI is a straightforward and robust method applicable to clinical studies for accurately characterising non-Gaussian diffusion in diseases of cortical GM and WM lesions/tumour tissue where substantial numbers of voxels have high free water content.
Acknowledgements
Funding for this study was provided by a St George’s, University of London Innovation Award.References
[1] Afzali M, Pieciak T, Newm S, Garyfallidis E, Ozarslan E, Cheng H, Jones DK (2021). The sensitivity of diffusion MRI to microstructural properties and experimental factors, Journal of Neuroscience Methods, 108951.
[2] Veraart J, Fieremans E, Novikov DS (2019). On the scaling behaviour of water diffusion in human brain white matter, Neuroimage (2019), 185: 379-387.
[3] Pasternak O, Sochen N, Gur Y, Intrator N, Assaf Y (2009). Free water elimination and mapping from diffusion MRI, Magnetic Resonance in Medicine, 62(3):717-730.
[4] Zhang H, Schneidr T, Wheeler-Kingshott CA, Alexander DC (2012). NODDI: practical in vivo neurite orientation dispersion and density imaging of the human brain, Neuroimage, 61(4): 1000-1016.
[5] Palombo M , Ianus A, Guerreri M, Nunes D, Alexander DC, Shemesh N, Zhang H (2020), SANDI: A compartment-based model for non-invasive apparent soma and neurite imaging by diffusion MRI, Neuroimage, 215:116835.
[6] Yang AW, Jensen JH, Hu CC, Tabesh A., Falagola MF, Helpern JA (2013). Effect of CSF suppression for diffusion kurtosis imaging, Journal of Magnetic Resonance Imaging, 37(2): 365-371.
[7] Ma X, Kadah YM, LaConte SM, Hu X (2004). Enhancing measured diffusion anisotropy in gray matter by eliminating CSF contamination with FLAIR, Magnetic Resonance in Medicine, 41:423-427.
[8] Salminen LE, Conturo TE, Bolzenius JD, Cabeen RP, Akbudak E, Paul RH (2016). Reducing CSF partial volume effects to enhance diffusion tensor imaging metrics of brain microstructure, Technological Innovations, 18(1): 5-20.
[9] Danyluk H, Sankar T, Beaulieu C (2020). High spatial resolution nerve-specific DTI protocol outperforms whole brain DTI protocol for imaging the trigeminal nerve in healthy individuals, NMR in Biomedicine, 34:e4427.
[10] Li S, Wang B, Xu P, Lin Q, Gong G, Peng X, Fan Y, He Y, Huang R (2013). Increased global and local efficiency of human brain anatomical networks detected with FLAIR-DTI compared to non-FLAIR-DTI. PLOS ONE, 8(8):e71229.
[11] Barrick TR, Spilling CA, Ingo C, Madigan J, Isaacs JD, Rich P, Jones TL, Magin RL, Howe FA (2020). Quasi-diffusion magnetic resonance imaging (QDI): A fast, high b-value diffusion imaging technique, Neuroimage, 211:116606.
[12] Barrick TR, Spilling CA, Hall MG, Howe FA (2021). The Mathematics of Quasi-Diffusion Magnetic Resonance Imaging, Mathematics, 9(15):1763.
[13] Spilling, CA, Howe F, Barrick T (2022), Optimization of quasi‐diffusion magnetic resonance imaging for quantitative accuracy and time‐efficient acquisition, Magnetic Resonance in Medicine, 88(6): 2532-2547.
[14] Kellner, E., Dhital, B., Kiselev, V. G., Reisert, M. (2016). Gibbs-ringing artifact removal based on local subvoxel-shifts. Magnetic Resonance in Medicine 76, 1574–1581.
[15] Andersson, J. L., Sotiropoulos, S. N. (2016). An integrated approach to correction for off-resonance effects and subject movement in diffusion MR imaging. Neuroimage 125, 1063–1078. [16] lsqcurvefit, Matlab, Mathworks. Inc. https://uk.mathworks.com/help/optim/ug/lsqcurvefit.html.
Figures