2435
Comparison of time-division multiplexing and multi-echo sequences for accelerated relaxation diffusion MRI1Brigham and Women's Hospital, Harvard Medical School, Boston, MA, United States, 2School of Biomedical Engineering, Southern Medical University, Guangzhou, China, 3Technology and Innovation Center, GE Healthcare, Niskayuna, NY, United States, 4Division of Medical Physics, Department of Radiology, University Medical Center Freiburg, Freiburg, Germany, 5fMRI Laboratory and Biomedical Engineering, University of Michigan, Ann Arbor, MI, United States
Synopsis
Keywords: Diffusion Acquisition, Quantitative Imaging
Motivation: Compare multi-echo and time-division multiplexing (TDM) sequences that accelerate multi-TE dMRI scans.
Goal(s): To investigate the accuracy of multi-TE diffusion measures using multi-echo and TDM sequences.
Approach: Standard single-TE spin-echo echo-planar imaging (EPI), dual-echo EPI, and TDM-EPI sequences were implemented using Pulseq with matched diffusion and readout gradients. A calibration phantom and a human subject were scanned on two scanners to examine the accuracy of R2 (1/T2) and apparent diffusivity coefficient (ADC) maps.
Results: TDM demonstrates up to 160% reduction in estimated R2 on phantom and 30% in in-vivo data compared to dual-echo sequence.
Impact: The proposed TDM sequence allows for fast and accurate T2 and ADC estimation compared to the conventional multi-echo sequence, making it a potential tool for relaxation-diffusion imaging.
Introduction
Joint modeling of diffusion magnetic resonance imaging (MRI) with multiple echo times (TEs) has been investigated to derive novel microstructural measures that improve standard quantitative relaxometry and diffusion imaging.1–3 However, the longer scan time is a limitation of this technique in clinical applications. A standard method to accelerate multi-TE scans is to use multi-echo sequences that apply multiple 180° refocusing pulses to generate a train of echoes. However, artifacts often arise in multi-echo images due to transmit field (B1+) inhomogeneity and imperfect refocusing pulses, leading to biases in T2 mapping.4,5 Time-division multiplexing (TDM) sequence6,7 is an alternative strategy to accelerate multi-TE scans by acquiring multiple slices at different TEs to avoid multiple 180° pulses per slice. It uses echo-time shifting gradients to remove interference between slices and coupling with gradient gradients. In this study, we aim to evaluate and compare the accuracy of multi-echo and TDM sequences for multi-TE diffusion scans.Methods
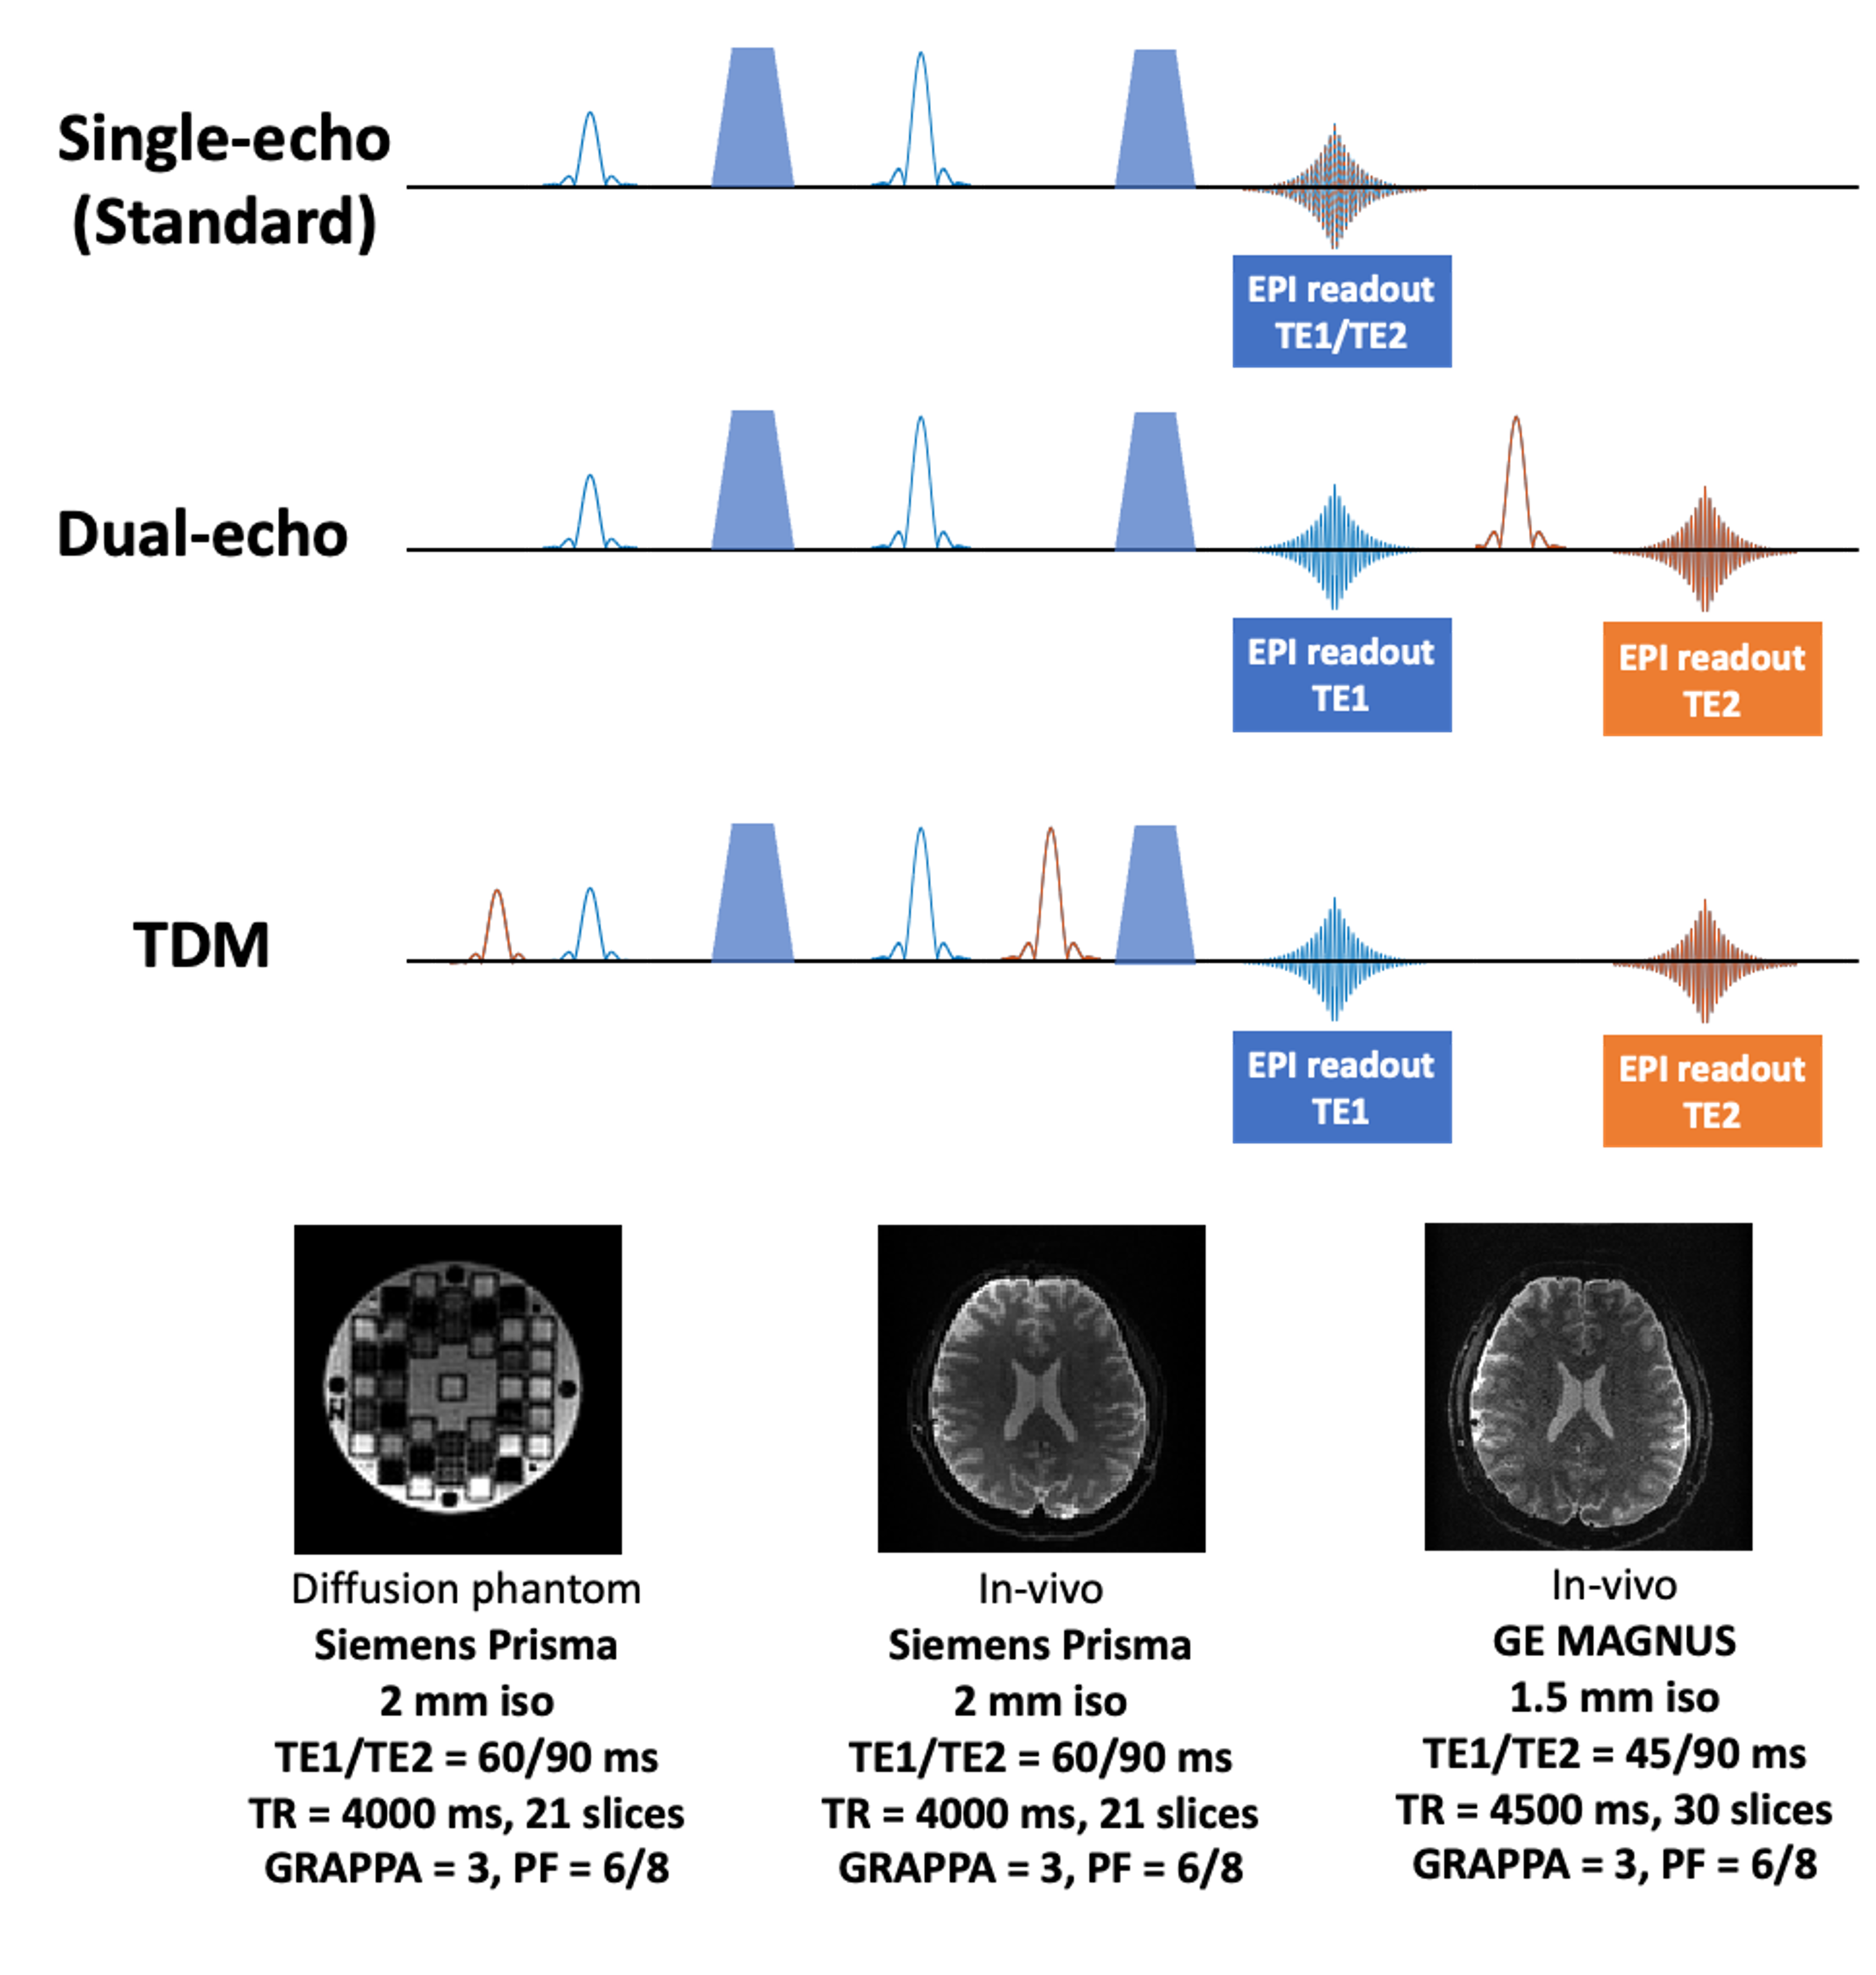
This study follows approval from the local IRBs, and each human subject was scanned in MRI after signing consent forms. We implemented the standard single-TE EPI (reference), dual-echo, and TDM sequences using the vendor-neutral platform Pulseq with matched diffusion and readout gradients. A schematic illustration of the sequences is shown in Figure 1. The sequences were used to scan a phantom and a human subject on a Siemens Prisma whole-body scanner with the following parameters: voxel size=2x2, TE1/TE2/TR=60/90/4000ms, b-value=1000. The subject was scanned again on an advanced GE MAGNUS head-only scanner with voxel size=1.5x1.5, TE1/TE2/TR=45/90/4500ms, b-value=1000.We computed the normalized root mean squared error (NRMSE) in signal intensity between TDM, dual-echo, and standard single echo sequences. We used exponential fitting to derive the R2 (1/T2) maps and calculated the relative error. ADC was fitted for all the sequences at the two echo times of TE1 and TE2 separately. For the phantom scan, we extracted the ADC measures from two groups of regions of interest (ROIs) categorized by low and high diffusivity values, with 8 ROIs in each group. Then, a Wilcoxon-signed rank test was performed to examine the difference in ADC measurements between the data from the three sequences. For the data from the MAGNUS scanner, we compared b0 image intensities at TE2 using relative error and derived R2 maps from the two echoes.
Results
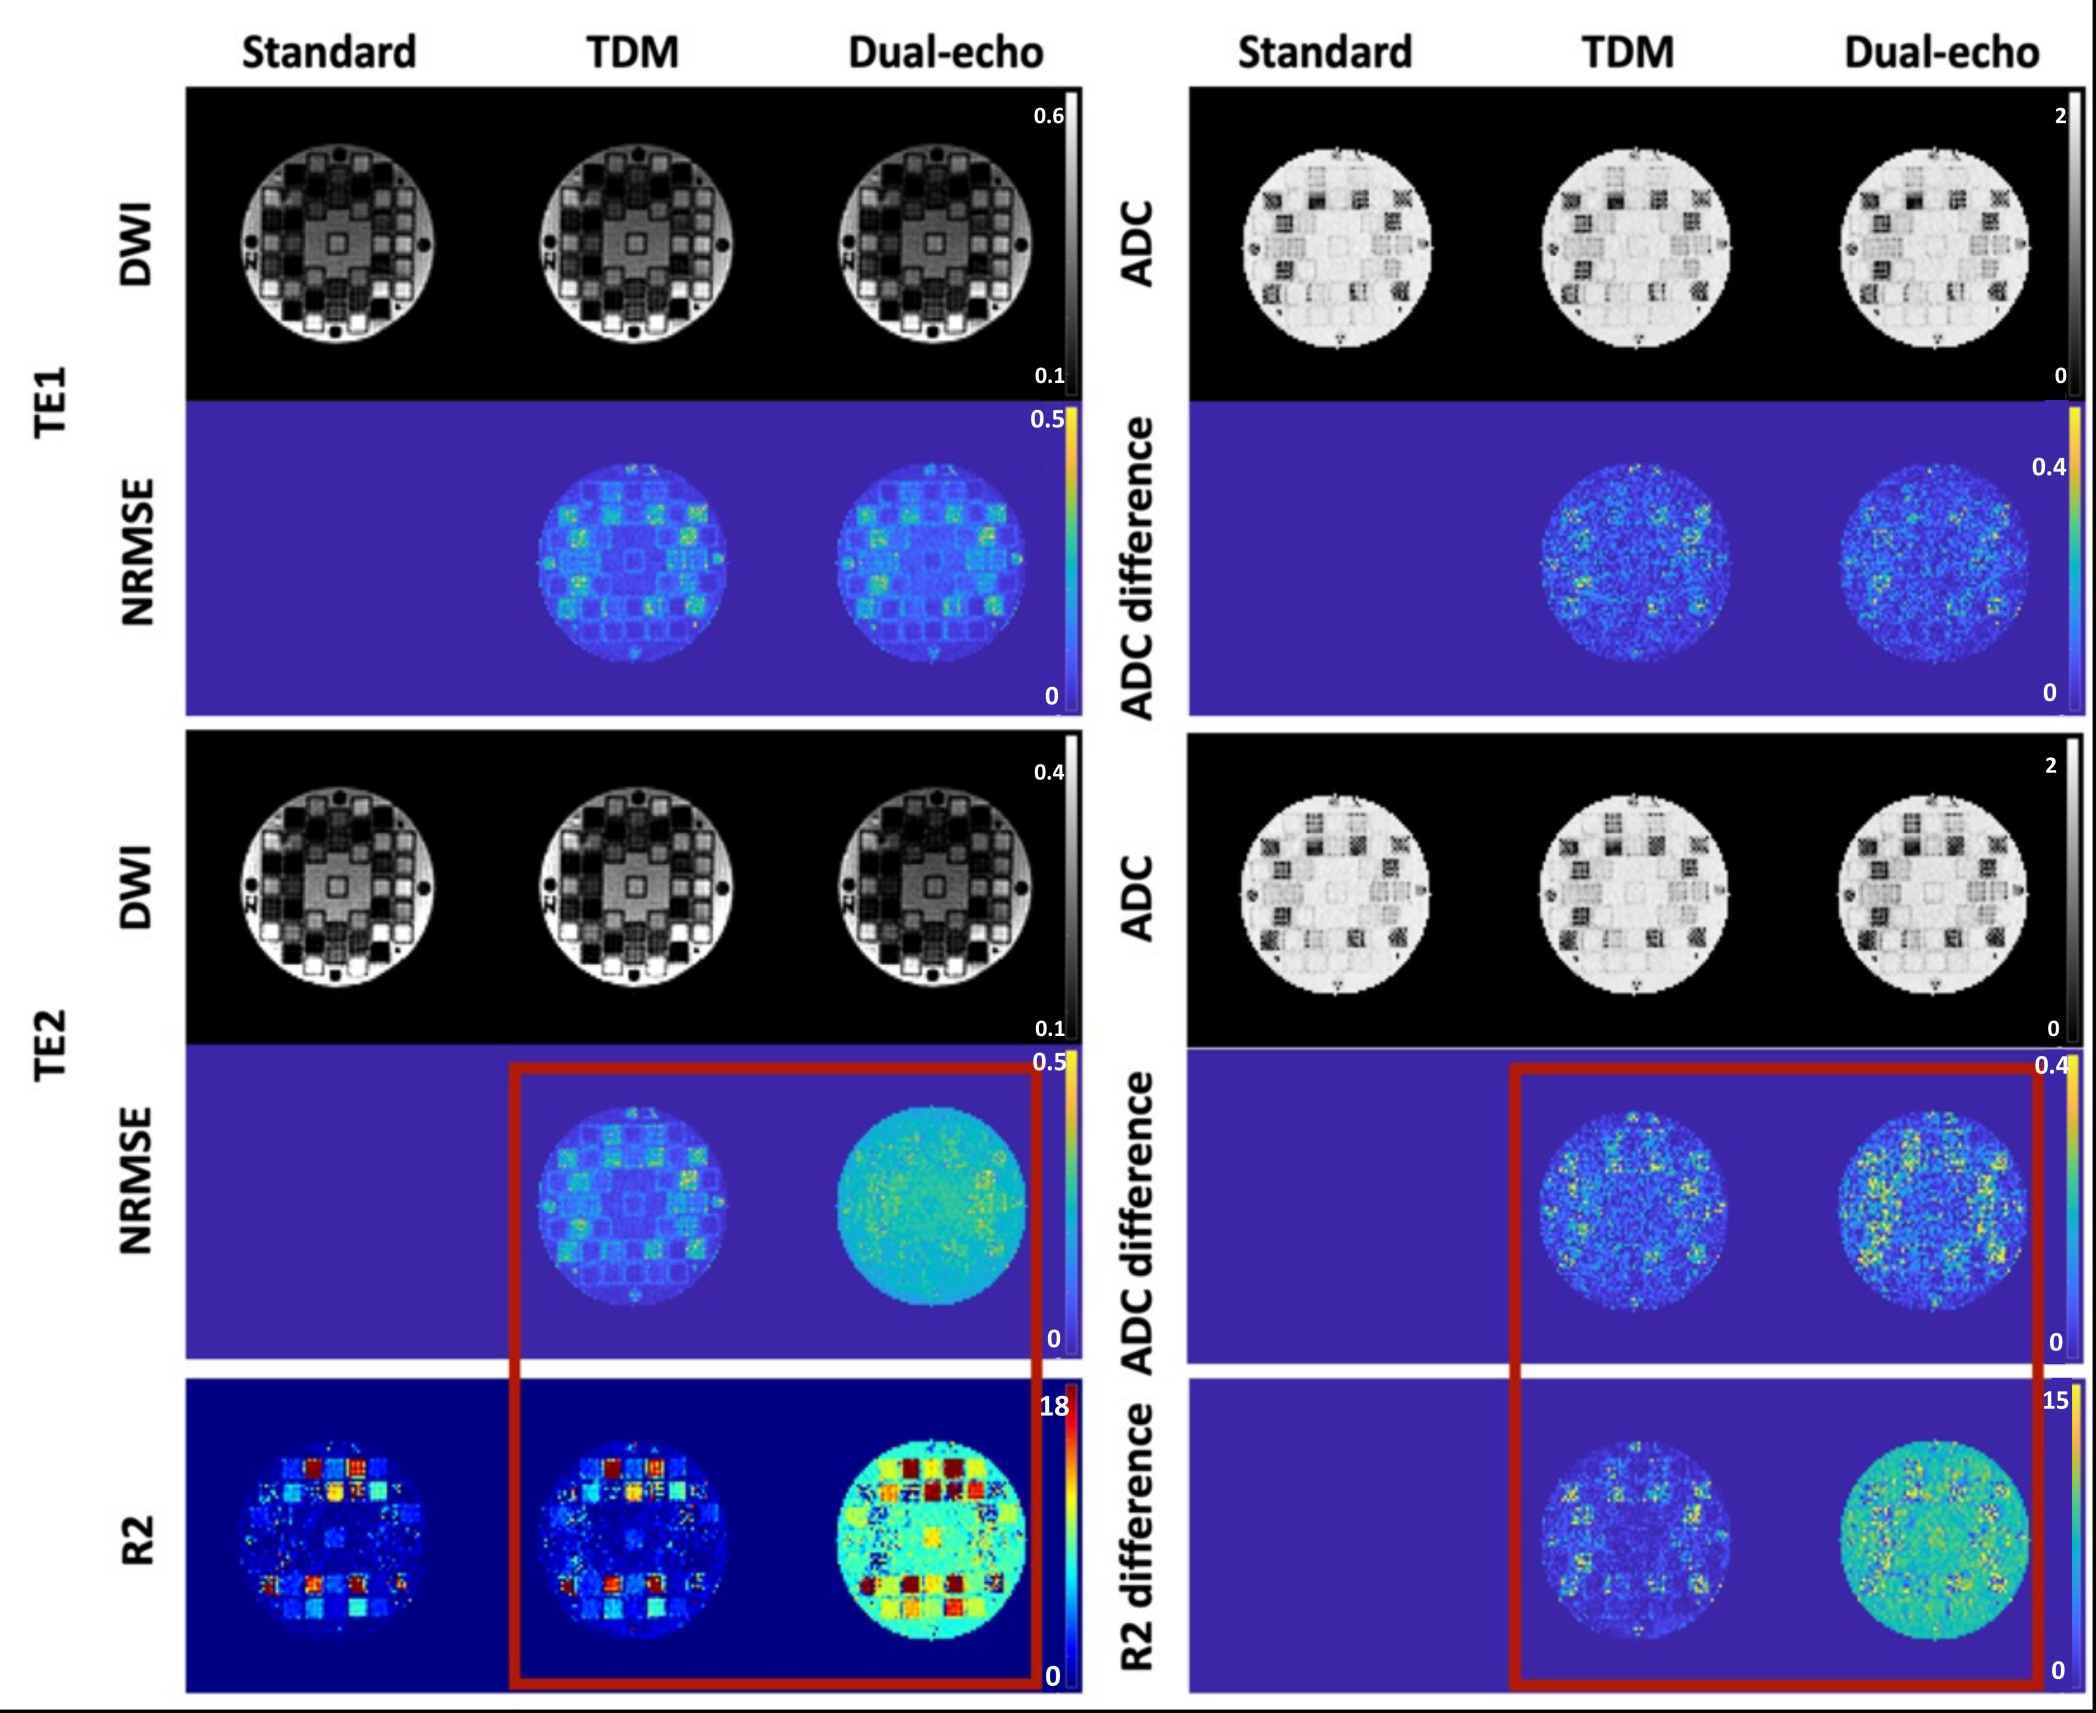
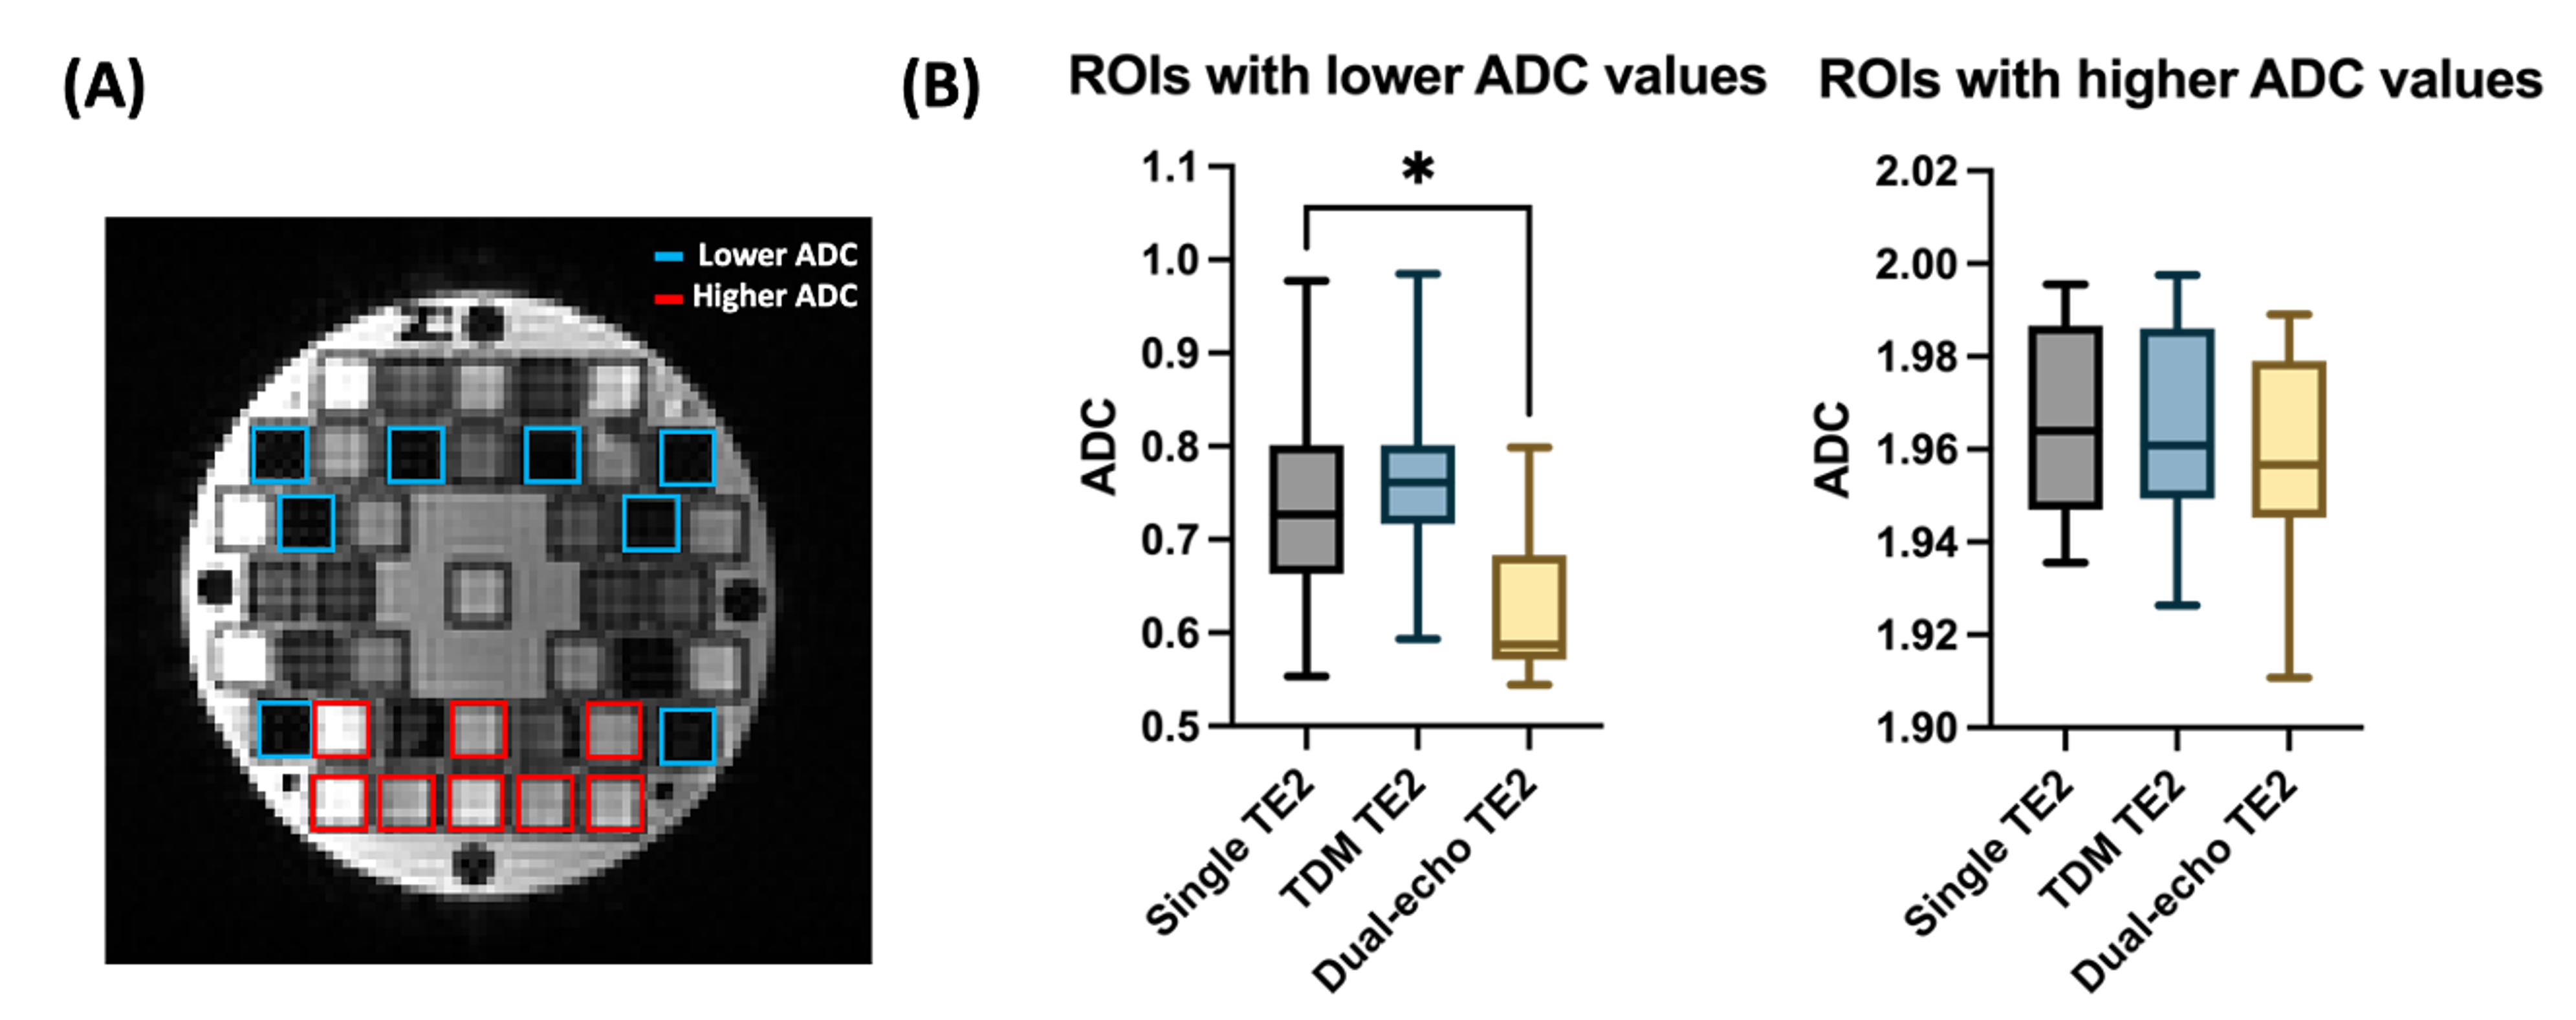
The top two rows of Figure 2 compare the signal intensities and ADC maps from three sequences at TE1 (45ms). As expected, all three sequences show similar image intensities and both dual-echo and TDM have low NRMSE (~0.16) and absolute difference in ADC (~0.23) compared to the standard sequence. The 3rd-4th row of Figure 2 compares signal intensities and ADC maps at TE2 (90ms). The dual-echo sequence showed a much higher NRMSE (0.3 v.s. 0.16; 87.5% lower error with TDM) and higher absolute difference (0.32 v.s. 0.24, 35% lower difference with TDM) in ADC maps compared to the TDM sequence. The last row shows the R2 maps. The estimated R2 map from the TDM sequence closely resembles that from the single echo gold standard. However, the R2 map obtained from the dual-echo sequence exhibits a noticeable bias (~40% difference in longer T2 and ~160% in shorter T2 ROIs).The blue and red boxes in Figure 3A show the two groups of ROIs on the phantom of which ADC values are displayed in Figure 3B. Notably, a significant difference is observed between dual-echo and standard single-echo sequences at TE2 for the group with lower ADC (p=0.0391). No statistical difference is seen using the TDM sequence.
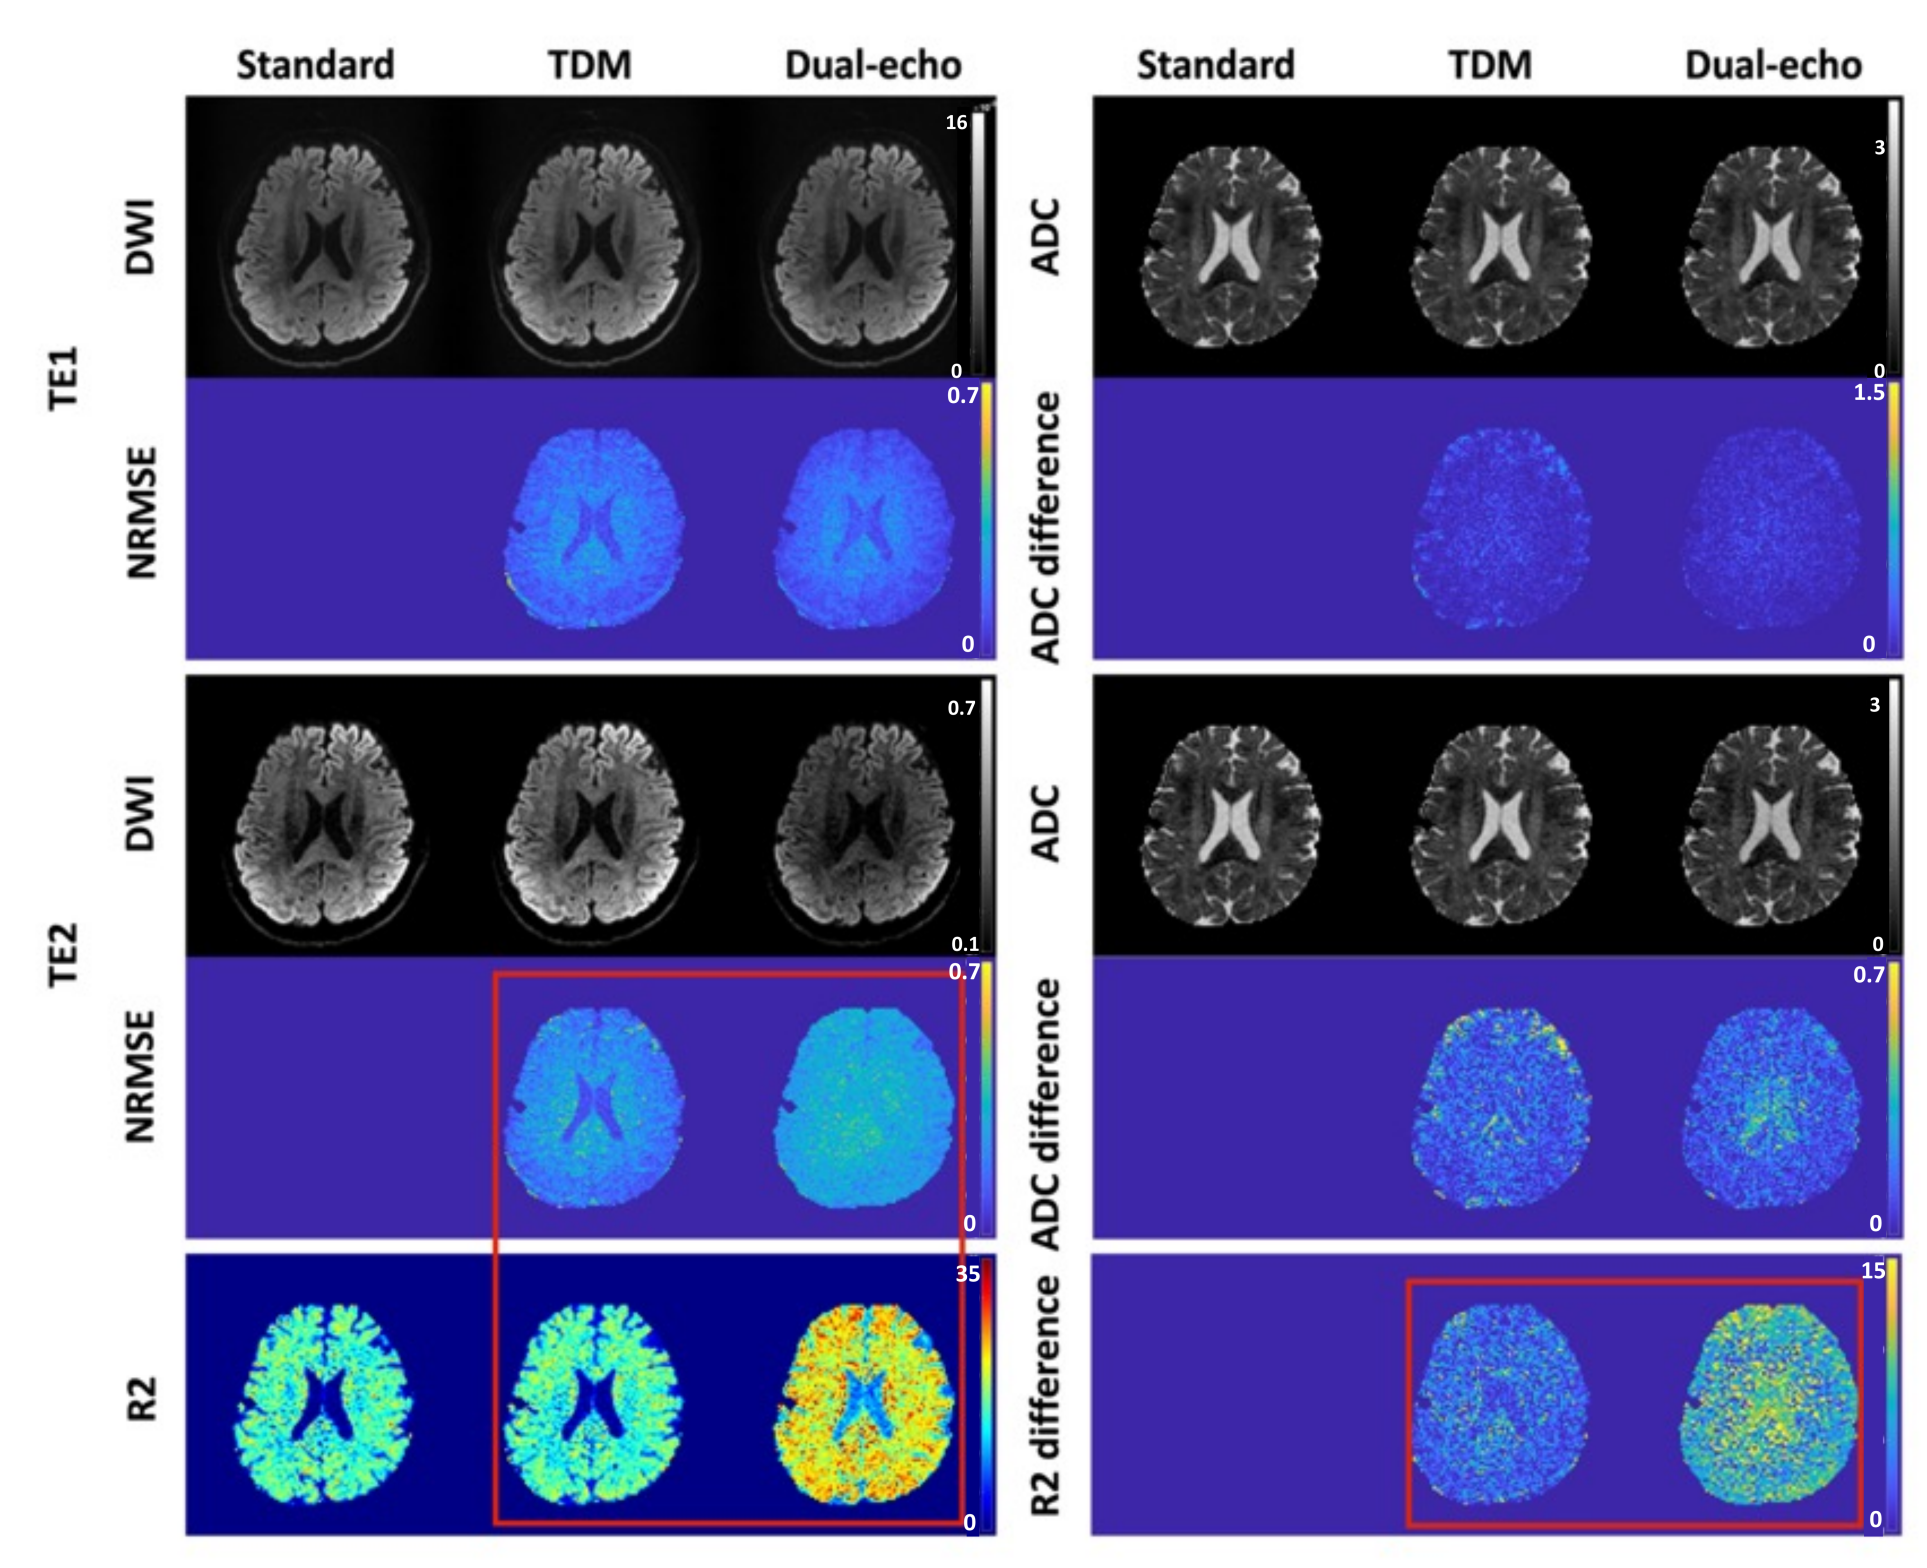
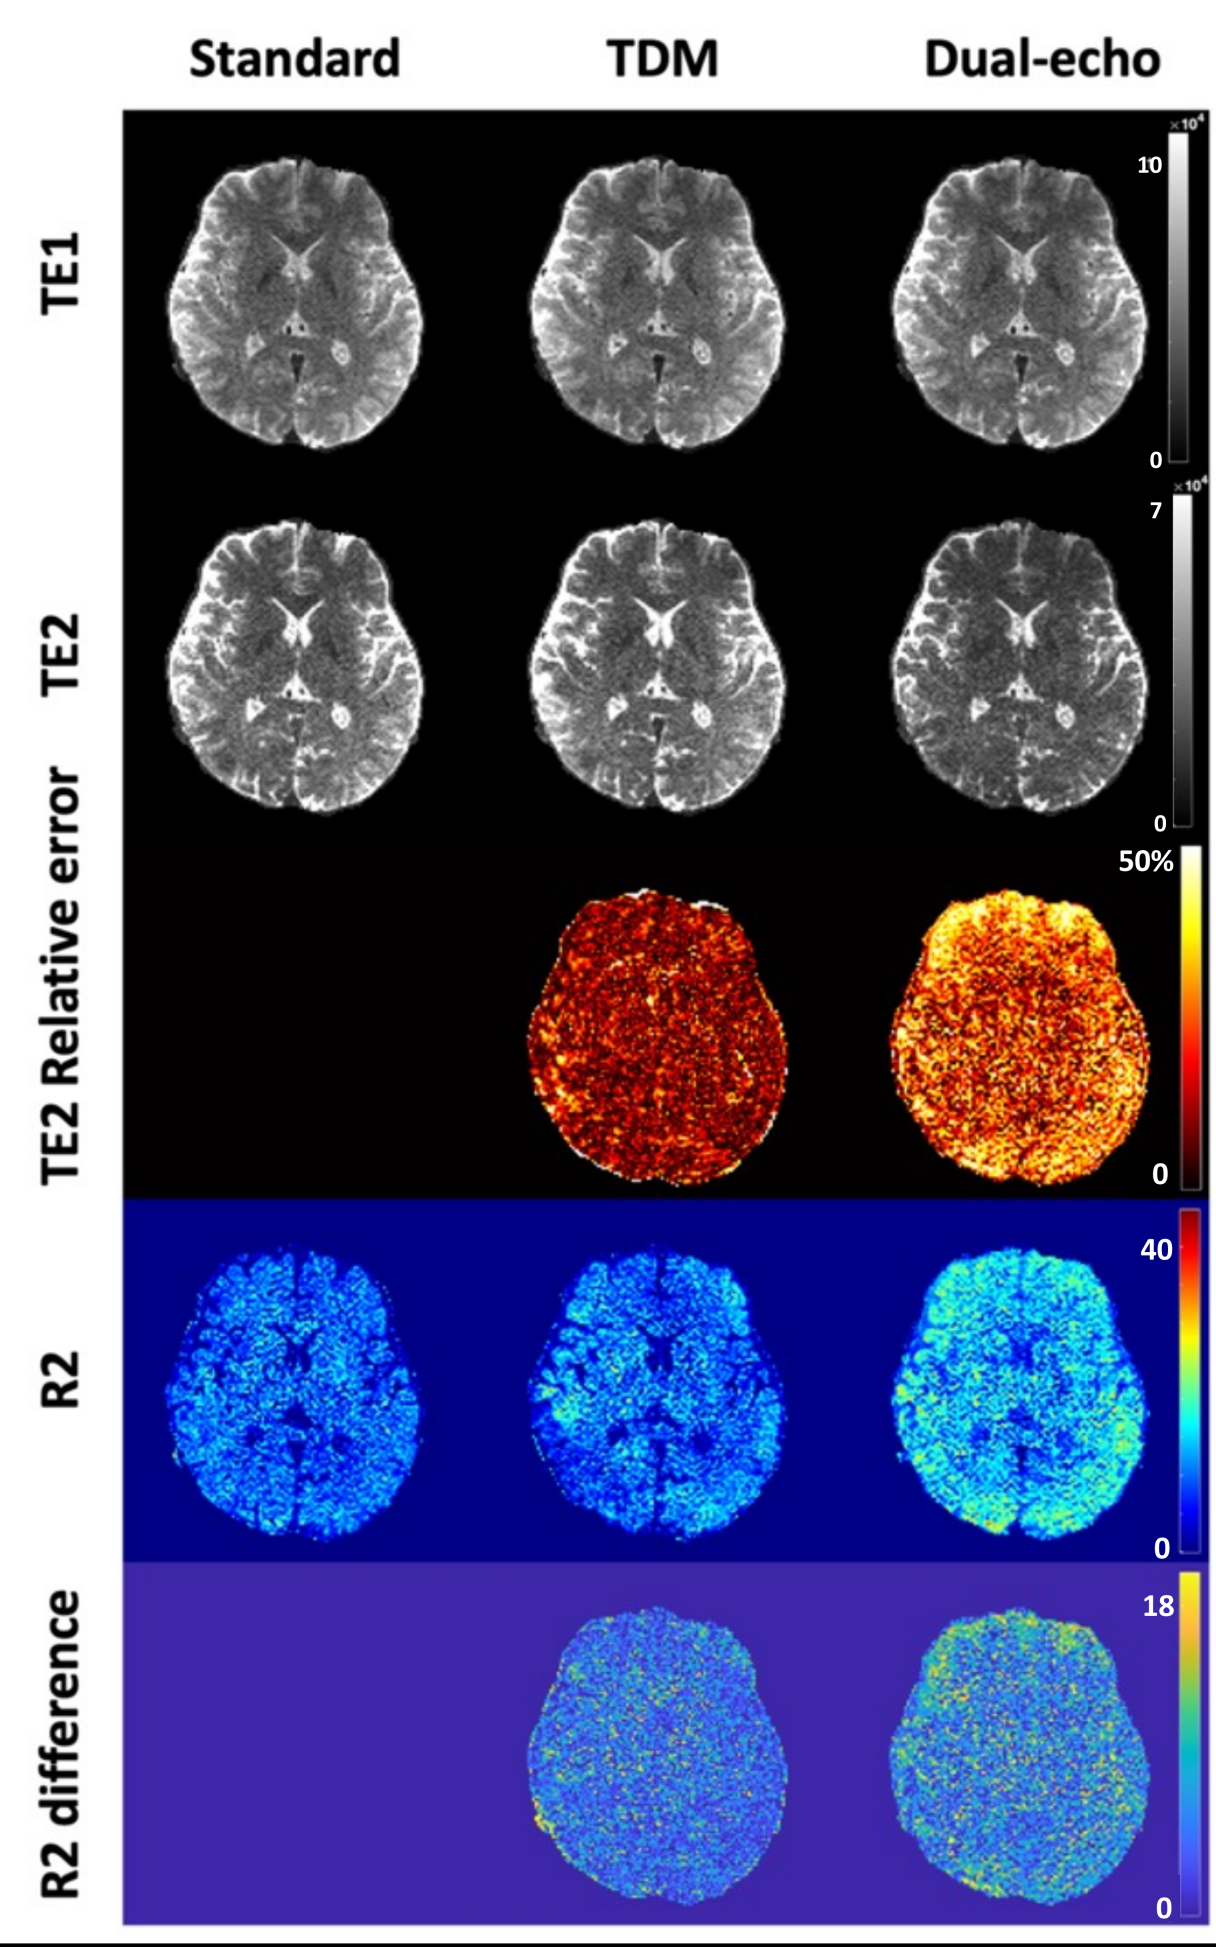
Figure 4 illustrates the evident bias in the TE2 intensity for the dual-echo sequence in in-vivo data. Comparatively, the R2 map obtained from TDM closely matches the single-echo sequence, whereas the R2 map from the dual-echo sequence shows a ~30% bias.
Figure 5 shows that the dual-echo sequence also induces ~30% higher relative error in signal intensity and biased R2 maps, on the MAGNUS head-only MRI system.
Discussion and Conclusion
In this study, with Pulseq, we implemented two sequences designed for fast multi-TE imaging and compared them with the standard single-echo sequence. For both phantom and in-vivo data, our proposed TDM sequence accurately produced T2 maps, while the traditionally used multi-echo sequence exhibited strong bias. Interestingly, the ADC map calculated from dual-echo showed a higher bias at low ADC in the phantom. Leveraging the high-performance MAGNUS gradient system, we achieved a higher resolution DWI with shorter TEs, highlighting the robust advantage of T2 estimation from our proposed TDM sequence.Acknowledgements
This study is supported by Massachusetts Life Sciences Center, and NIH grants K01MH117346, R21MH126396, R01MH116173, R01MH125860, R01EB032378, and R01NS125781.References
1 Ning, L., Gagoski, B., Szczepankiewicz, F., Westin, C. F. & Rathi, Y. Joint RElaxation-Diffusion Imaging Moments to Probe Neurite Microstructure. IEEE Trans Med Imaging 39, 668–677 (2020).
2. Kim, D., Doyle, E. K., Wisnowski, J. L., Kim, J. H. & Haldar, J. P. Diffusion-relaxation correlation spectroscopic imaging: A multidimensional approach for probing microstructure. Magn Reson Med 78, 2236–2249 (2017).
3. Afzali, M. et al. MR Fingerprinting with b-Tensor Encoding for Simultaneous Quantification of Relaxation and Diffusion in a Single Scan. Magn Reson Med 88, 2043–2057 (2022).
4. Petrovic, A., Aigner, C. S., Rund, A. & Stollberger, R. A time domain signal equation for multi-echo spin-echo sequences with arbitrary excitation and refocusing angle and phase. Journal of Magnetic Resonance 309, (2019).
5. Klupp, E. et al. B1-insensitive T2 mapping of healthy thigh muscles using a T2-prepared 3D TSE sequence. PLoS One 12, (2017).
6. Ji, Y., Gagoski, B., Hoge, W. S., Rathi, Y. & Ning, L. Accelerated diffusion and relaxation-diffusion MRI using time-division multiplexing EPI. Magn Reson Med 86, 2528–2541 (2021).
7. Ji, Y. et al. Accelerating joint relaxation-diffusion MRI by integrating time division multiplexing and simultaneous multi-slice (TDM-SMS) strategies. Magn Reson Med 87, 2697–2709 (2022).
Figures