2428
Single-shot diffusion trace spectroscopic imaging using tetrahedral encoding with semi-LASER and radial echo-planar trajectories at 7T1Stevens Neuroimaging and Informatics Institute, Keck School of Medicine, University of Southern California, Los Angeles, CA, United States, 2Department of Radiological Sciences, David Geffen School of Medicine, University of California, Los Angeles, Los Angeles, CA, United States
Synopsis
Keywords: Diffusion Acquisition, Spectroscopy, Spectroscopic imaging
Motivation: We show the first demonstration of single-shot diffusion trace-weighted radial echo planar spectroscopic imaging with tetrahedral diffusion encoding in both phantom and in vivo at 7T.
Goal(s): The advantage of the single-shot DW-REPS is the reduction of the measurement time. This proof-of-concept study applies radial EPSI at 7T for diffusion trace-weighted MRSI.
Approach: Trace ADCs from 3 phantom and 2 in vivo datasets were determined from single-shot DW-REPSI acquisitions.
Results: Preliminary results show good agreement in the estimated phantom ADC values, while in vivo trace ADCs are generally within the expected range although the values tend to be slightly higher than previously reported.
Impact: Our preliminary results indicate a promising approach for determining the orientation-independent trace ADC value with DW-REPSI at 7T. This technique can reduce the total acquisition time for DW-MRSI studies relevant for probing the intracellular properties underlying pathological conditions.
Introduction
Diffusion-weighted magnetic resonance spectroscopy measures metabolite diffusion properties at the intracellular level, in contrast to DW-MRI. Several studies have reported diffusion-weighted spectroscopic imaging (DW-MRSI) using phase encoding alone or echo planar k-space trajectories (EPSI)1-3. Previous reports using Cartesian EPSI implemented a separate navigator echo to monitor the signal for retrospective corrections, as done for single-voxel MRS4-7. Radial echo planar trajectories (REPSI) allow for self-navigation due to their repeated traversal of the k-space origin8,9. The trace apparent diffusion coefficient (ADC) is an orientation-independent quantity; however, it requires at least three measurements to compute with conventional methods4,5. Single-shot techniques can measure a trace-weighted signal in one measurement, although they have only been applied in NMR and to a limited extent in DW-MRI10-14. In this study, we show preliminary results of single-shot trace DW-REPSI using semi-LASER with tetrahedral diffusion encoding15 at 7T in both phantom and in vivo.Methods
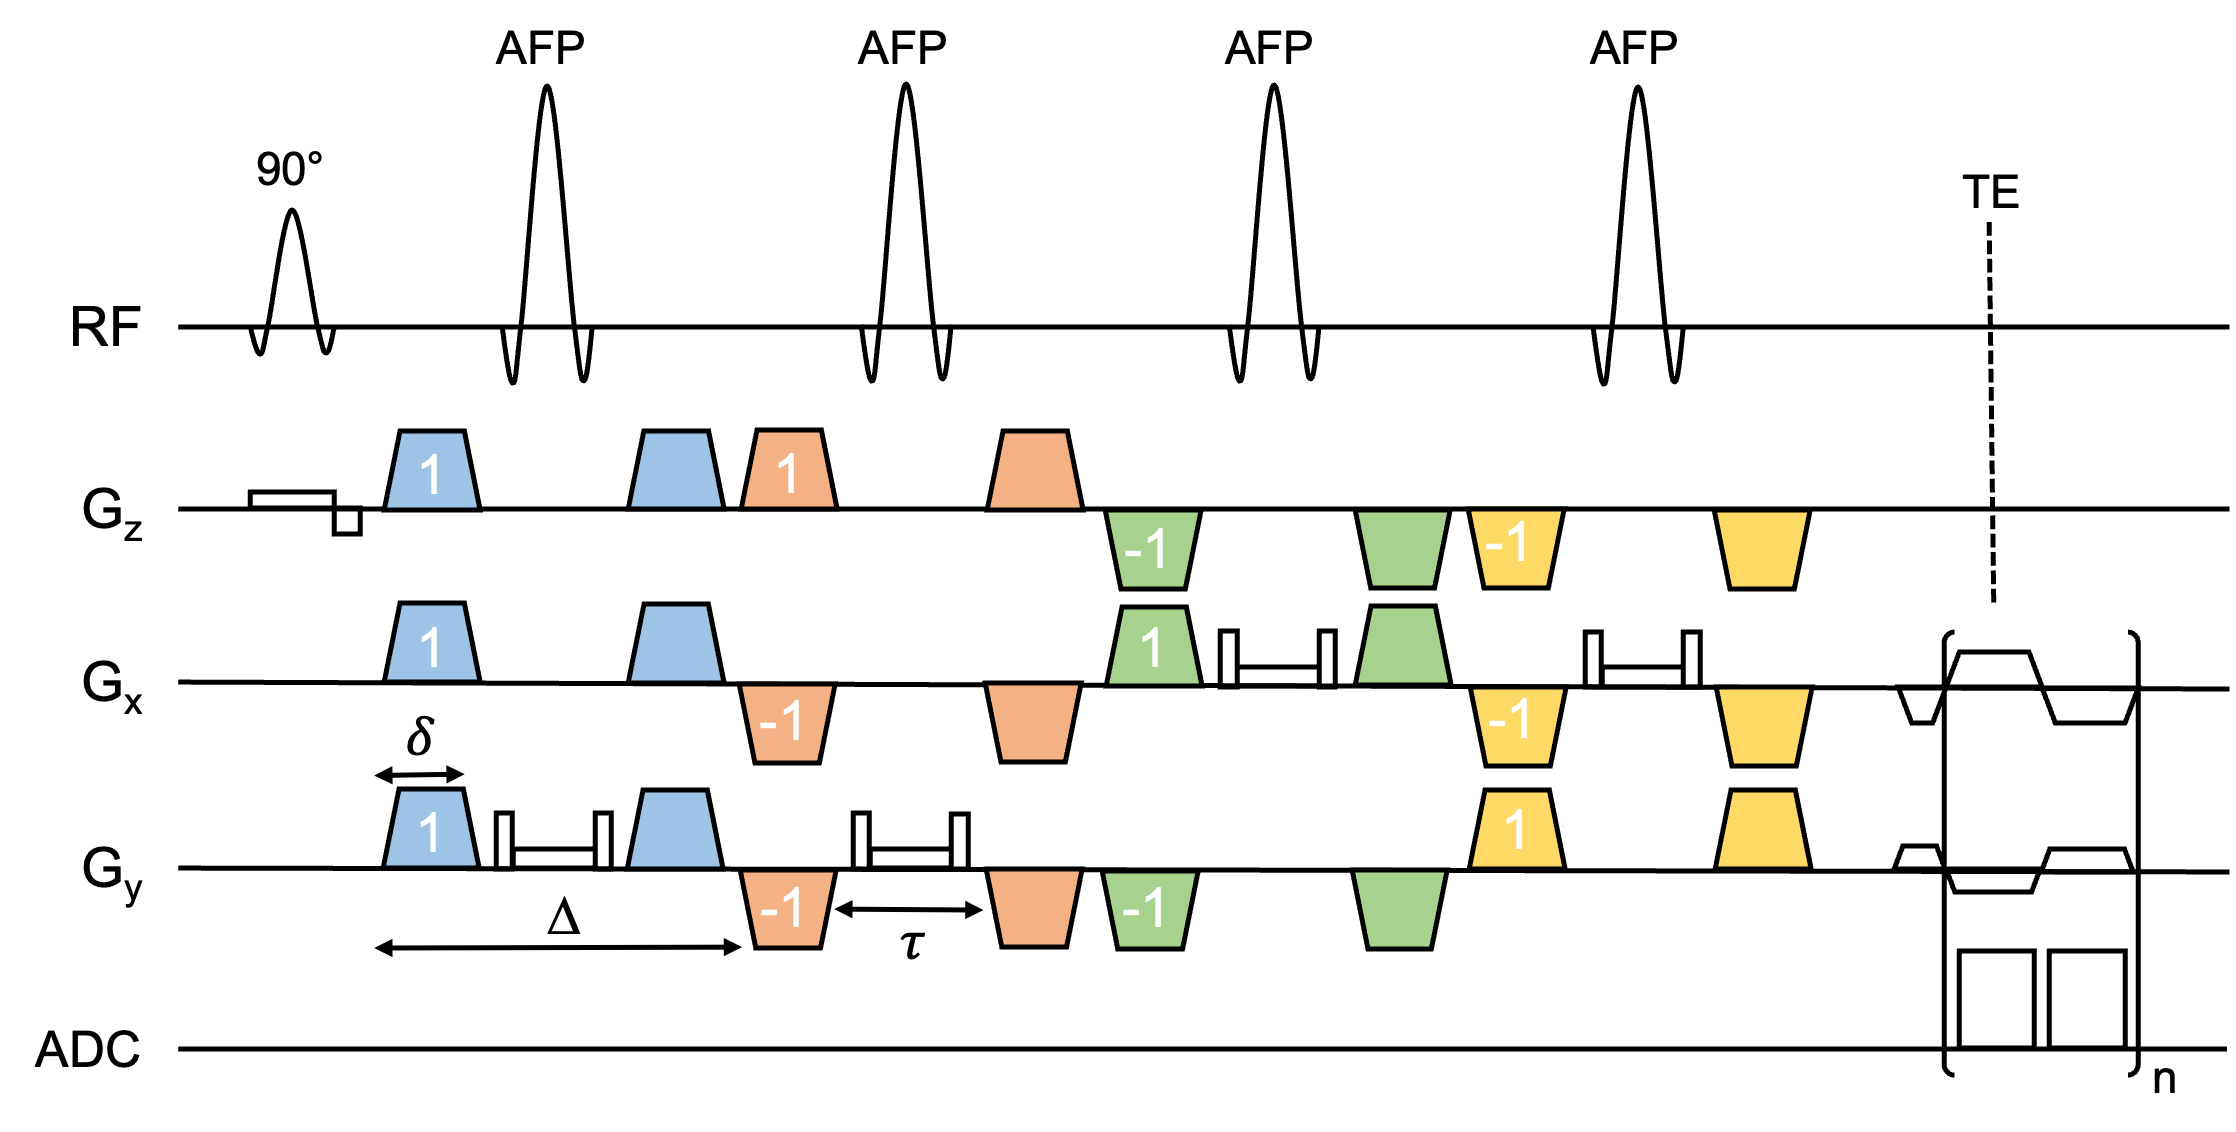
The DW-REPSI sequence consists of semi-LASER localization with diffusion gradients interleaved with the RF pulses along all axes (Figure 1) and with diffusion directions that define a tetrahedral encoding scheme, as previously reported by Najac et al.15. This configuration generates a diffusion trace-weighted signal within a single TR. A symmetric bipolar gradient readout was used to acquire radial echo-planar spectroscopic imaging data. Phase correction was applied to even and odd echoes using a calibration scan16 to achieve a spectral width of 2,380Hz with 1024 time points. The field-of-view was 32×32cm with matrix size=32×32, and the volume-of-interest (VOI) was 10×10×1.5cm and 8×6×1.5cm for phantom and in vivo data, respectively, which was acquired with TR=3s and TE=172ms. Radial data consisted of 33 spokes with uniform angular distribution. The diffusion gradient duration 𝛿=8.4ms with gap 𝛥=43ms and a separation of 𝜏 = 13.2ms between an AFP pulse, giving a diffusion time td ~ 30.8ms. Gradient delay and EPI phase corrections were applied, and navigator FIDs were built from the central k-space points from each spoke to phase and frequency align the radial data before NUFFT-based reconstruction. Water reference data for both phantom and in vivo experiments were acquired with 1 and 2 averages for low and high b-values, respectively, and were used for eddy current phase correction, coil combination, and water ADC estimation. Three data sets were acquired in a phantom containing Lac, NAA, Glu, Cr, Cho, and mI. Two b-values were measured (3 and 1,527 s/mm2), with 2 and 4 averages for the low and high b-values, respectively. The mean phantom ADC values were determined in 5 regions within the 10×10 VOI matrix to determine the homogeneity of ADC values. In vivo brain data from two healthy volunteers were measured at two b-values – 53 and 1,670 s/mm2 – corresponding to gradient amplitudes of 6.5 and 37 mT/m, respectively, with 4 and 8 averages for the low and high b-values, respectively, leading to a total scan time of 24 minutes. All data was quantified using LC Model, and peak volumes with CRLB’s ≤ 30% considered for ADC calculation.Results
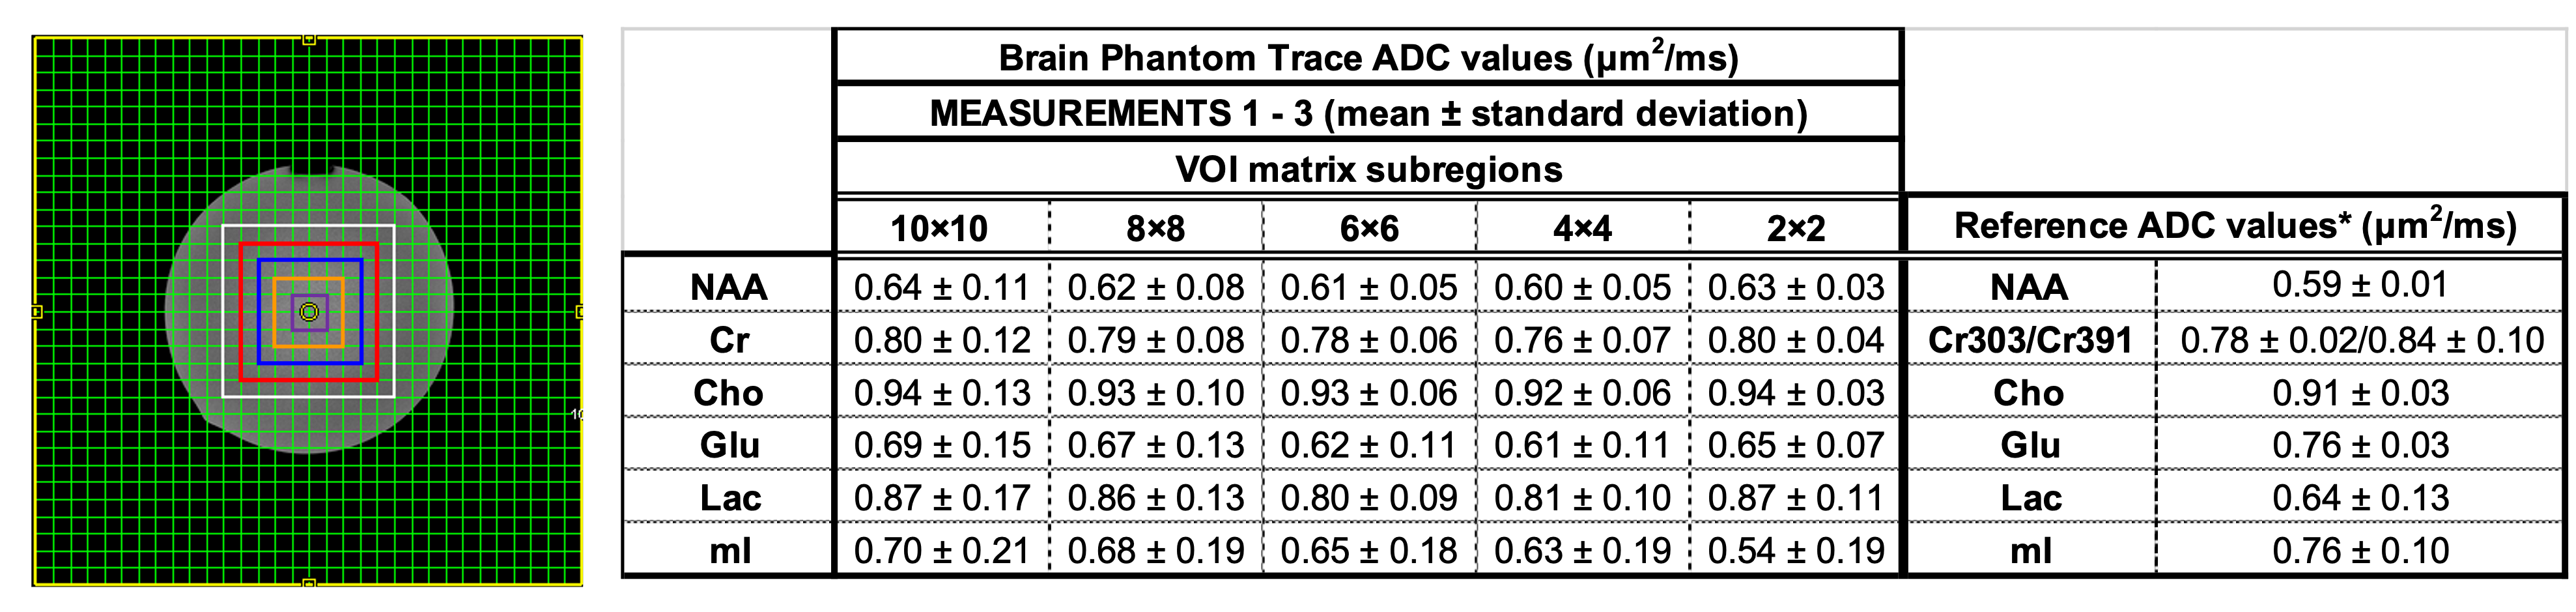
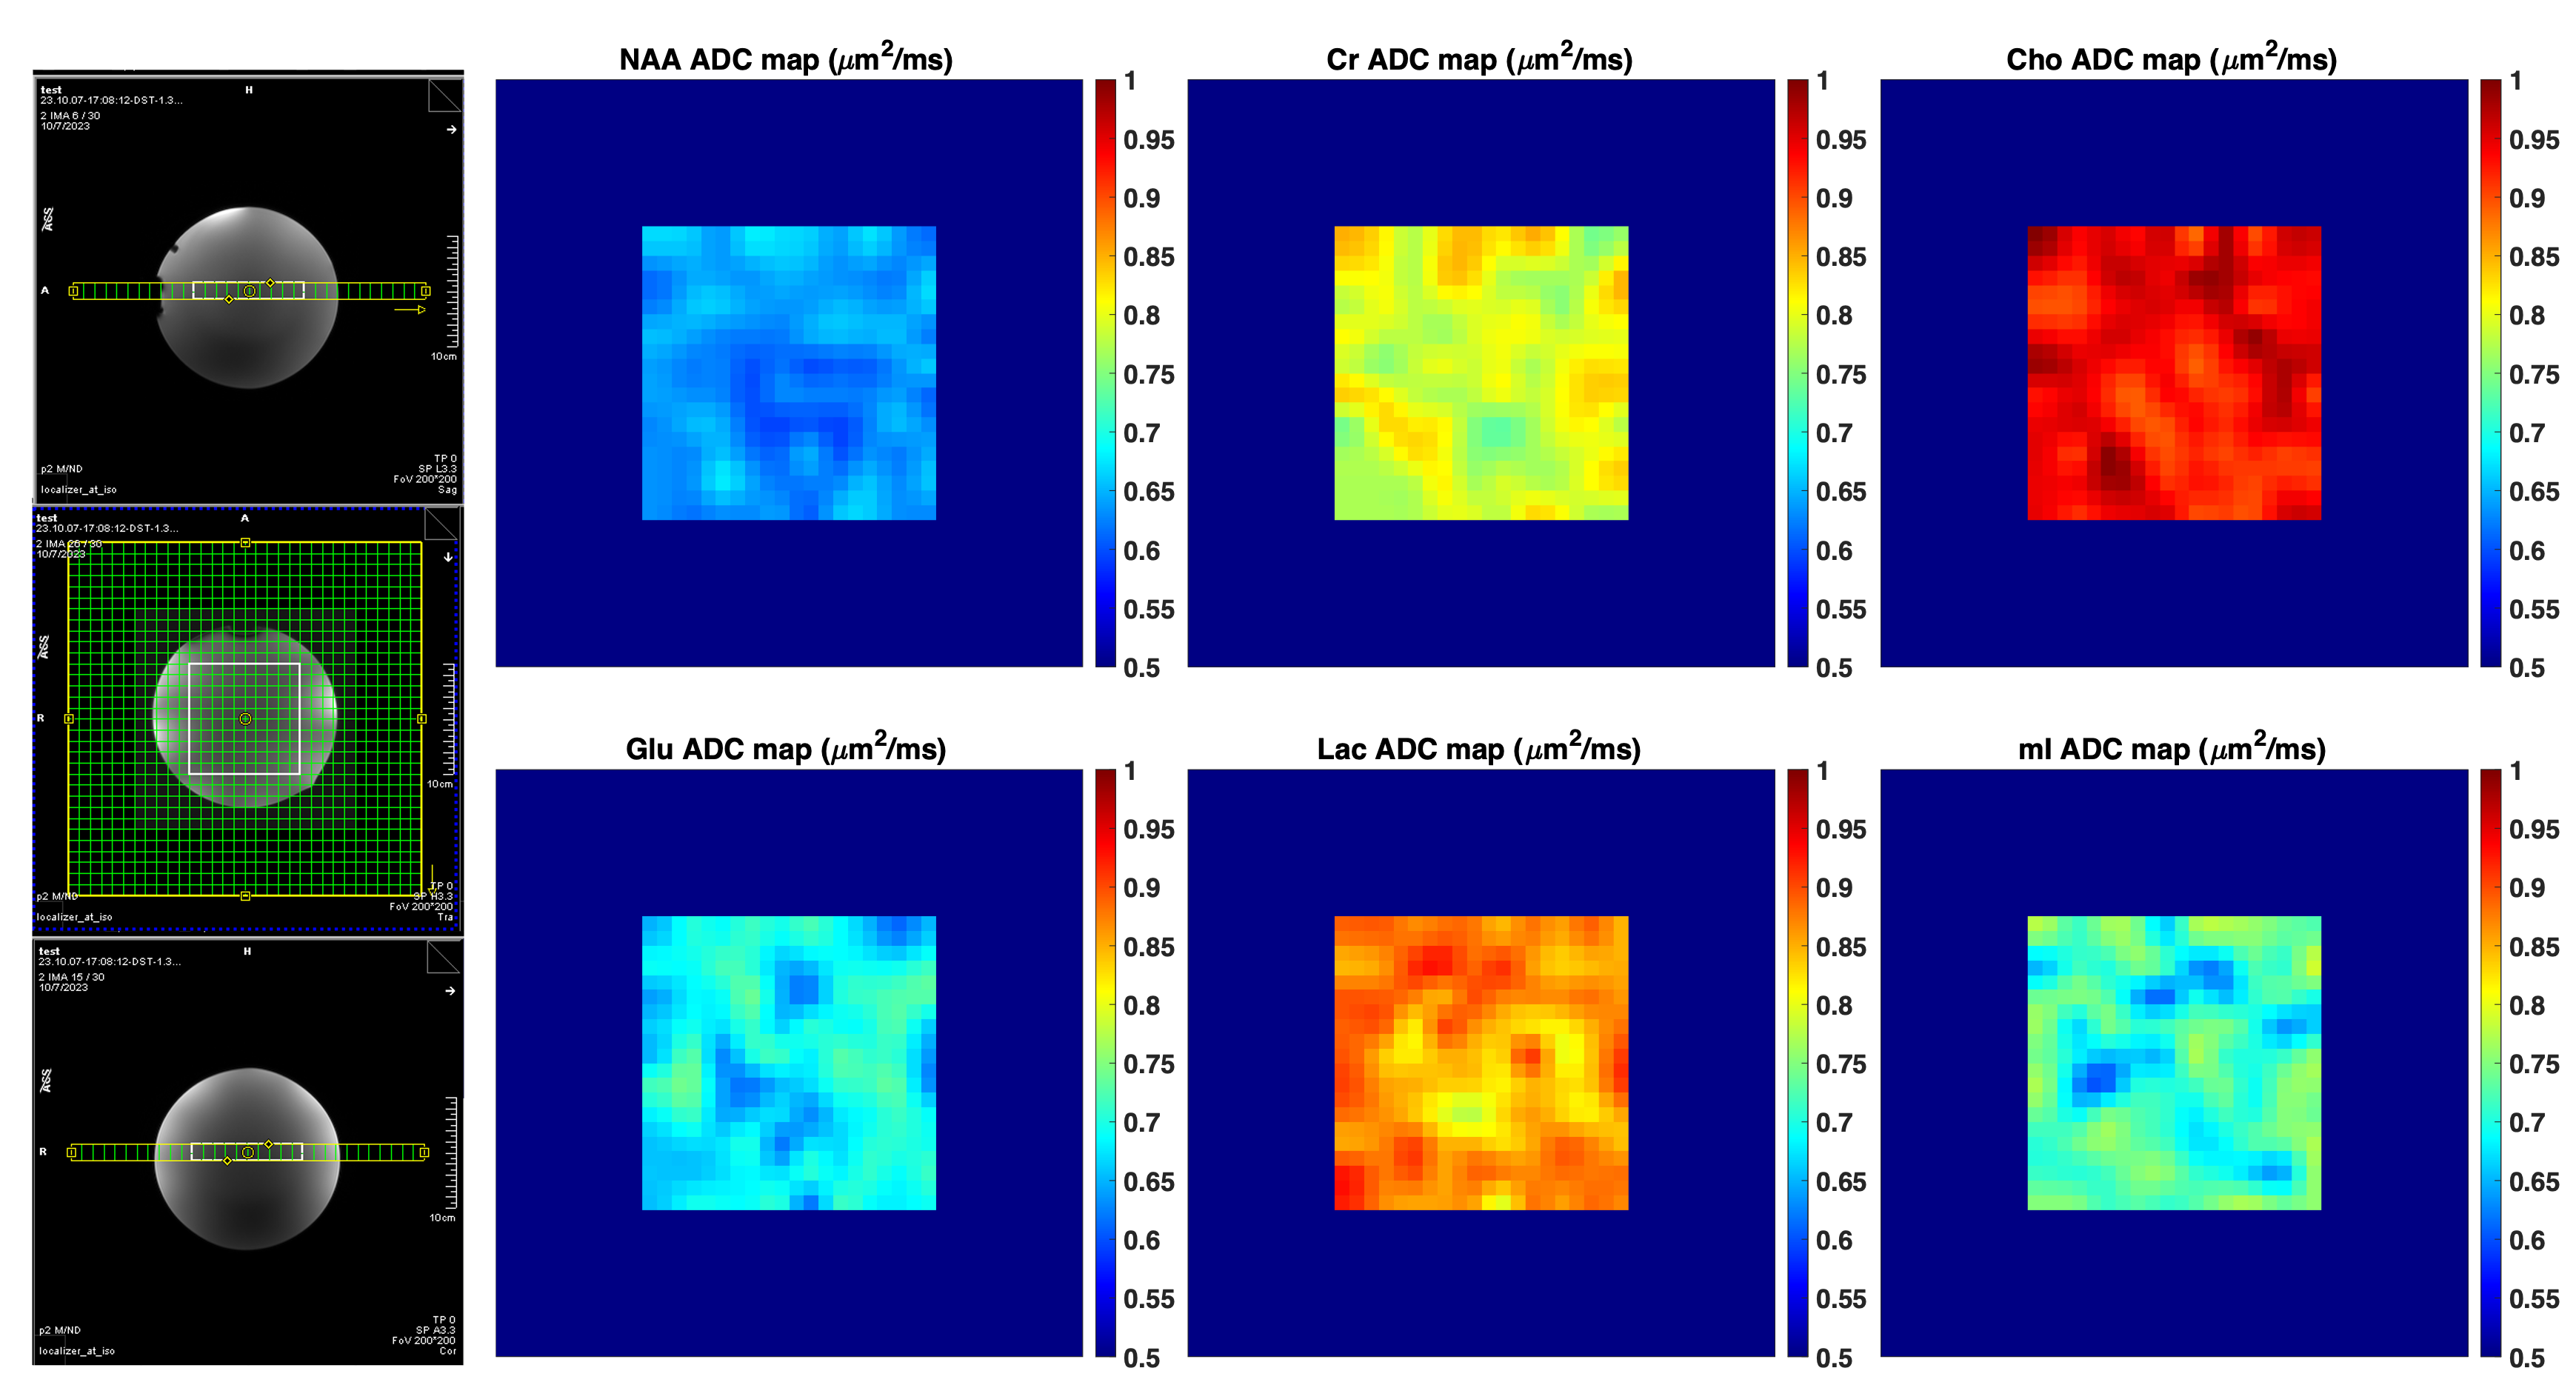
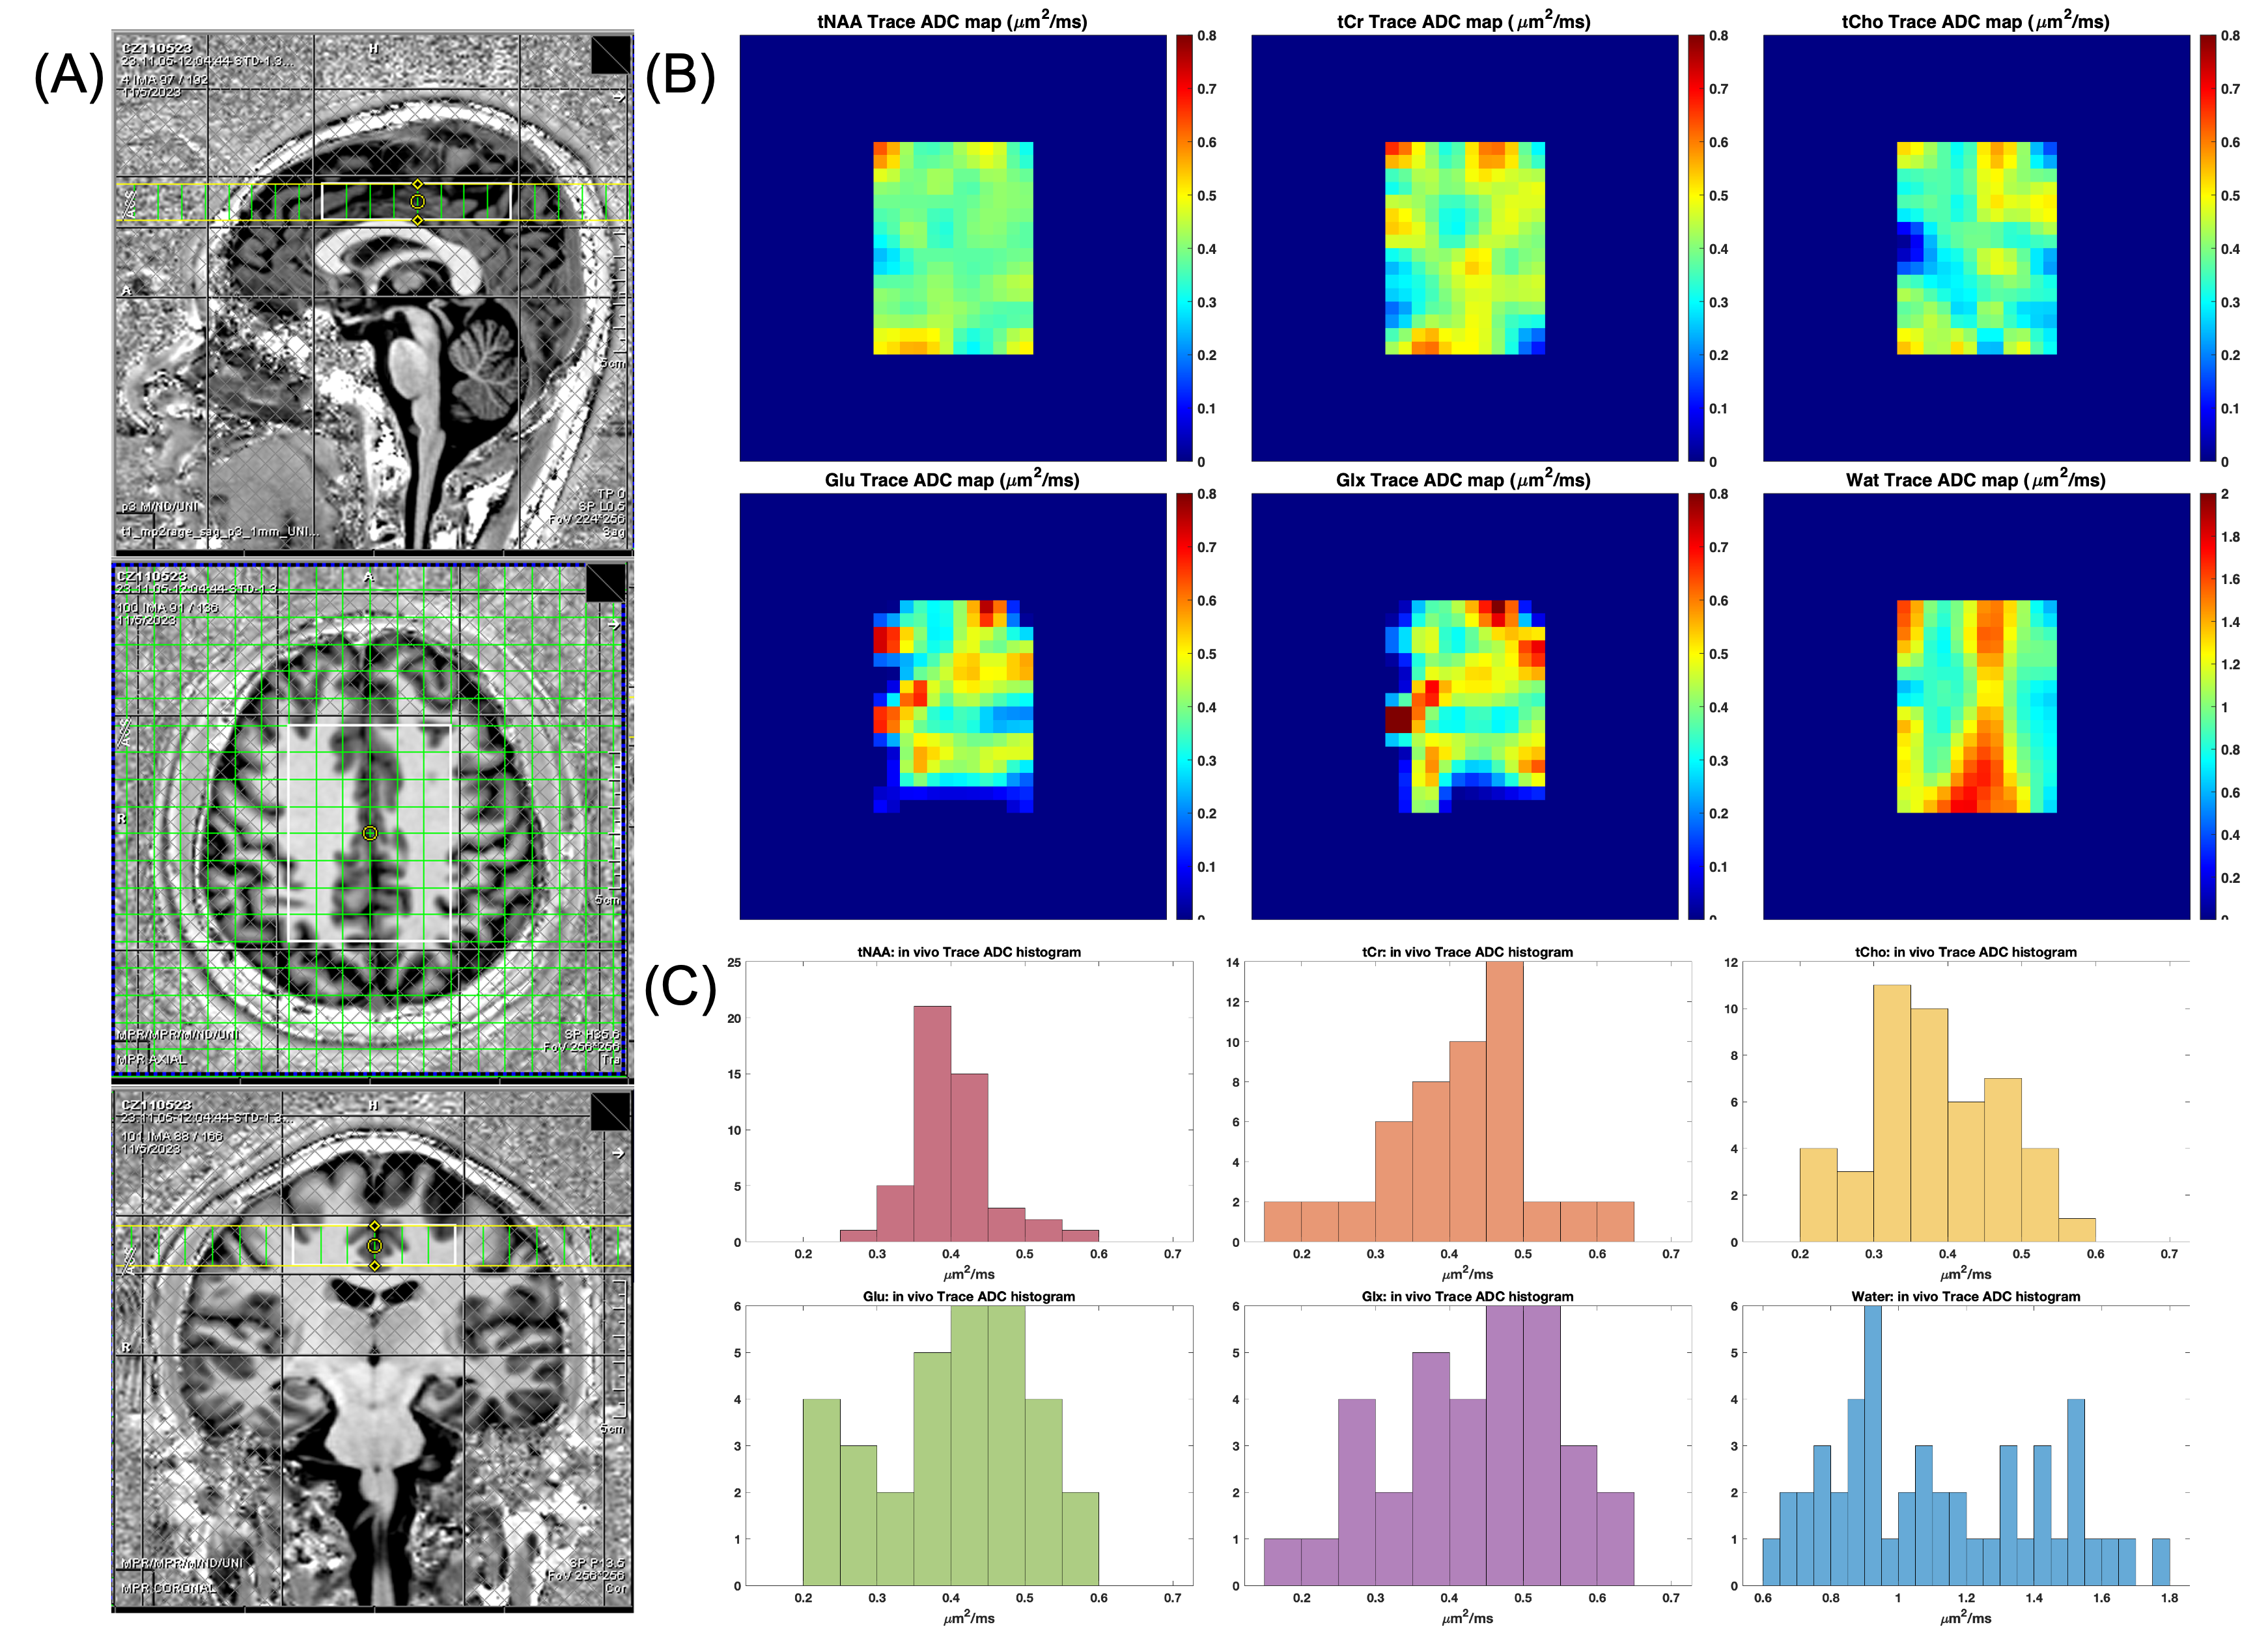
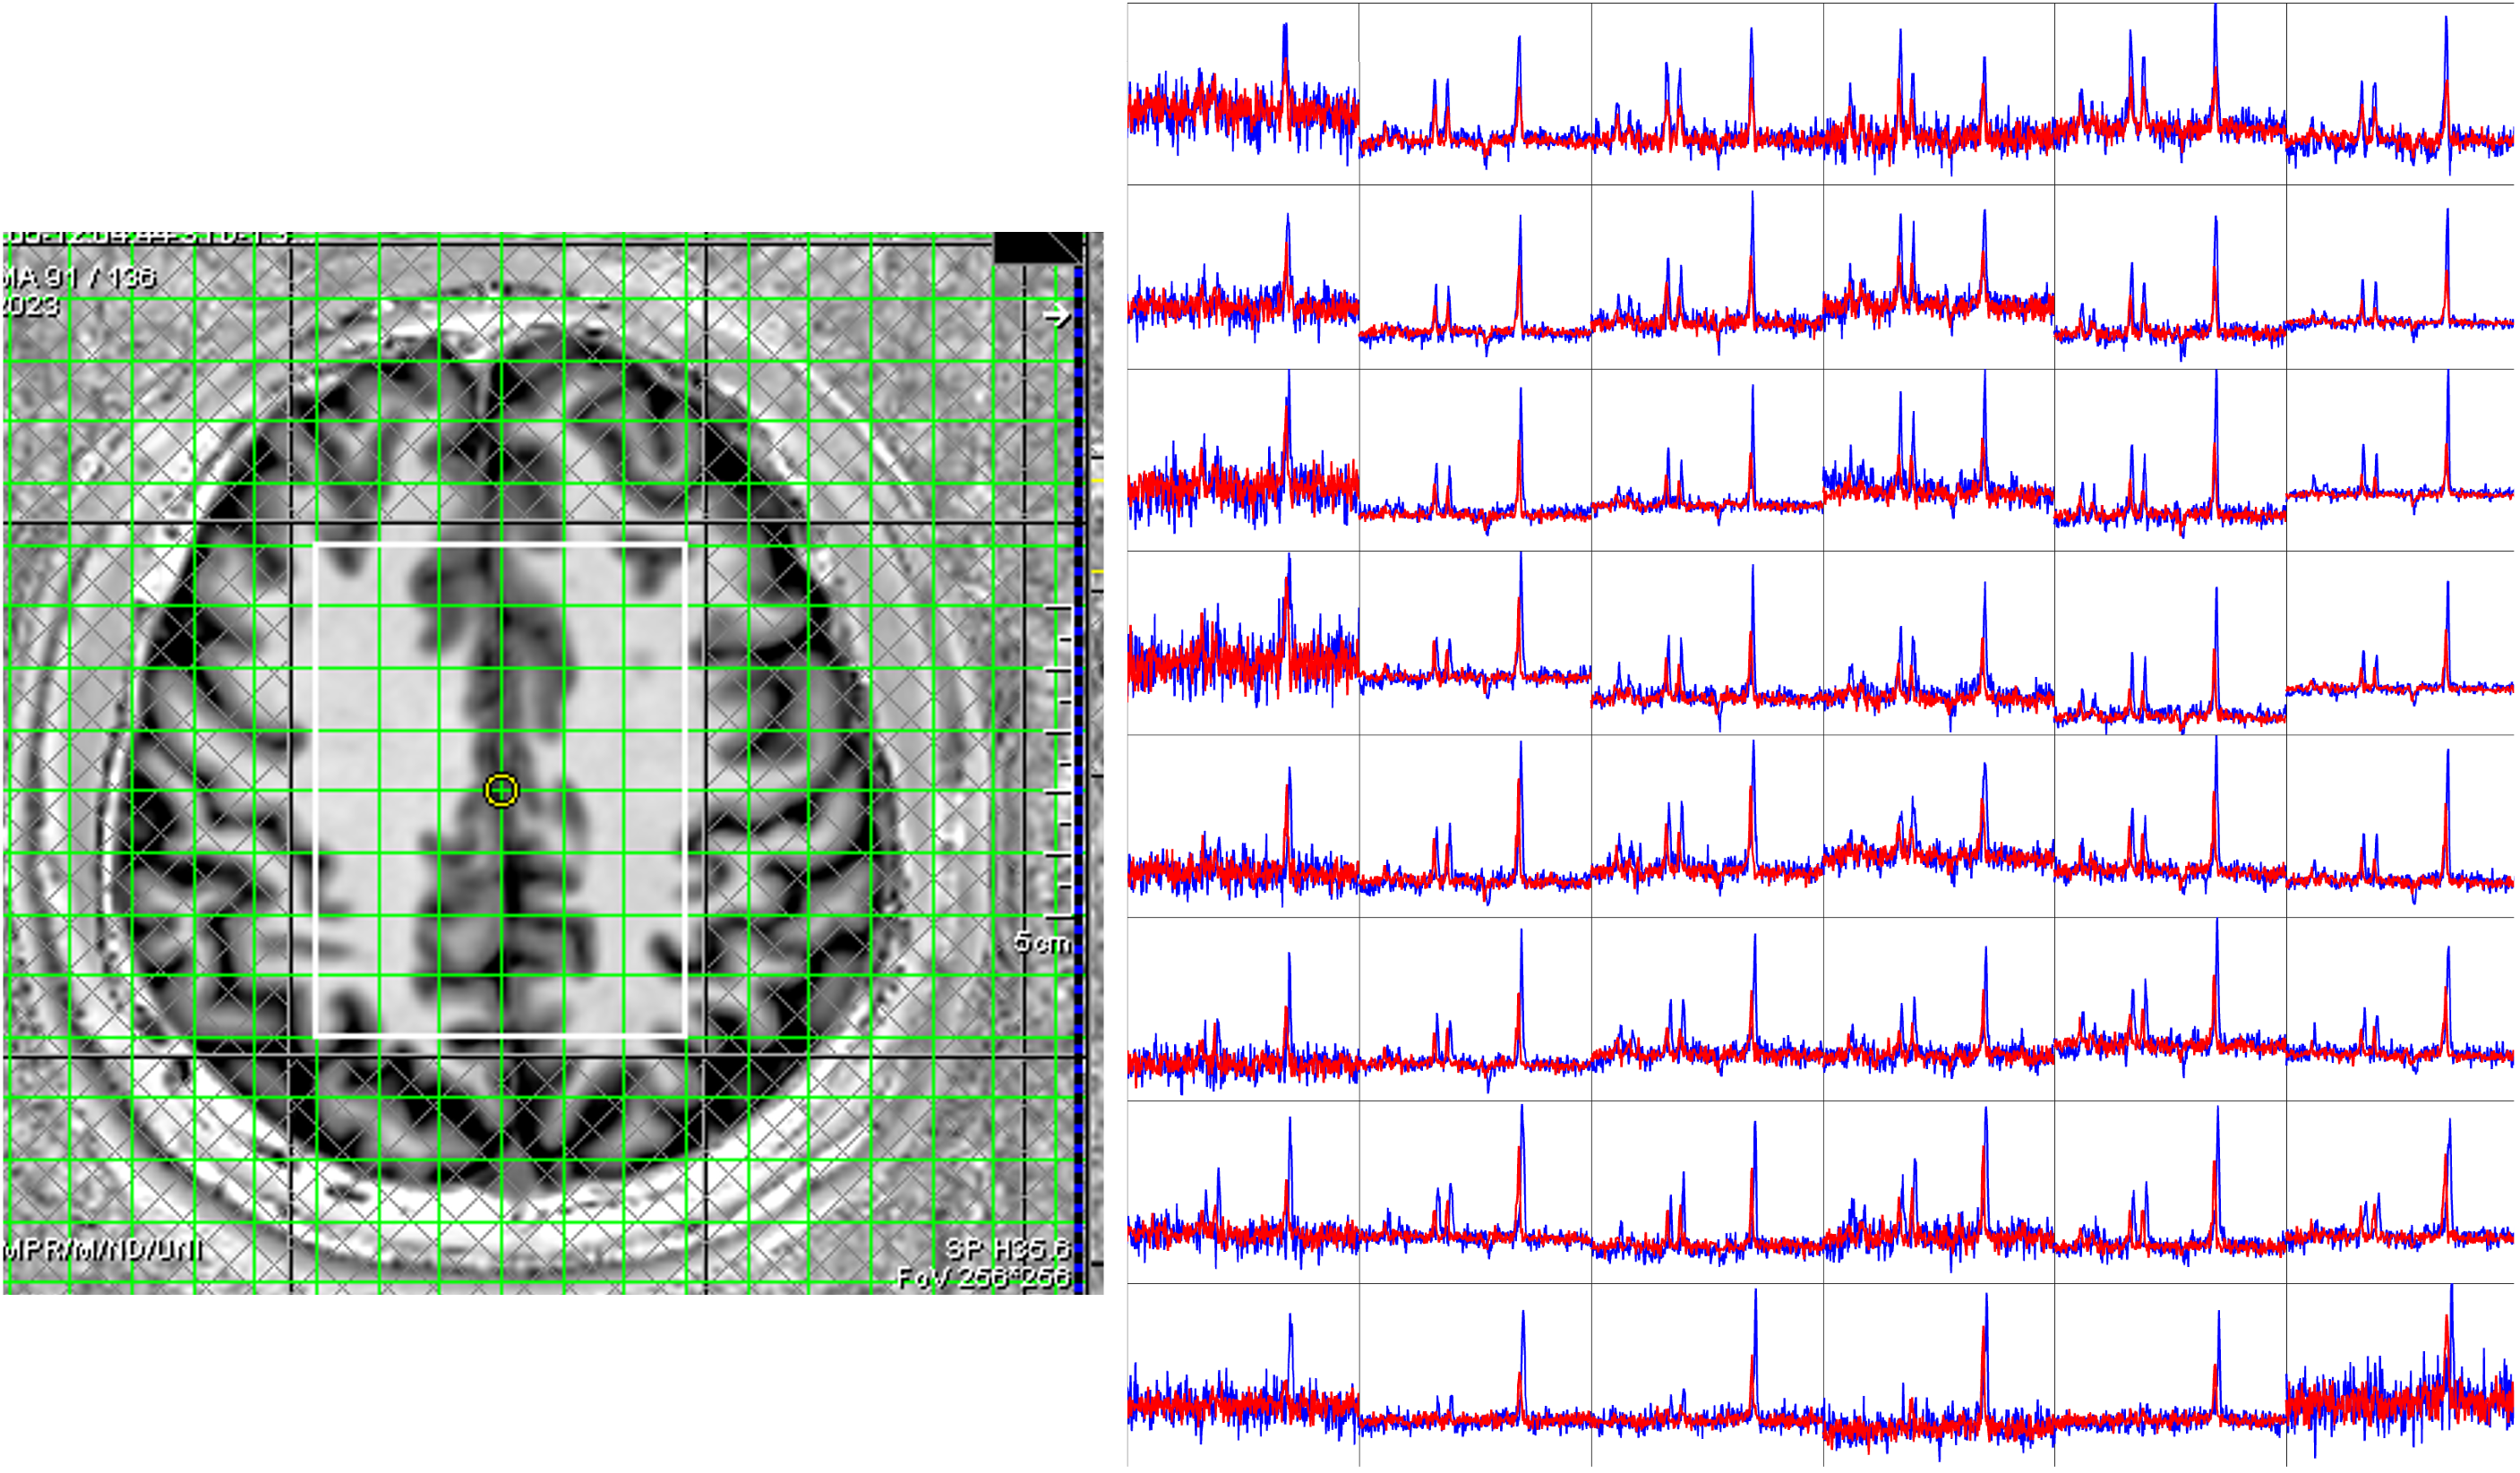
The trace ADC values computed from single shot trace DW-REPSI phantom acquisitions agree well with reference values (Table 1). Trace ADC maps of all six metabolites (Figure 2) show fairly homogenous values for NAA, Cr, and Cho across the VOI, although there are small fluctuations which can be attributed to B0 and B1 inhomogeneity and chemical shift displacement. The trace ADC values for mI, Glu, and Lac in the phantom have larger standard deviations, although the mean values for mI and Glu are within range of the reference values. Due to the long TE, only total Cr, total NAA, and total Cho were able to be reliably estimated in the in vivo data. Figure 3 shows trace ADC maps of these three metabolites as well as Glu, Glx (Glu+Glutamine) and water in one healthy volunteer. Possibly due to the relatively short diffusion time of 30.8ms, the measured trace ADCs are slightly higher than those determined with longer diffusion times. Figure 4 displays diffusion-weighted spectra within the entire VOI.Discussion & Conclusion
The main limitations of single-shot DW-REPSI are: (1) the long TE necessary for interleaving diffusion gradients with semi-LASER localization, which could limit the number of reliably detectable metabolites even at 7T, and (2) the large gradient amplitudes necessary to achieve sufficient diffusion-weighting but which induce stronger eddy current effects and greater hardware demands. Preliminary results show good agreement in the estimated phantom ADC values, while the in vivo trace ADCs are generally within the expected range although the values tend to be slightly higher than previously reported.Acknowledgements
No acknowledgement found.References
1. Ercan AE, Techawiboonwong A, Versluis MJ, Webb AG. Diffusion-Weighted Chemical Shift Imaging of Human Brain Metabolites at 7T. Magn Reson Med. 2015; 73(6):2053-2061.
2. Bito Y, Hirata K, Ebisu T, et al. Diffusion-weighted Line-scan Echo-planar Spectroscopic Imaging Technique to Reduce Motion Artifacts in Metabolite Diffusion Imaging. Magn Reson Med Sci. 2015; 14(1): 43-50.
3. Fotso K, Dager SR, Landow A, et al. Diffusion Tensor Spectroscopic Imaging of the Human Brain in Children and Adults. Magn Reson Med. 2017; 78(4):1246-1256.
4. Deelchand DK, Auerback EJ, Marjanska M. Apparent Diffusion Coefficients of the Five Major Metabolites Measured in the Human Brain In Vivo at 3T. Magn Reson Med. 2018; 79(6):2896-2901.
5. Ellegood J, Hanstock CC, Beaulieu C. Trace Apparent Diffusion Coefficients of Metabolites in Human Brain Using Diffusion Weighted Magnetic Resonance Spectroscopy. Magn Reson Med. 2005; 53(5):1025-1032.
6. Posse S, Cuenod CA, Le Bihan D. Human Brain: Proton Diffusion MR Spectroscopy. Radiology. 1993; 188(3):719-725.
7. Posse S, Cuenod CA, Le Bihan D. Motion Artifact Compensation in 1H Spectroscopic Imaging by Signal Tracking. Journal of Magnetic Resonance, Series B. 1993; 102:222-227.
8. Boer VO, Ronen I, Pedersen JO, Petersen ET, Lundell H. Metabolite diffusion weighted imaging with golden angle radial echo planar spectroscopic imaging. In Proceedings of the 27th Annual Meeting of ISMRM, Montreal, Canada, 2019. p. 3616.
9. Kim D, Adalsteinsson E, Spielman DM. Spiral Readout Gradients for the Reduction of Motion Artifacts in Chemical Shift Imaging. Magn Reson Med. 2004; 51(3):458-463.
10. de Graaf R, Braun KPJ, Nicolay K. Single Shot Diffusion Trace 1H NMR Spectroscopy. Magn Reson Med. 2001; 45(5):741-748.
11. Valette J, Giraudeau C, Marchadour C, et al. A New Sequence for Single-Shot Diffusion-Weighted NMR Spectroscopy by the Trace of the Diffusion Tensor. Magn Reson Med. 2012; 68(6):1705-1712.
12. Chun T, Ulug, AM, van Zigl PCM. Single-Shot Diffusion-Weighted Trace Imaging on a Clinical Scanner. Magn Reson Med. 1998; 40(4):622-628.
14. Wong EC, Cox RW, Song AW. Optimized Isotropic Diffusion Weighting. Magn Reson Med. 1995; 34(2):139-143.
15. Najac C, Lundel H, Kan HE, et al. Single-shot isotropic diffusion-weighted NMR spectroscopy in the human brain at 7T using tetrahedral encoding. Proceedings of the 2020 ISMRM & SMRT Conference and Exhibition: Abstract 0739.
16. Coello E, Noeske R, Burns BL, et al. High-resolution echo-planar spectroscopic imaging at ultra-high field. NMR in Biomedicine (2018); 31(11):e3950.
17. Landheer K, Schulte R, Geraghty B, et al. Diffusion-weighted J-resolved Spectroscopy. Magn Reson Med. 2017; 78(4):1235-1245.
Figures