2418
Improving Oscillating Gradient Spin Echo based Time-Dependent Diffusion Imaging with Deep Learning-based Reconstruction: A Feasibility Study1GE HealthCare MR Research, Beijing, China, 2Department of Radiology, Sun Yat-sen University Cancer Center, Guangzhou, China
Synopsis
Keywords: Microstructure, Microstructure, Time-dependent diffusion imaging; Oscillating gradient spin echo; Deep learning-based reconstruction
Motivation: Time-dependent diffusion MRI (td-dMRI) using oscillating gradient spin echo (OGSE) sequences is limited by low signal-to-noise ratio (SNR) and image quality.
Goal(s): To investigate the potential of combining OGSE sequences with deep learning-based reconstruction (DLR) to enhance image quality and precision of quantitative results in td-dMRI.
Approach: The OGSE-based td-dMRI images were reconstructed using both conventional method and DLR. The image SNR and quality, the precision of quantitative metrics and cellular-level microstructure maps without and with DLR were compared.
Results: DLR improved the SNR of images and ADC maps, eliminated Gibbs-ringing artifacts, and reduced singular values and outliers in cellular-level microstructure maps.
Impact: The combination of OGSE sequences with DLR shows promise in enhancing the image quality and quantification accuracy of td-dMRI. It may increase the feasibility and acceptance of the clinical application of OGSE-based td-dMRI.
Introduction
Time-dependent diffusion MRI (td-dMRI) based on dMRI signals acquired at varying diffusion time, especially short diffusion time provided by oscillating gradient spin echo (OGSE) sequence, has emerged as a valuable tool for probing cellular-level microstructure1. Several previous studies have accomplished cellular-level microstructure mapping of different anatomical region utilizing OGSE sequence on clinical 3T scanners2-5. However, due to the limited gradient performance of clinical scanner, the echo time (TE) of these studies were all longer than 100 ms, resulting in suboptimal signal-to-noise ratio (SNR) and image quality. Low SNR will significantly reduce the reliability of td-dMRI6 and hinder its further clinical application. On the other hand, AIRTM recon DL, a novel deep learning-based reconstruction (DLR) method, has been demonstrated to be beneficial for dMRI by improving image SNR and sharpness, and reducing Gibbs-ringing artifacts7-11. This study aims to combine OGSE sequence with DLR to improve the image quality and the precision of quantitative results in td-dMRI.Methods
Image acquisition & reconstruction Eight patients diagnosed with different tumors (1 with cerebellar neoplasms, 5 with breast cancer and 2 with cervical cancer) were recruited and scanned on a 3T MRI scanner (SIGNATM Premier, GE Healthcare, Waukesha, WI) after obtaining written informed consent. Each scan contained three different dMRI sequences: two OGSE sequences with different number of OGSE cycles (N=1 and N=2, respectively) and a conventional pulse-gradient spin-echo (PGSE) sequence. The detailed scan parameters of these sequences were listed in Table 1. Additionally, an EPI sequence with similar scan parameters with PGSE but opposite phase-encoding direction for geometric distortion correction, and a contrast-enhanced T1-weighted (T1+C) sequence as the anatomical structure reference, were also scanned for each patient. All dMRI raw data were reconstructed twice using conventional and DL-based reconstruction (Gibbs-ringing removal and 75% denoising) based on the built-in algorithms. Therefore, for each subject, two dMRI datasets (without and with DLR) were collected and each dataset contained images from three sequences (OGSE N=1, OGSE N=2 and PGSE).Data post-processing All dMRI images were firstly pre-processed (including image registration, geometric distortion correction and eddy-current induced distortion correction) and routinely post-processed (measuring quantitative metrics such as apparent diffusion coefficient (ADC) and fractional anisotropy (FA)) using FSL12 and MRtrix313. Subsequently, each dMRI dataset was fitted to the imaging microstructural parameters using limited spectrally edited diffusion (IMPULSED) model2 to generate cellular-level microstructure maps of mean cell size (diameter), intracellular volume fraction (fin), extracellular diffusivity (Dex) and cellularity. This study employed two different fitting algorithms: the non-linear least square (NLLS) method and a Bayesian method. The latter was reported to provide improved accuracy and stability, which was concretely manifested in fewer singular values and outliers in the fitting results14. The fitting process was conducted using the procedure provided by Liu K et al4 with default fitting parameters.
Results
The effects of DLR on OGSE images and the derived quantitative metric maps were shown in Figure 1. It is obvious that the OGSE images and ADC maps with DLR has enhanced SNR. Besides, yellow arrowheads in Figure 1 pointed out that the Gibbs-ringing artifacts in ADC maps is mostly eliminated by DLR. Figure 2 revealed the effect of DLR on the precision of OGSE quantification. Multiple singular values or outliers (yellow arrowheads) were restored after applying DLR, resulting in ADC maps with smoother signal transition. For the cellular-level microstructure maps derived from IMPULSED model, Figure 3 manifested that DLR can improved the results (mostly in cellularity and Dex) generated by both the NLLS method (red arrowheads) and the Bayesian method (green arrowheads). The benefit of combining DLR with NLLS is more significant than that with Bayesian. For the diameter and fin, fitting without and with DLR showed equivalent performance, which possibly because the estimation of them was relatively insensitive to noise compared with cellularity and Dex.Discussion
In this work we investigated the use of deep learning-based reconstruction (AIRTM Recon DL) to improve the image quality and quantification accuracy of OGSE-based td-dMRI. The results demonstrated that DLR can improve the SNR of images and quantitative metric maps, remove the Gibbs-ringing artifacts and eliminate the singular values and outliers in cellular-level microstructure maps. These inferences need further validation by evaluating the performance of combining OGSE with DLR in more specific clinical application (e.g., tumorous grading and staging) or comparing the cellular-level results with golden standards such as stained pathological sections.Conclusion
In conclusion, combining OGSE with DLR can improve the image quality and quantification accuracy of td-dMRI, which may increase the feasibility and acceptance of the clinical application of td-dMRI.Acknowledgements
No acknowledgement found.References
[1] Xu J. Probing neural tissues at small scales: Recent progress of oscillating gradient spin echo (OGSE) neuroimaging in humans[J]. Journal of neuroscience methods, 2021, 349: 109024.
[2] Xu J, Jiang X, Li H, et al. Magnetic resonance imaging of mean cell size in human breast tumors[J]. Magnetic resonance in medicine, 2020, 83(6): 2002-2014.
[3] Wu D, Jiang K, Li H, et al. Time-dependent diffusion MRI for quantitative microstructural map of prostate cancer[J]. Radiology, 2022, 303(3): 578-587.
[4] Zhang H, Liu K, Ba R, et al. Histological and molecular classifications of pediatric glioma with time-dependent diffusion MRI-based microstructural map[J]. Neuro-oncology, 2023, 25(6): 1146-1156.
[5] Ba R, Wang X, Zhang Z, et al. Diffusion-time dependent diffusion MRI: effect of diffusion-time on microstructural map and prediction of prognostic features in breast cancer[J]. European Radiology, 2023: 1-12.
[6] Li H, Jiang X, Xie J, et al. Impact of transcytolemmal water exchange on estimates of tissue microstructural properties derived from diffusion MRI[J]. Magnetic resonance in medicine, 2017, 77(6): 2239-2249.
[7] Wang X, Ersoz A, Litwiller D, et al. Robust Diffusion-Weighted Imaging with Deep Learning-Based DW PROPELLER Reconstruction. Abstract No. 3919, ISMRM, London, 2022.
[8] Choi K S, Figee M, Lebel R M, et al. Evaluation of the efficacy of a Deep Learning-based Reconstruction in the Connectomic Deep Brain Stimulation. Abstract No. 3357, ISMRM, London, 2022.
[9] Wang X, Yang B, Label M R, et al. High-resolution Diffusion Tensor Imaging at 7T with Multi-band Multi-shot EPI acquisition and Deep Learning Reconstruction. Abstract No. 3966, ISMRM, London, 2022.
[10] Lee K L, Kessler D A, Dezonie S, et al. Assessment of deep learning-based reconstruction on T2-weighted and diffusion-weighted prostate MRI image quality[J]. European Journal of Radiology, 2023, 166: 111017.
[11] Xiong Y, Wei X, Dai J, et al, 8-minute Rapid Whole-brain Diffusion Spectral Imaging with Deep Learning-based Reconstruction: A Feasibility Study, Abstract No. 5189, ISMRM, Toronto, 2023.
[12] Jenkinson M, Beckmann C F, Behrens T E J, et al. Fsl[J]. Neuroimage, 2012, 62(2): 782-790.
[13] Tournier J D, Smith R, Raffelt D, et al. MRtrix3: A fast, flexible and open software framework for medical image processing and visualisation[J]. Neuroimage, 2019, 202: 116137.
[14] Liu K, Zheng T, Ba R, et al, Improving microstructural estimation in time-dependent diffusion MRI model with a Bayesian method, Abstract No. 4306, ISMRM, Toronto, 2023.
Figures
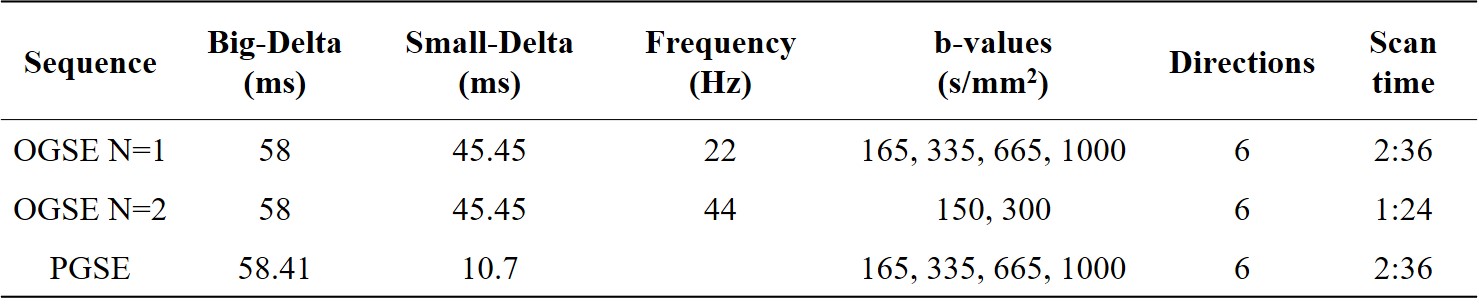
Table 1. Main scan parameters of three different dMRI sequences. Directions: number of diffusion-encoding directions for each b-value. Other common scan parameters not listed: TR/TE = 6000/121 ms, in-plane resolution = 2×2 mm2 in brain and 2.75×2.75 mm2 in other regions. 10 slices with no gap were collected, with slice thickness = 3 mm in brain and 5 mm in other regions.
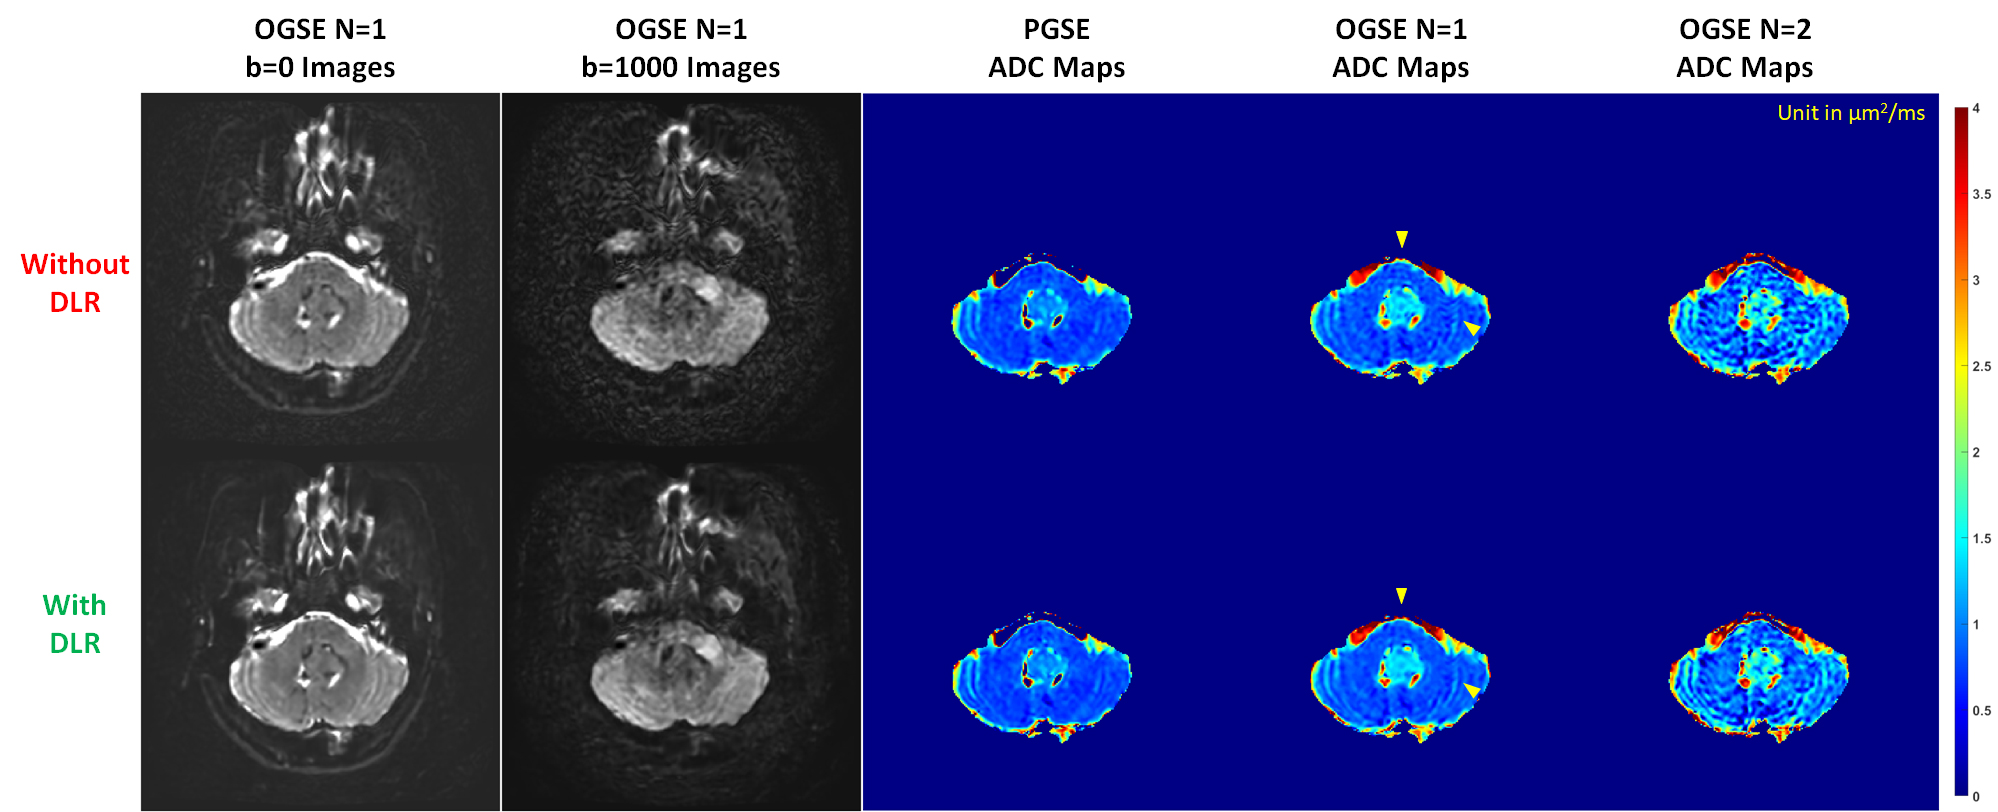
Figure 1. dMRI images (show OGSE N=1 only) of a patient with cerebellar neoplasms, and the corresponding ADC maps derived from different sequences. Upper row: images and maps without DLR; lower row: images and maps with DLR. Yellow arrowheads: Gibbs-ringing artifacts eliminated by DLR.
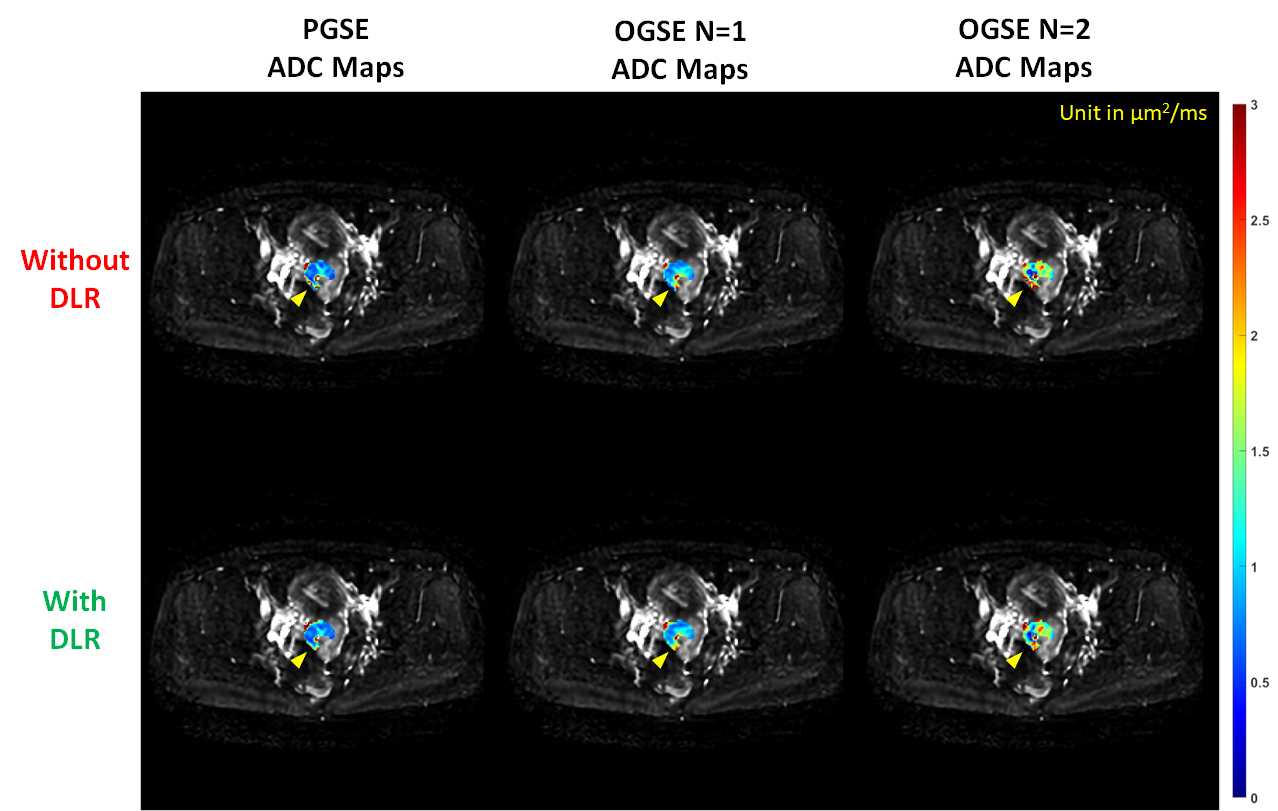
Figure 2. ADC maps (overlayed on PGSE b=0 images) derived from different dMRI sequences of a patient with cervical cancer. Upper row: images and maps without DLR; lower row: images and maps with DLR. Yellow arrowheads: singular values and outliers eliminated by DLR.
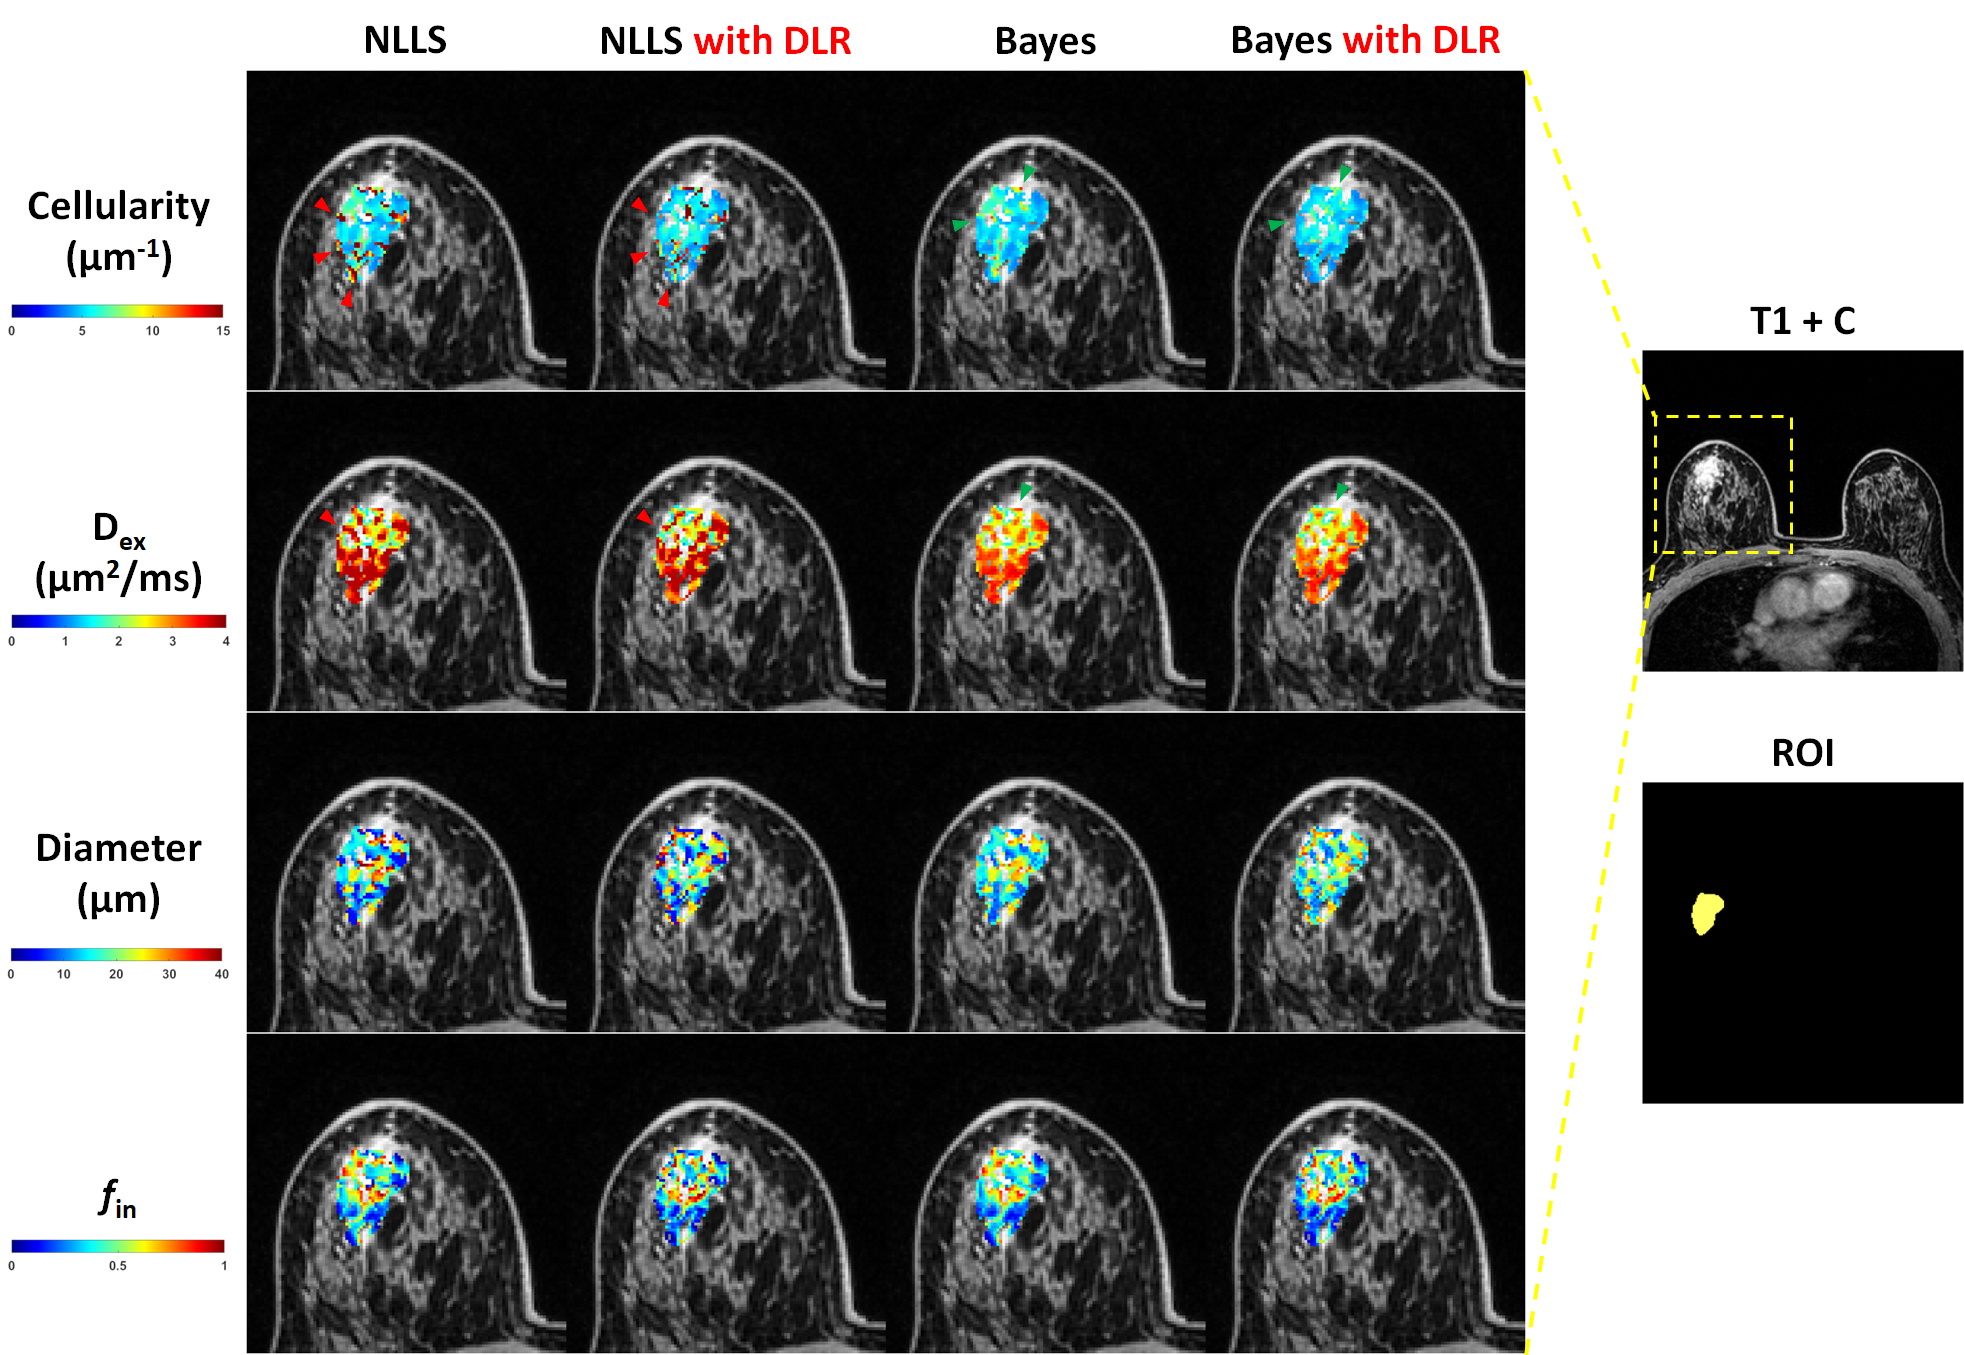
Figure 3. Cellular-level microstructure maps derived from IMPULSED model using different fitting algorithms. The yellow dotted block regions in T1+C images were magnified and shown in the left columns. NLLS: the non-linear least square method; Bayes: the Bayesian method; Dex: extracellular diffusivity; Diameter: mean cell size; fin: intracellular volume fraction. Red arrowheads: singular values and outliers eliminated by combining the NLLS method with DLR. Green arrowheads: singular values and outliers eliminated by combining the Bayesian method with DLR.