2412
Toward optimal fitting parameters for multi-exponential DWI analysis of the kidney: A simulation study comparing different fitting algorithms1Department of Diagnostic and Interventional Radiology, Düsseldorf University Hospital, Düsseldorf, Germany, 2Department of Haematology, Oncology and Clinical Immunology, Düsseldorf University Hospital, Düsseldorf, Germany
Synopsis
Keywords: Microstructure, Simulations
Motivation: The use of multi-exponential signal analysis is common practice to identify present diffusion components in diffusion-weighted MRI. Yet, the absence of appropriate acquisition parameters and standardised signal analysis methods hinders the attainment of accurate results, especially in renal imaging.
Goal(s): To assess the impact of fitting parameters and methods.
Approach: A simulation was conducted comparing non-negative (NNLS) and non-linear (NLLS) fitting methods, but also determining ideal parameters for accurate in-vivo appliance.
Results: The study showed superior accuracy when using the NNLS method in combination with area under curve (AUC) estimation and specified an optimized parameters set, improving clinical DWI examinations in kidneys.
Impact: By employing our results, it is expected that stable and reliable results can be achieved in multi-exponential analysis of in-vivo DWI data using both NNLS and NLLS approaches. This will enable enhanced evaluation of clinical DWI examinations in the kidney.
Introduction
In diffusion-weighted MRI (DWI) multi-exponential signal analysis of the diffusion signal is common practice. Multiple studies have shown, that especially in human kidney it is more precise than the currently used mono-exponential approach1,2. However, the field lacks a systematic quantitative comparison of the different approaches for renal DWI investigation. Therefore, this study aims to compare and optimise fitting approaches by fitting the parameters by non-negative (NNLS) and non-linear (NLLS) fitting methods with varied parameters using an extensive simulation. The results of this study should improve the accuracy and with that DWI examinations in the kidney. The multi-exponential diffusion signal can be stated as a superposition of signals originating from different diffusion components present in tissue3. Each component can further be described by two parameters, its diffusion coefficient d and the corresponding volume fraction f given in shares of the total volume. The increasingly used tri-exponential diffusion model extents the often-used biexponential model. It considers three diffusion compartments to be present in renal tissue, namely a fast (blood flow), an intermediate (tubular flow) and a slow (tissue) diffusion component.Methods
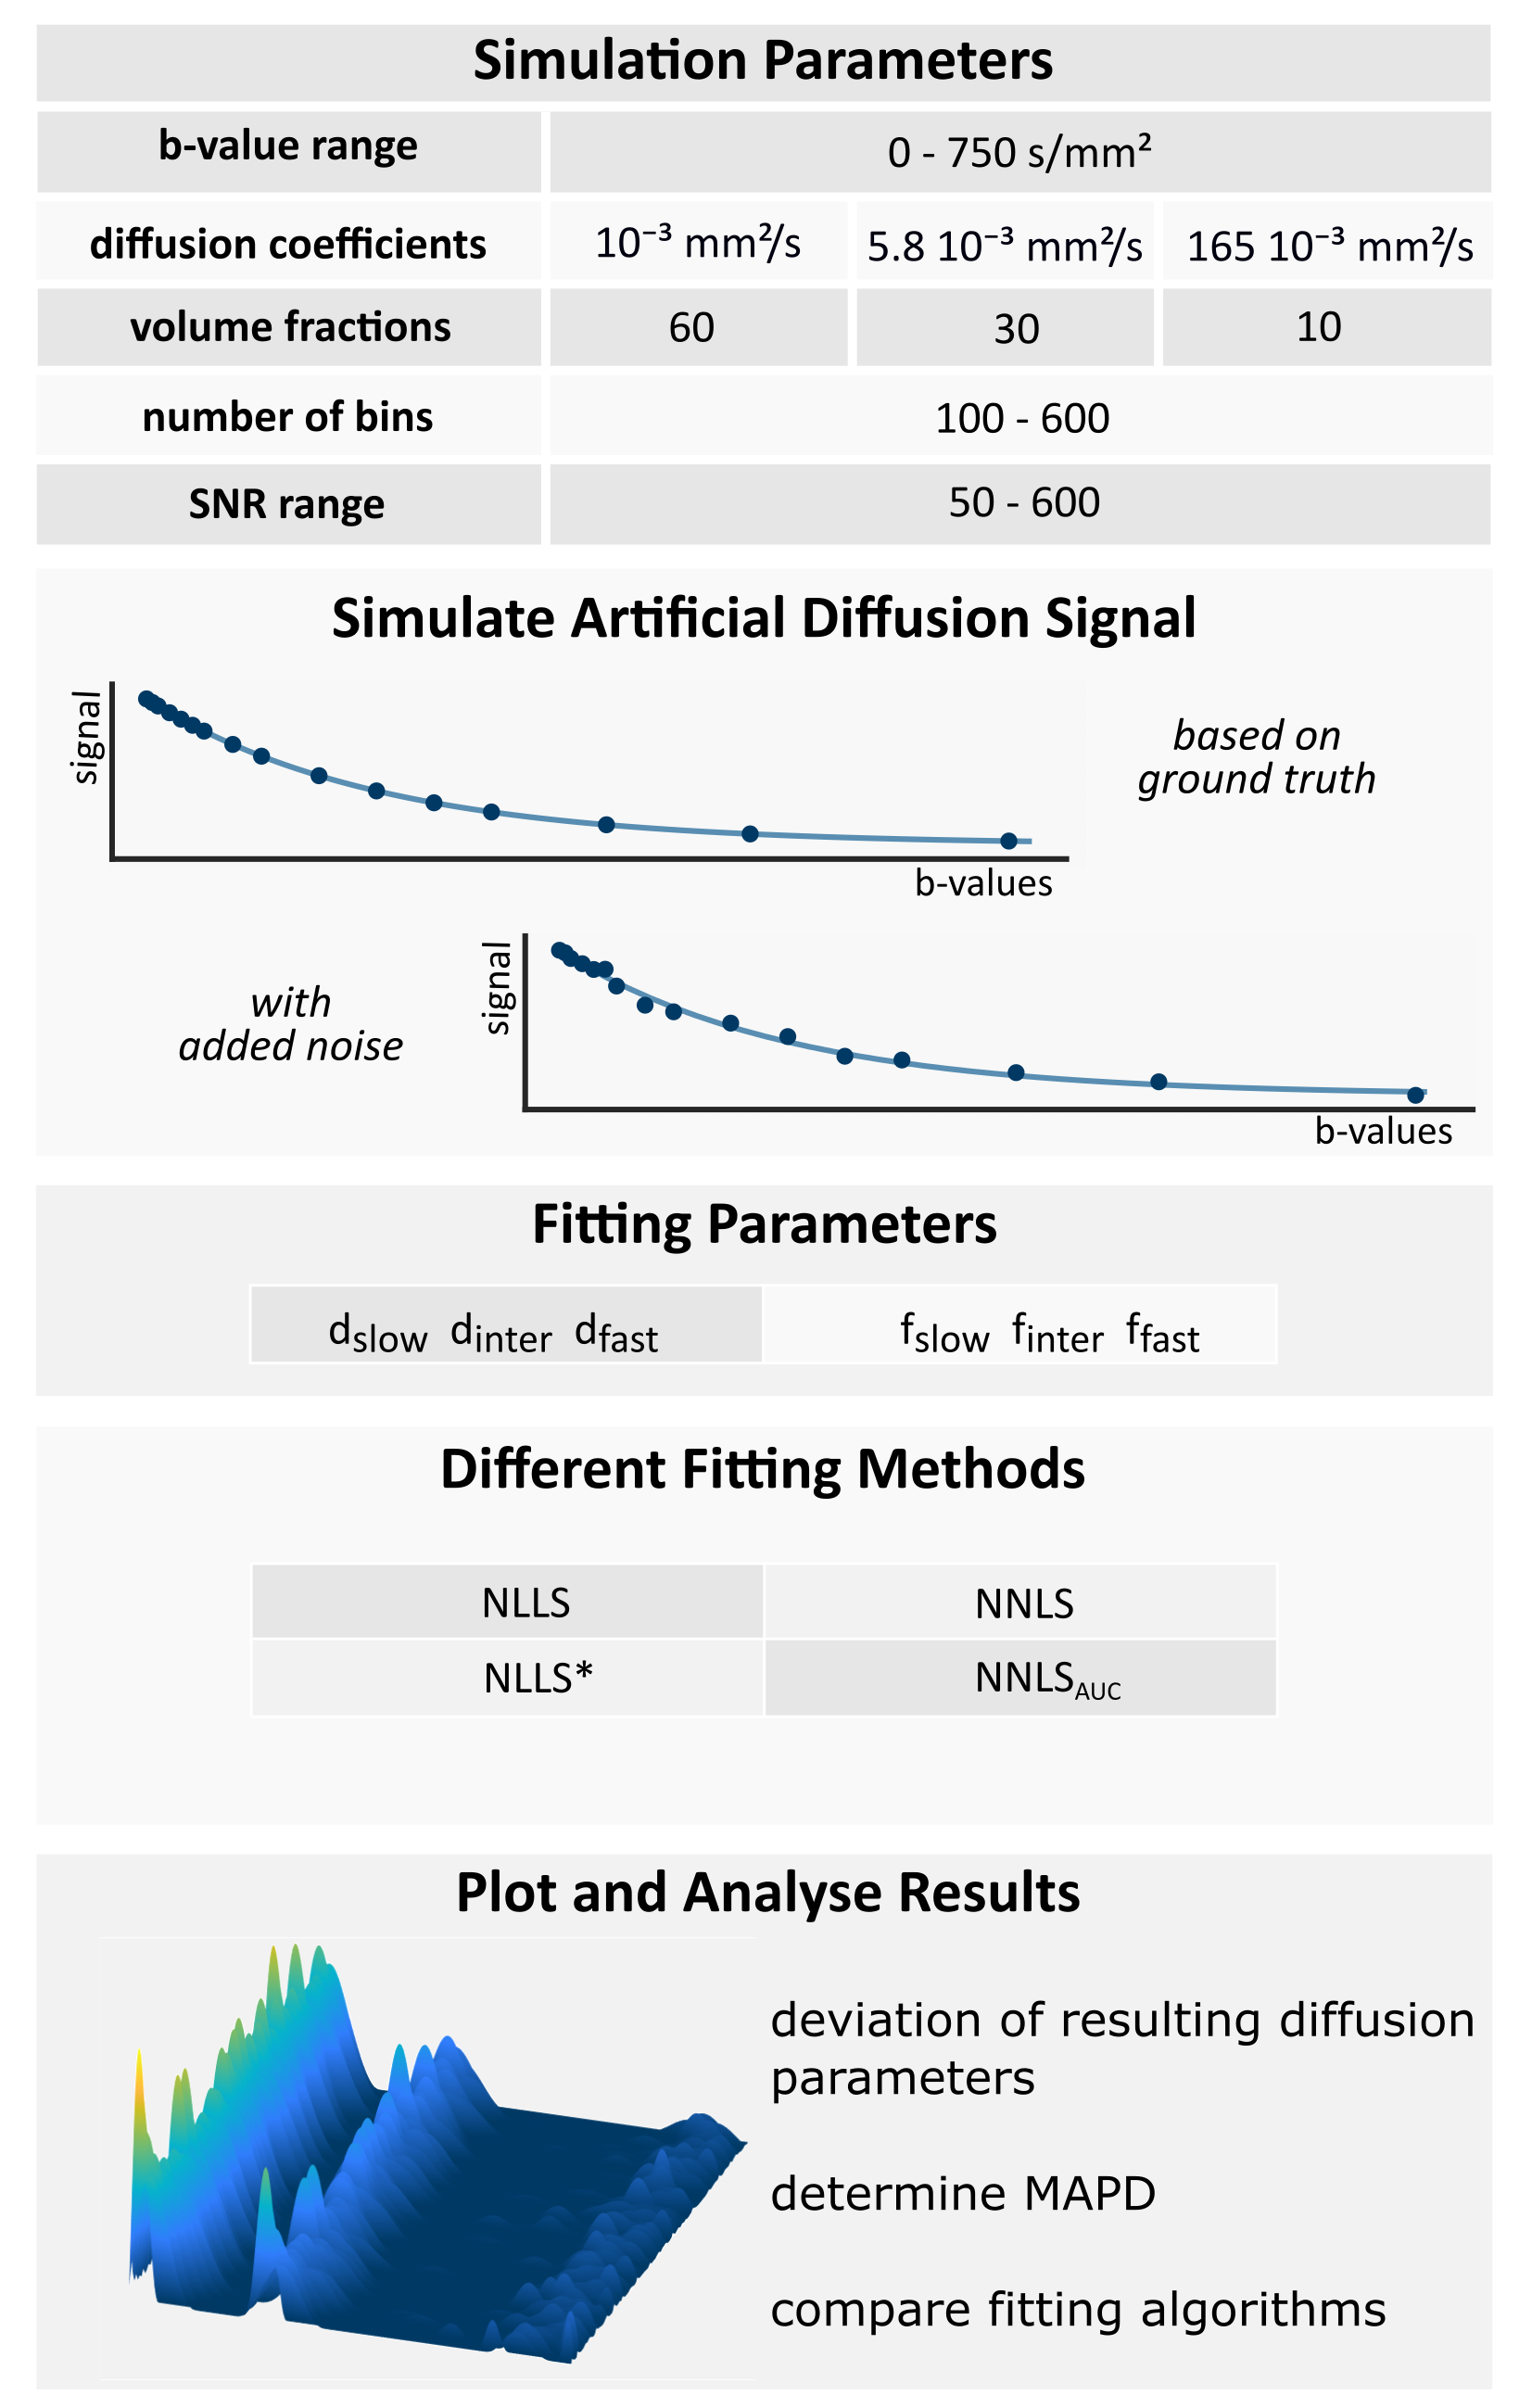
Synthetic multi-exponential diffusion data was created based on the physiological conditions of three compartments with ground truth values for d and f (10-3 mm²/s, 5.8*10-3 mm²/s, 165*10-3 mm²/s and 0.6, 0.3, 0.1, respectively) in agreement with current literature4,5. Subsequently noise was added to the diffusion signal with a variable signal-to-noise ratio (SNR). In accordance with literature4,6 and considering the clinical limitations of scan time, 16 b-values were chosen distributed between 0 and 750 s/mm². For fitting, the widely used NLLS algorithm was integrated into the simulation using the MATLAB (The Mathworks Inc., Natick, USA) function lsqnonlin. As it demands a priori information about the number of compartments, its use is limited. Especially in pathophysiological conditions, the number of diffusion compartments can vary4. Furthermore, we implemented the NNLS technique from Lawson and Hanson7 to compare it to the rigid NLLS fitting. For more stable results and a comparison to the basic NNLS algorithm the advanced regularisation method of NNLS has been used, which is part of the open-source image analysis software AnalyzeNNLS developed by Bjarnason et al.8 The NNLS algorithm does not require further specification of the underlying diffusion components a priori. Finally, both NNLS and NLLS were combined by using the NNLS results as starting values for the non-linear fitting method and thus carrying out a two-level analysis of the signal data (in the following referred to by NLLS*). In addition to the standard NNLS algorithm, we implemented an advanced version called NNLSAUC. It is based on the same fitting results and incorporates an AUC constraint post-fitting aiming to minimise noise effects. For parameter variations, main emphasis lay on altering values within a range relevant for routine examinations and feasible for research imaging experiments. Parameters that were varied include the SNR, the b-value range and composition, the number of logarithmically spaced diffusion coefficients and the diffusion fitting range of NNLS. The whole workflow process can be seen in Figure 1.Results
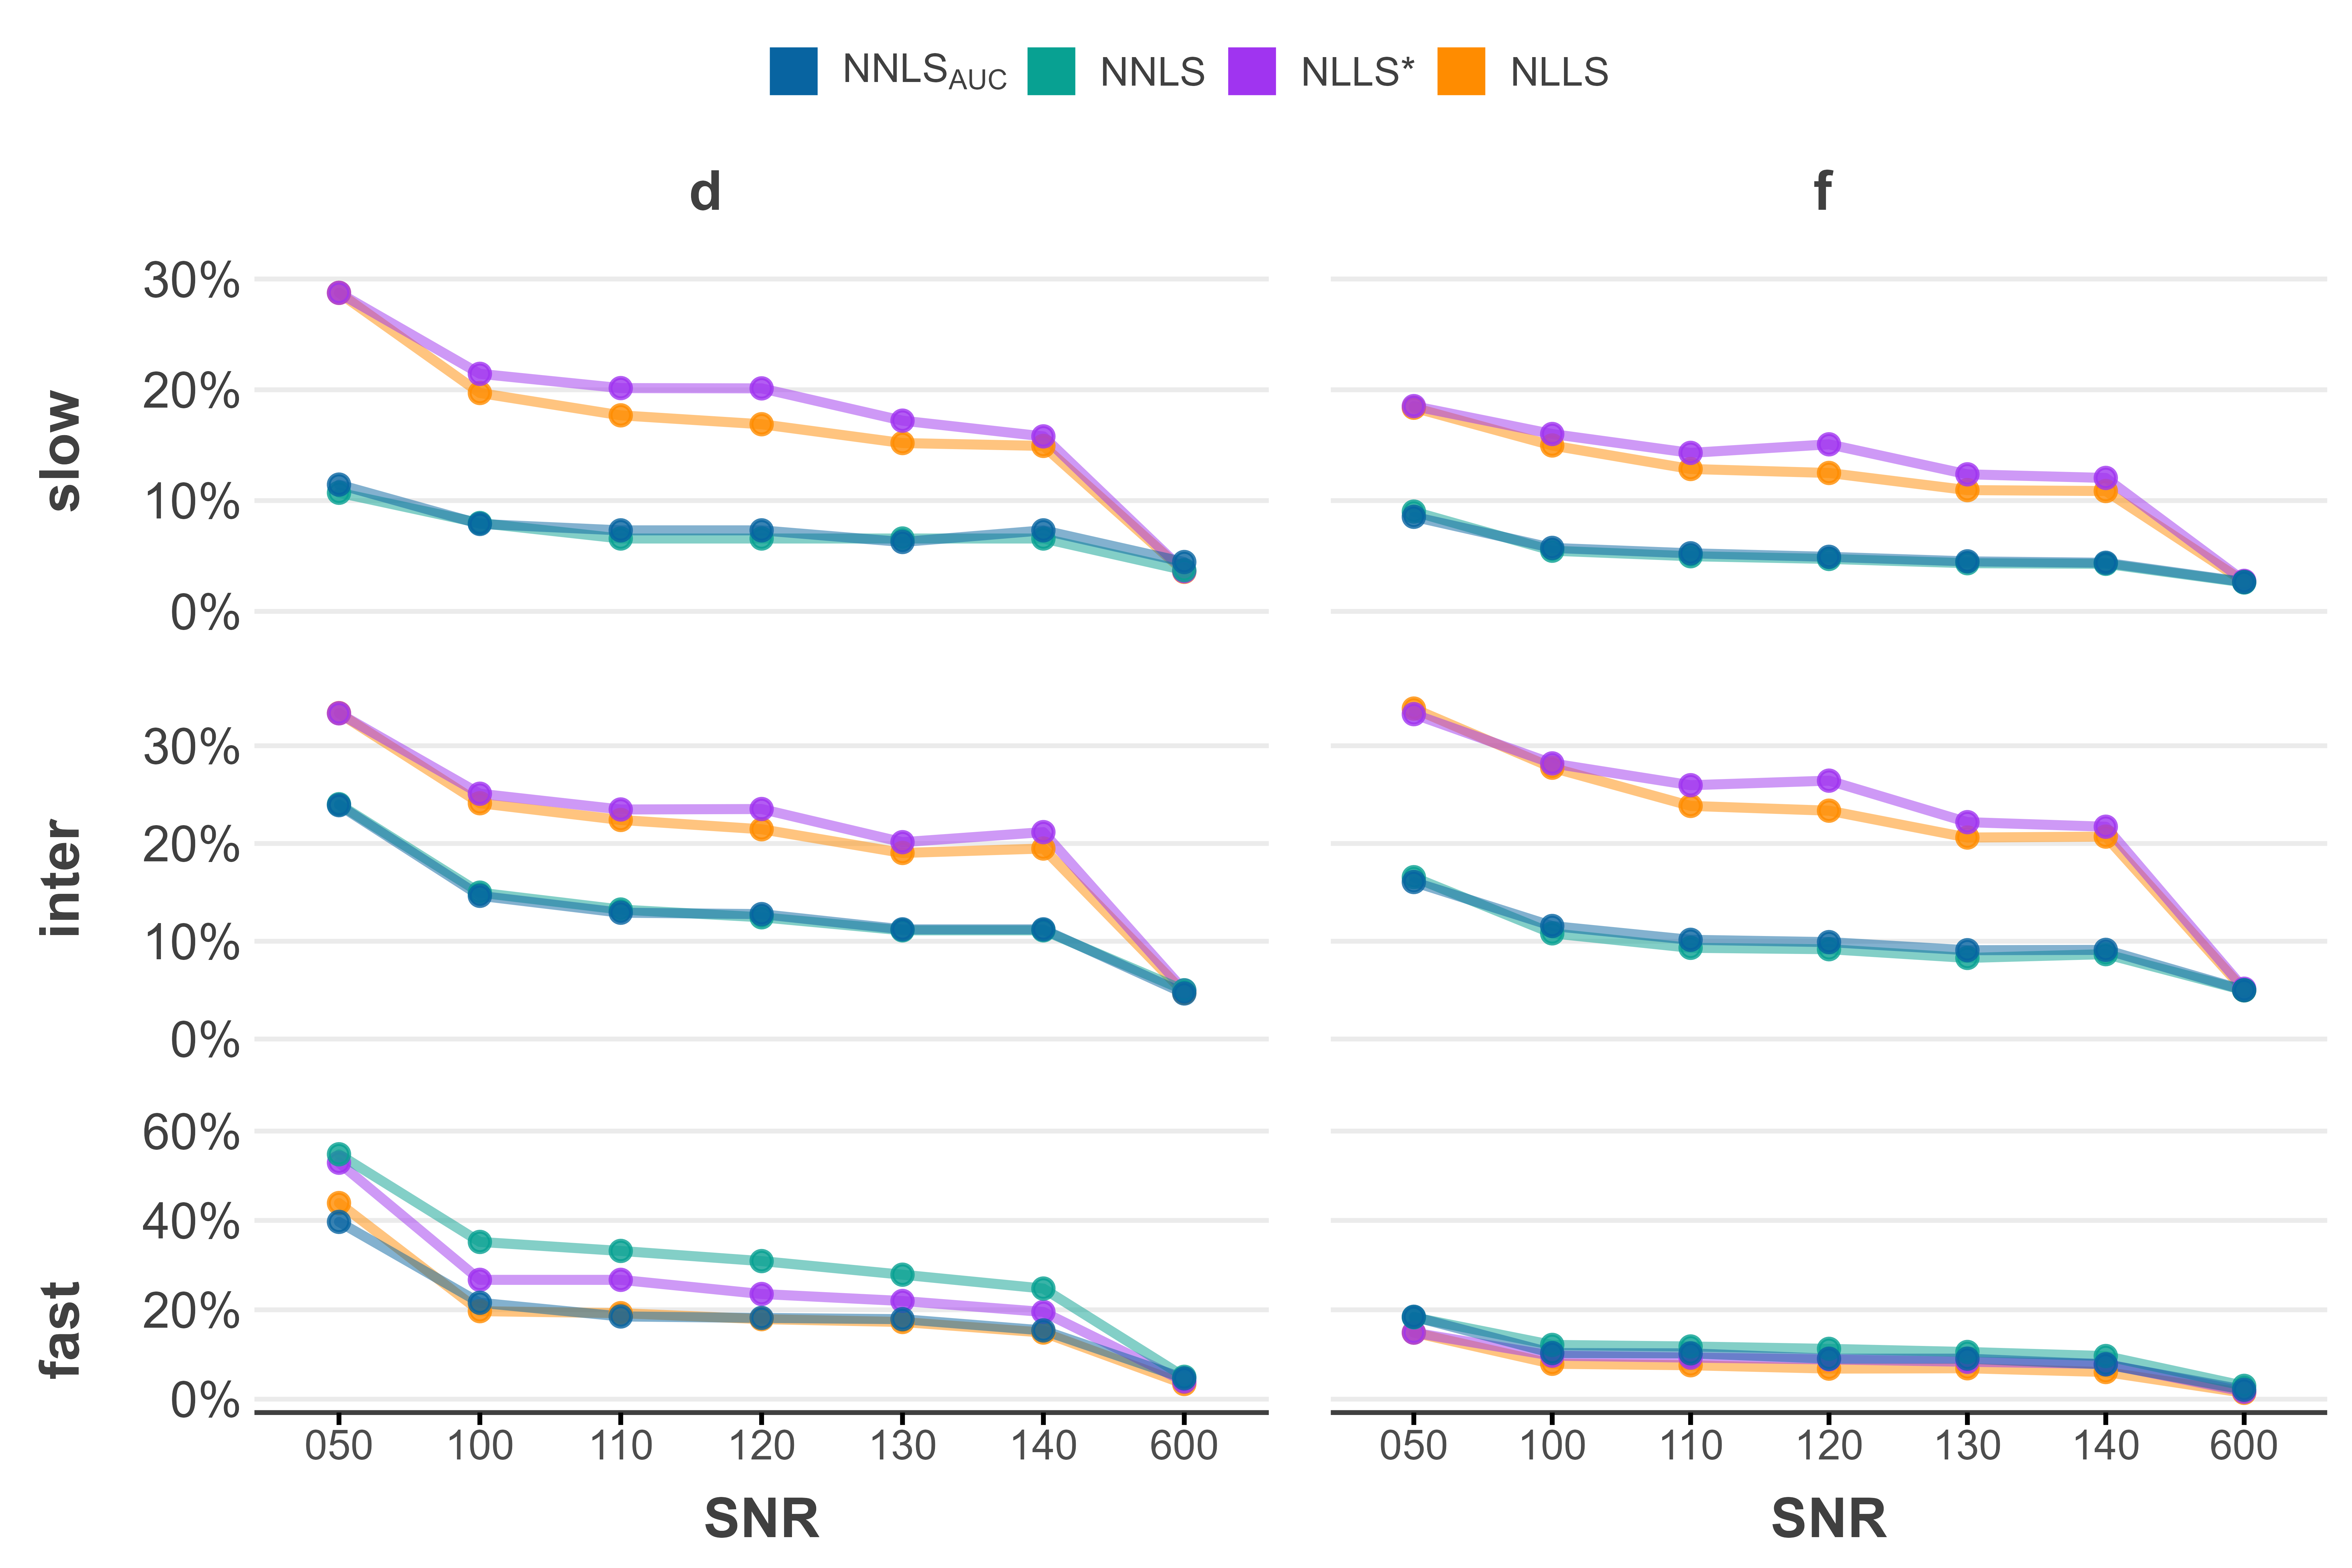
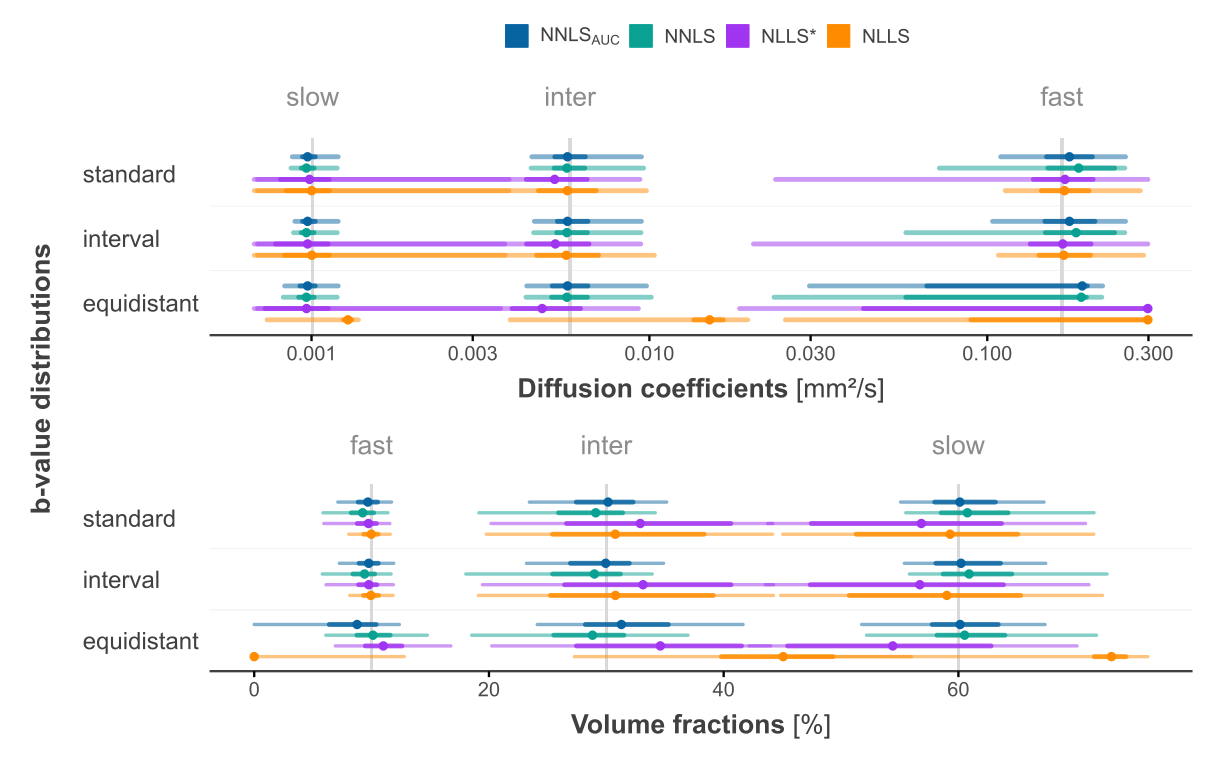
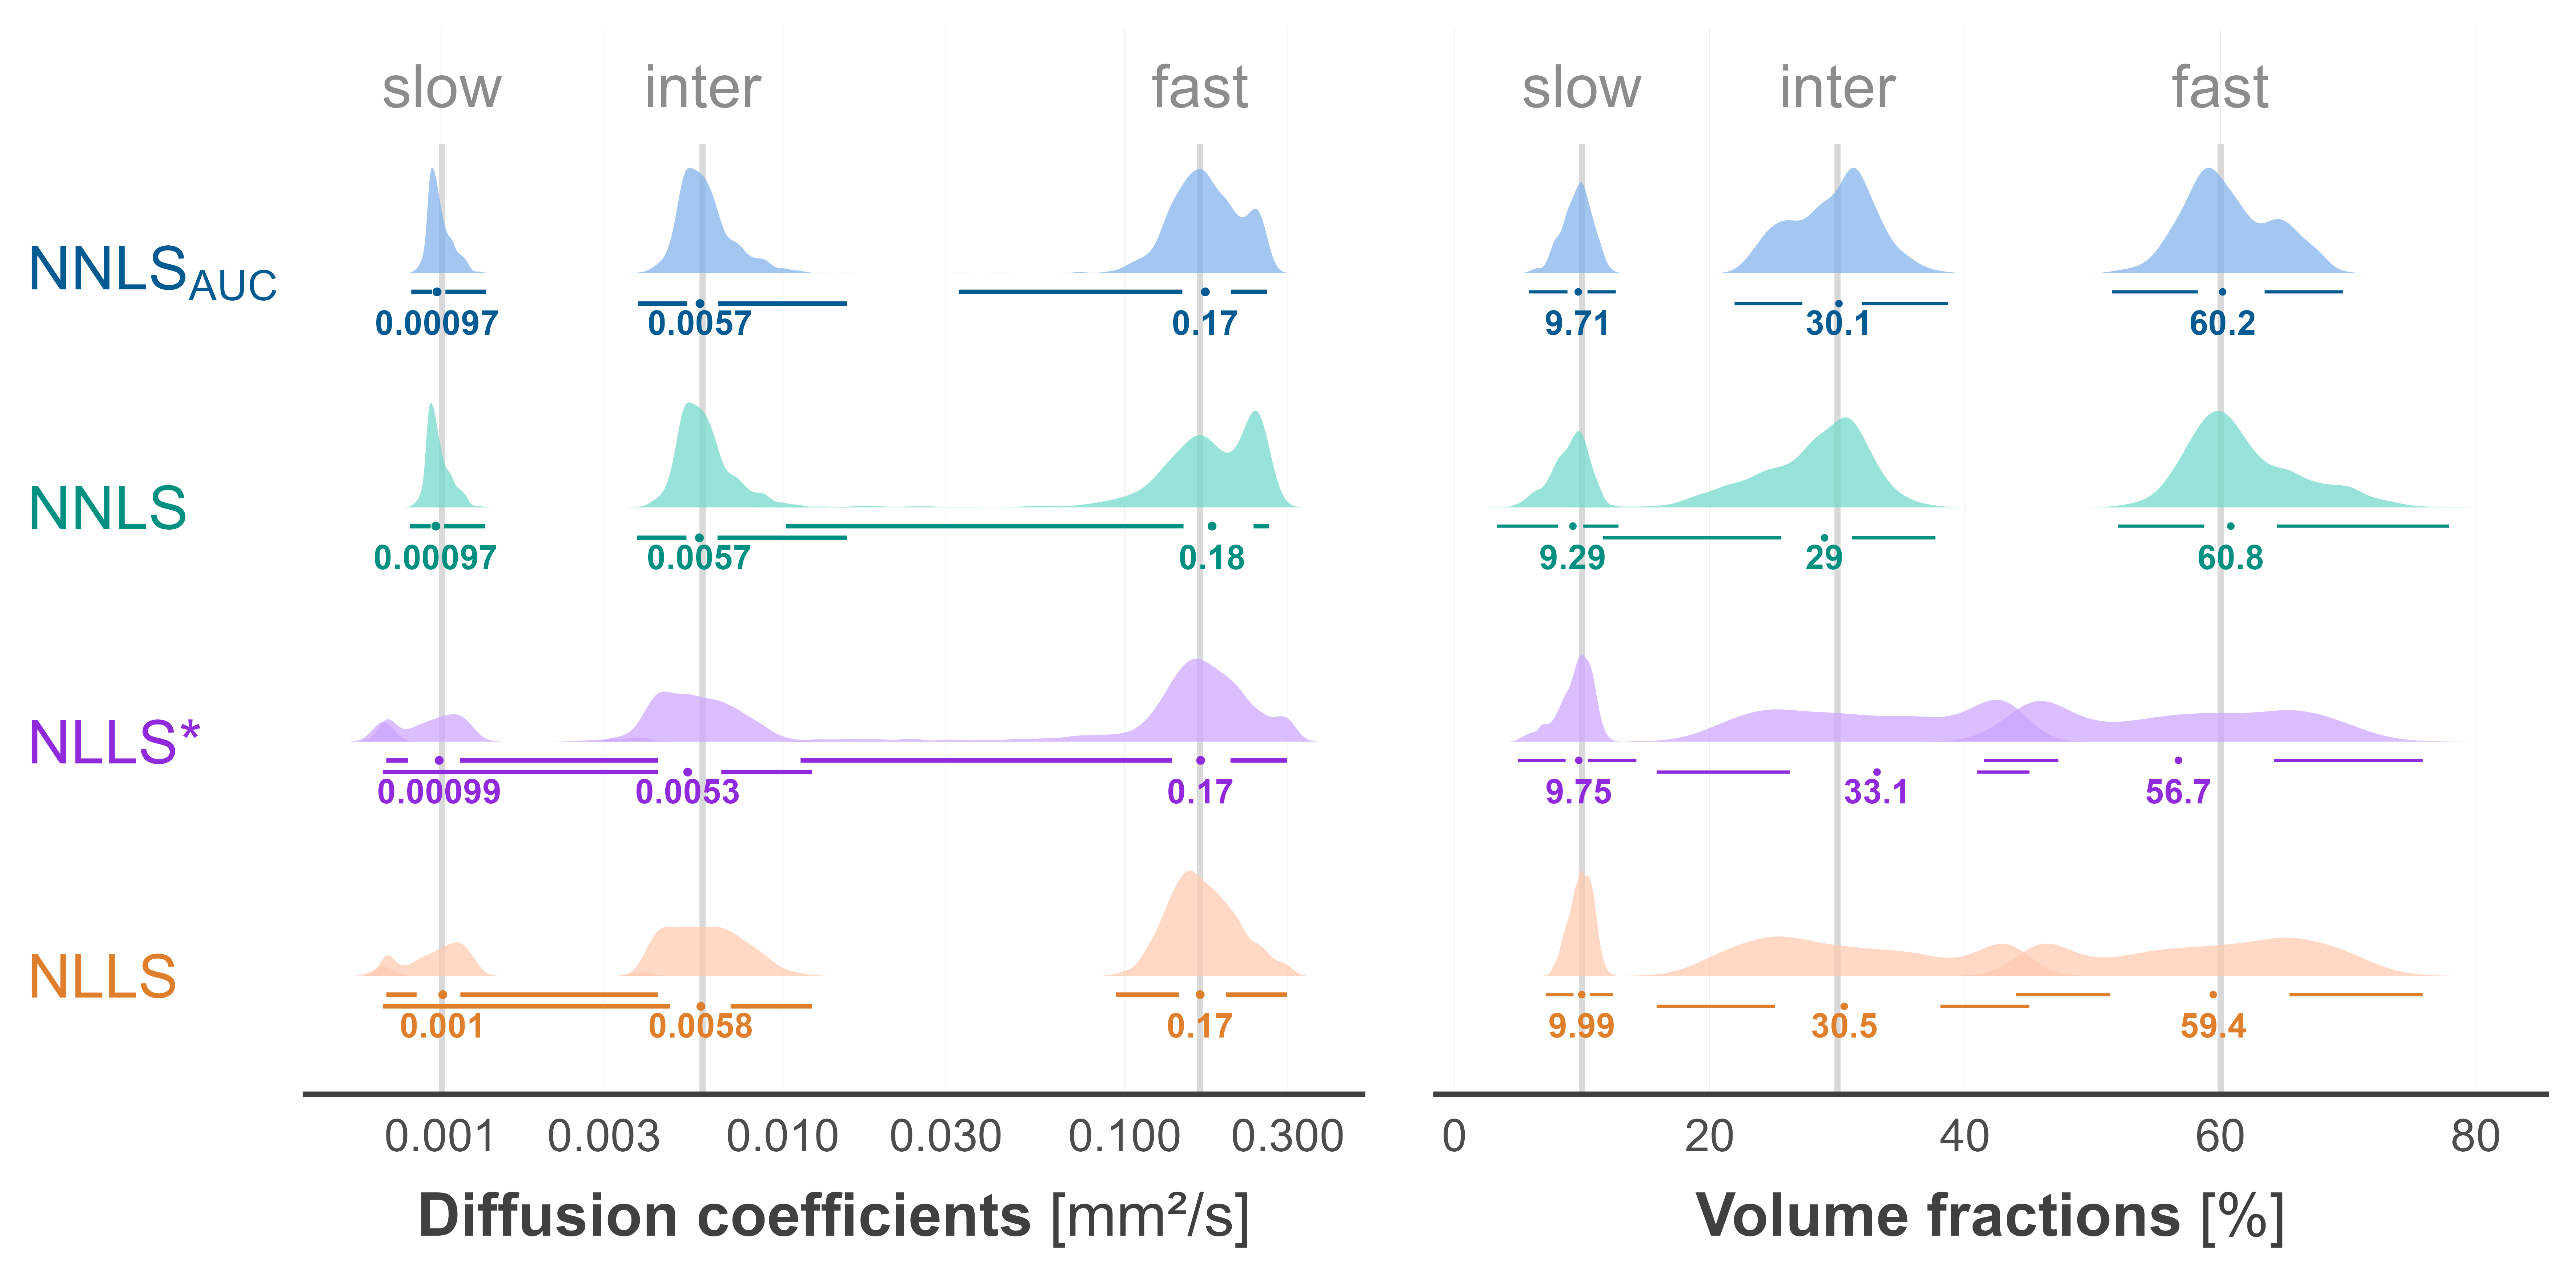
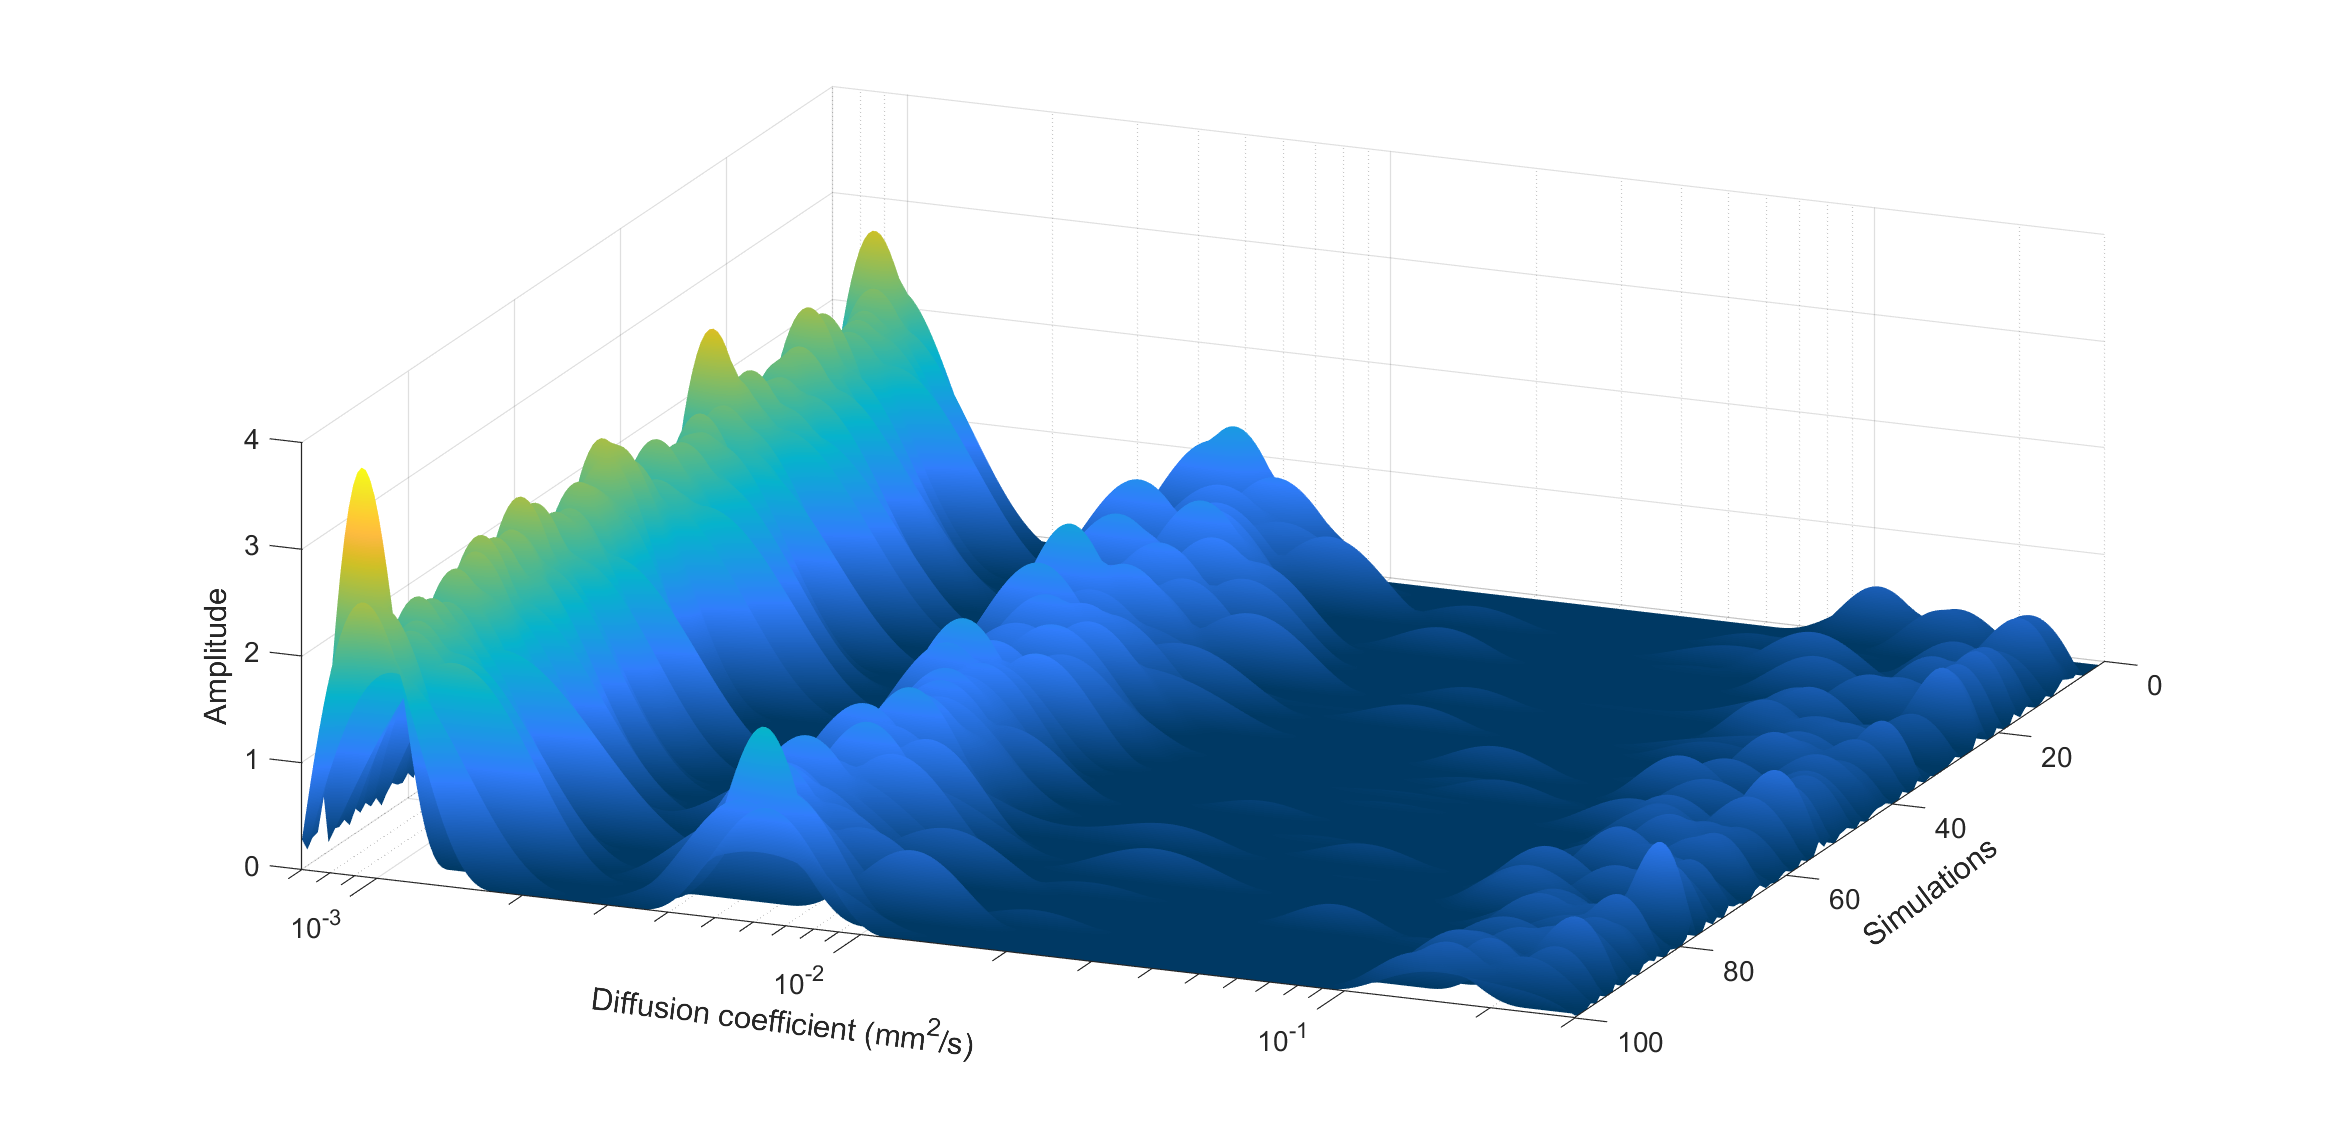
All fitting parameters have been successfully determined for all methods and parameter variations. A SNR of 140 with a maximum b-value of 750 s/mm² and 350 diffusion coefficients distributed from 0.7 to 300 x 10-3 mm²/s have been found to be optimal for fitting. With an average MAPD of just 10.9% for the diffusion coefficients d and 6.4% for volume fractions f, NNLSAUC proves to be the most accurate method referred to gT values. Conversely, non-linear methods produced the highest deviation, with an MAPD of 16.5% and 14.1% (NLLS) for d and f respectively. NNLS pre-fitting did not yield any benefits when comparing the MAPD of NLLS*. Some parameter variation results are shown in Figure 2 and Figure 3, accompanied by Figure 4 for additional results with optimal parameter sets. An exemplified result of a NNLS simulation spectrum can be seen in Figure 5.Discussion
The results of improved accuracy for regularised NNLS over NLLS are in line with current literature. The use of NNLSAUC combines the advantages of an unrestricted non-negative fitting method with the benefits of a smoothing out noisy signal resulting in increased overall accuracy. Furthermore, a comparison to underlying simulation ground truth values is made possible, allowing to estimate the actual deviation of all methods precisely, suggesting the NNLSAUC method for best results.Results
The optimized fitting parameters in multi-exponential signal analysis at a SNR of 120 and the use of NNLSAUC will improve the accuracy of in-vivo diffusion data fitting in renal MR imaging.Acknowledgements
The author of this work, Jonas Jasse, received a doctoral grant from the Jürgen-Manchot-Stiftung.References
1. MacKay A, Laule C, Vavasour I, Bjarnason T, Kolind S, Madler B. Insights into brain microstructure from the T2 distribution. Magn Reson Imaging. May 2006;24(4):515-25. doi:10.1016/j.mri.2005.12.037
2. van Baalen S, Leemans A, Dik P, Lilien MR, ten Haken B, Froeling M. Intravoxel incoherent motion modeling in the kidneys: Comparison of mono-, bi-, and triexponential fit. Journal of Magnetic Resonance Imaging. 2017;46(1):228-239. doi:10.1002/jmri.25519
3. Whittall KP, MacKay AL. Quantitative interpretation of NMR relaxation data. Journal of Magnetic Resonance (1969). 1989/08/01/ 1989;84(1):134-152. doi:10.1016/0022-2364(89)90011-5
4. Periquito J, Gladytz T, Millward J, et al. Continuous diffusion spectrum computation for diffusion-weighted magnetic resonance imaging of the kidney tubule system. Quantitative Imaging in Medicine and Surgery. 07/01 2021;11:3098-3119. doi:10.21037/qims-20-1360
5. Stabinska J, Ljimani A, Zollner HJ, et al. Spectral diffusion analysis of kidney intravoxel incoherent motion MRI in healthy volunteers and patients with renal pathologies. Magn Reson Med. Jun 2021;85(6):3085-3095. doi:10.1002/mrm.28631
6. Chevallier O, Wang YXJ, Guillen K, Pellegrinelli J, Cercueil JP, Loffroy R. Evidence of Tri-Exponential Decay for Liver Intravoxel Incoherent Motion MRI: A Review of Published Results and Limitations. Diagnostics (Basel). Feb 23 2021;11(2)doi:10.3390/diagnostics11020379
7. Lawson CL, Hanson RJ. Solving Least Squares Problems. Society for Industrial and Applied Mathematics; 1995.
8. Bjarnason TA, Mitchell JR. AnalyzeNNLS: magnetic resonance multiexponential decay image analysis. J Magn Reson. Oct 2010;206(2):200-4. doi:10.1016/j.jmr.2010.07.008
Figures