2408
Harmonic power validation of fiber ball imaging1MUSC, Charleston, SC, United States
Synopsis
Keywords: Simulation/Validation, Validation, White Matter, Microstructure, fODF
Motivation: Fiber ball imaging (FBI) makes quantitative predictions beyond the previously reported diffusion MRI (dMRI) b-value scaling of the direction-averaged signal.
Goal(s): Test the validity of the main FBI modeling assumptions.
Approach: In vivo human dMRI data from white matter were acquired at b-values ranging from 1000 to 10,000 s/mm2, and the spherical harmonic expansion was calculated for degrees up to l = 6. Theoretical predictions from FBI for the harmonic power b-value dependence were then compared to the experimental results.
Results: A close matching is observed between theory and experiment for b ≥ 4000 s/mm2.
Impact: The observed harmonic power b-value dependence strongly support the two main FBI assumptions that 1) axons can be modeled as thin, impermeable cylinders, and 2) intra-axonal water dominates the dMRI signal for b ≥ 4000 s/mm2.
Introduction
The direction-averaged diffusion MRI (dMRI) signal in white matter (WM) follows a $$$b^{-1/2}$$$ power-law decrease [1, 2], corresponding to the zero-degree harmonic power of the dMRI signal [3]. This scaling supports the two main fiber ball imaging (FBI) assumptions [4, 5]: 1) axons modeled as thin impermeable cylinders, and 2) at large b-values ($$$b$$$ ≥ 4000 s/mm2) intra-axonal water dominates the dMRI signal. FBI estimates the fiber orientation density function (fODF), describing the geometrical arrangement of axons, using a simple linear operation - the inverse Funk transform [4, 6]. Furthermore, FBI shows clinical potential being applied in studies of epilepsy [7, 8], severe leukoaraiosis [9], and healthy aging [10]. FBI further predicts b-value dependency for the harmonic powers of the dMRI signal [5] relying on two adjustable parameters: the intra-axonal diffusivity ($$$D_{a}$$$) and an overall shift ($$$u_{l}$$$) for each harmonic degree $$$l$$$. Typically, $$$D_{a}$$$ is either fit to the data or set a priori [11-13]. Here, we used triple diffusion encoding (TDE) [14-16] to directly determine $$$D_{a}$$$, leaving $$$u_{l}$$$ as the only free parameter. Given the b-value dependence of the dMRI signal and a direct estimation of $$$D_{a}$$$ via TDE, we hypothesize, at high b-values, the harmonic power of the dMRI signal for $$$l$$$ > 0 (reflecting angular variation in the data) will vary uniquely for each degree based on the FBI theory, thus further validating the main FBI assumptions.Theory
For a direction $$${\bf n}$$$, the dMRI signal is expandable in spherical harmonics as$$S(b,{\bf n})=S_{0}\sum_{l=0}^{\infty}\sum_{m=-l}^{l}a_{l}^{m}Y_{l}^{m}(\theta,\phi),\tag{1}$$where $$$S_0$$$ is the signal at $$$b$$$ = 0, $$$Y_{l}^{m}$$$ are the spherical harmonics with spherical angles $$$(\theta,\phi)$$$ for $$${\bf n}$$$, and $$$a_{l}^{m}$$$ are the expansion coefficients of degree $$$l$$$ and order $$$m$$$. Due to antipodal symmetry, the odd degrees vanish, and the harmonic power at each even degree is then [3]$$p_{l}\equiv\frac{1}{2l+1}\sum_{m=-l}^{l}|a_{l}^{m}|^{2}.\tag{2}$$ Assuming only intra-axonal contributions, FBI theory predicts [4]$$p_{l}\approx\frac{u_{l}}{b}\left[g_{l}(bD_{a})\right]^{2}\tag{3}$$where $$$u_{l}$$$ is a b-value independent factor and$$g_{l}(x)=\frac{\left(\frac{l}{2}\right)!\space{x^{\frac{l+1}{2}}}}{\Gamma\left(l+\frac{3}{2}\right)}{_1}F_{1}\left(\frac{l+1}{2};l+\frac{3}{2};-x\right)\text{for }l=0,2,4,6,...\tag{4}$$where $$${_1}F_{1}$$$ is the confluent hypergeometric function and $$$\Gamma$$$ is the gamma function.Methods
dMRI data was collected with a 3T Prismafit from three healthy adults. First, TDE data with total b-value of 4000 and 4600 s/mm2 were gathered (i.e., radial b-values of 0 and 300 s/mm2 representing the off and on conditions, respectively). Next, FBI data were gathered at 10 b-values of equal spacing between 1000 to 10,000 s/mm2. All data were acquired with 64 diffusion-encoding directions and 3 mm isotropic voxels. PyDesigner [17] performed image pre-processing and tensor calculations. WM voxels were selected using mean kurtosis > 1 and mean diffusivity < 1.5 μm2/ms. For each b-value, spherical harmonic expansion of the FBI data was calculated up to $$$l$$$ = 6. Using Equation (2), harmonic powers were determined in 4 regions of interest (ROI): cerebral WM and the genu, body and splenium of the corpus callosum. From TDE, Da was fixed and applied in a linear least squares fitting of harmonic powers of $$$b$$$ ≥ 5000 s/mm2 to estimate $$$u_{l}$$$ for each degree. The theoretical power curves were then calculated for 20 ≤ $$$b$$$ ≤ 10,000 s/mm2 using the measured $$$D_{a}$$$ and estimated $$$u_{l}$$$ values.Results
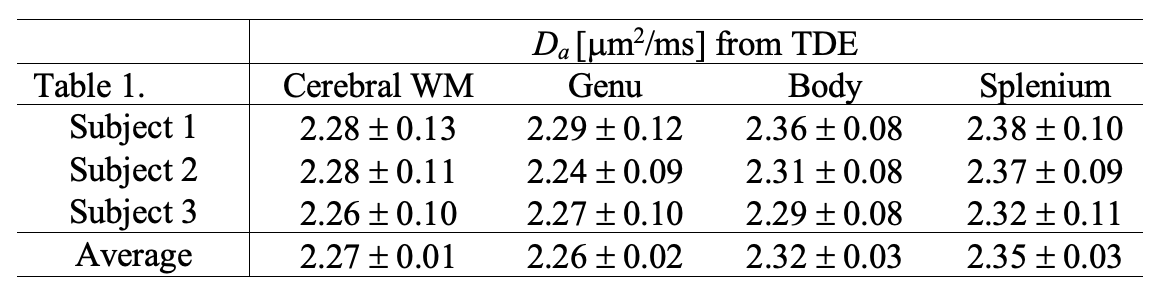
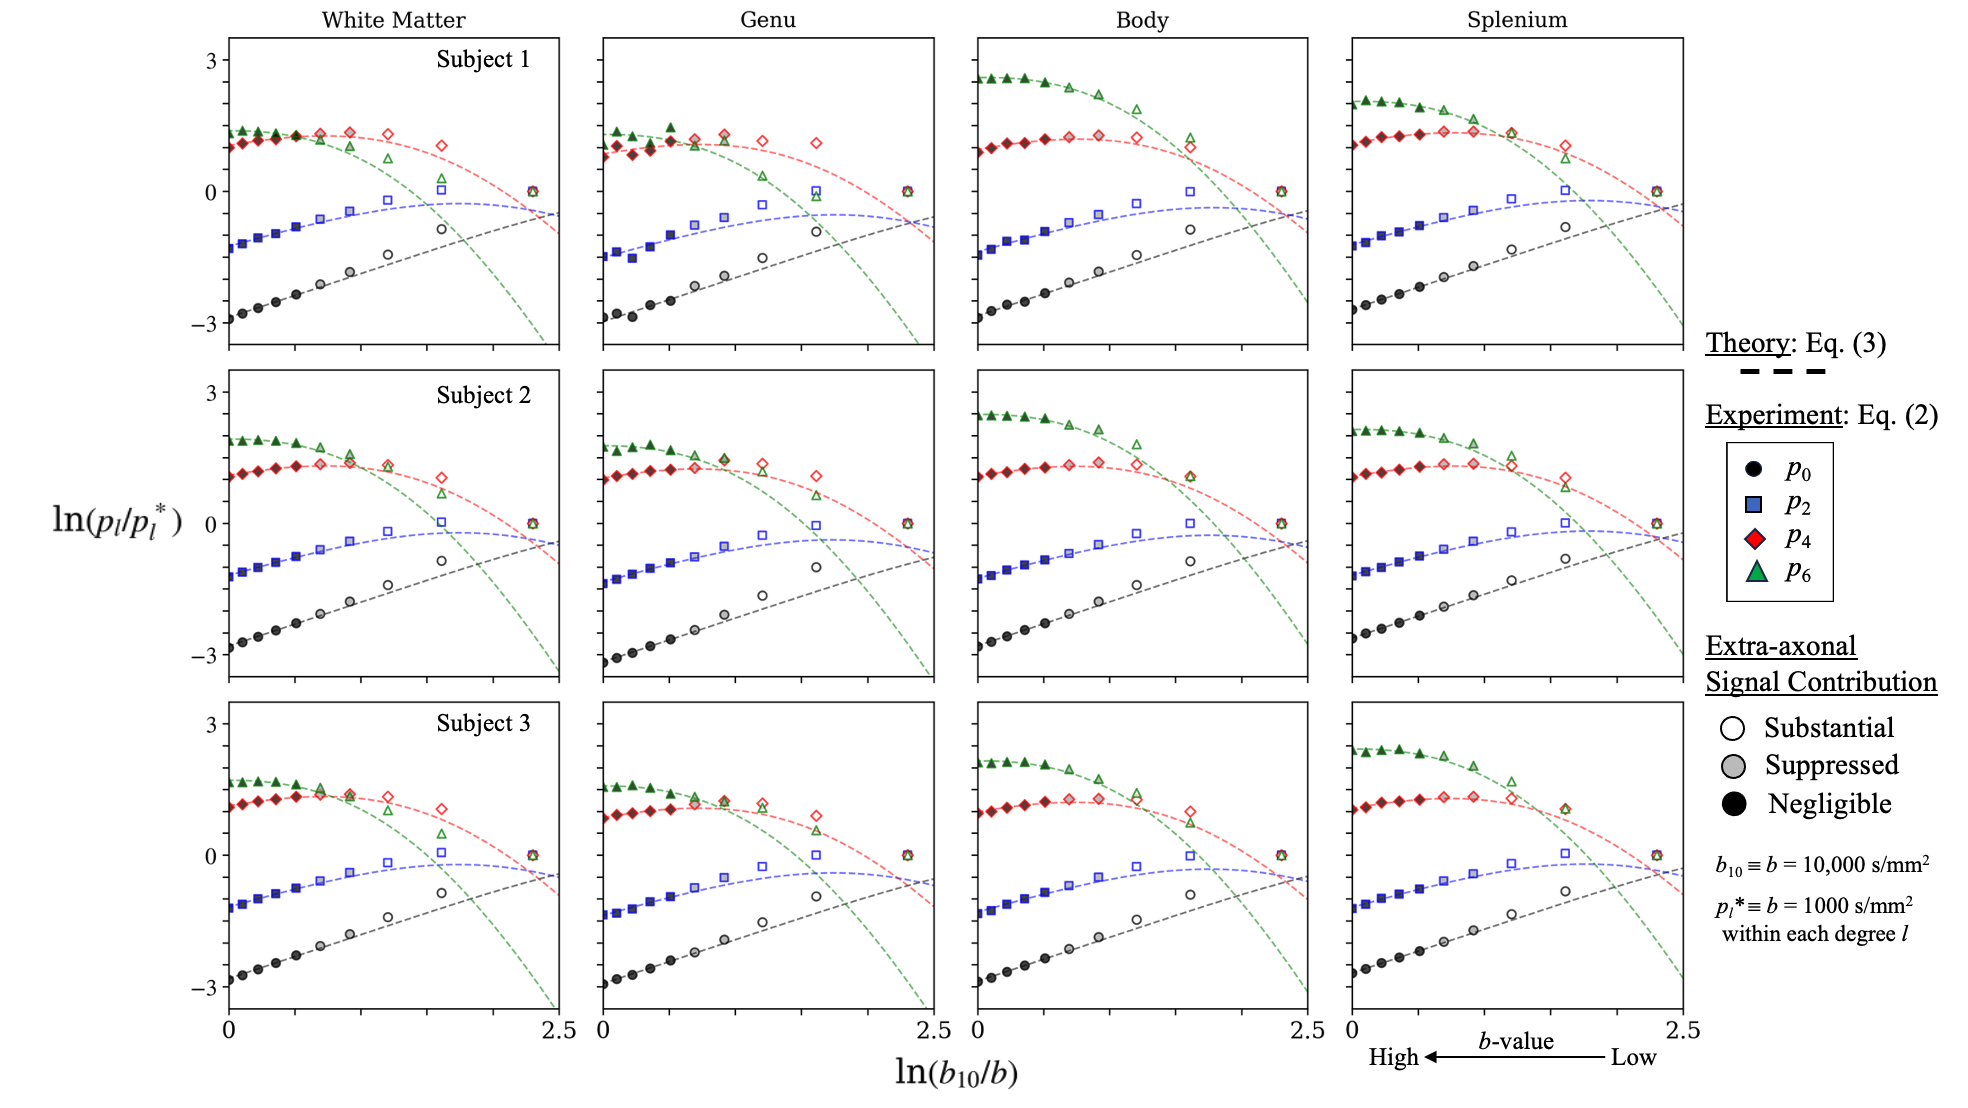
Table 1 provides average ± standard deviation of measured $$$D_{a}$$$. Figure 1 shows the harmonic power for each degree on a log-log scale normalized by the harmonic power of each degree at $$$b$$$ = 1000 s/mm2. On the plot, we present the theoretical predictions of Equation (3) (dashed lines) along with the experimental dMRI data averaged over all voxels for the harmonic powers up to degree 6 within each of the 4 ROIs (symbols). A good correspondence between theory and experiment becomes apparent for $$$b$$$ ≥ 4000 s/mm2. Visually, the scatter around the theoretical prediction is greatest in the $$$p_{4}$$$ and $$$p_{6}$$$ harmonics in the genu and body of the corpus callosum.Discussion
FBI predicts the b-value dependence for the harmonic powers of the dMRI signal. By applying TDE, $$$D_{a}$$$ was fixed for each voxel and $$$u_{l}$$$ was the sole fitting parameter for each degree. The measured $$$D_{a}$$$ values are consistent with prior studies [11, 15, 18]. In contrast to the $$$l$$$ = 0 harmonic power, corresponding to the spherical mean, the higher degree harmonics describe angular variation of the data. We observe good agreement with FBI predictions for $$$b$$$ ≥ 4000 s/mm2, where extra-axonal signal is expected to be sufficiently suppressed [1, 5]. Our results further support the validity, at high b-values, of the FBI assumptions. Agreement for higher harmonic powers is important to verify since FBI characterizes axonal geometry through the fODF, which is calculated from the higher degree harmonics.Acknowledgements
This work was supported in part by National Institute for Health (NIH) Research grants R01AG054159 and R01AG057602.References
1. McKinnon, E.T., et al., Dependence on b-value of the direction-averaged diffusion-weighted imaging signal in brain. Magn Reson Imaging, 2017. 36: p. 121-127.
2. Veraart, J., E. Fieremans, and D.S. Novikov, On the scaling behavior of water diffusion in human brain white matter. NeuroImage, 2019. 185: p. 379-387.
3. Śliwa, W., A.M. Sołtan, and M.J. Freyberg, The harmonic power spectrum of the soft X-ray background. A&A, 2001. 380(2): p. 397-408.
4. Jensen, J.H., G. Russell Glenn, and J.A. Helpern, Fiber ball imaging. NeuroImage, 2016. 124(Pt A): p. 824-833.
5. Moss, H.G., et al., Optimization of data acquisition and analysis for fiber ball imaging. NeuroImage, 2019. 200: p. 690-703.
6. Moss, H.G. and J.H. Jensen, High fidelity fiber orientation density functions from fiber ball imaging. NMR Biomed, 2022. 35(1): p. e4613.
7. Bryant, L., et al., Fiber ball white matter modeling in focal epilepsy. Hum Brain Mapp, 2021. 42(8): p. 2490-2507.
8. Gleichgerrcht, E., et al., High b-value diffusion tractography: Abnormal axonal network organization associated with medication-refractory epilepsy. NeuroImage, 2022. 248: p. 118866.
9. Szeles, D.M., et al., Brain Reserve in a Case of Cognitive Resilience to Severe Leukoaraiosis. J Int Neuropsychol Soc, 2021. 27(1): p. 99-108.
10. Dhiman, S., et al., Fiber ball white matter modeling reveals microstructural alterations in healthy brain aging. Aging Brain, 2022. 2.
11. McKinnon, E.T., J.A. Helpern, and J.H. Jensen, Modeling white matter microstructure with fiber ball imaging. NeuroImage, 2018. 176: p. 11-21.
12. Novikov, D.S., et al., Rotationally-invariant mapping of scalar and orientational metrics of neuronal microstructure with diffusion MRI. NeuroImage, 2018. 174: p. 518-538.
13. Zhang, H., et al., NODDI: practical in vivo neurite orientation dispersion and density imaging of the human brain. NeuroImage, 2012. 61(4): p. 1000-16.
14. Jensen, J.H. and J.A. Helpern, Characterizing intra-axonal water diffusion with direction-averaged triple diffusion encoding MRI. NMR Biomed, 2018. 31(7): p. e3930.
15. Ramanna, S., et al., Triple diffusion encoding MRI predicts intra-axonal and extra-axonal diffusion tensors in white matter. Magn Reson Med, 2020. 83(6): p. 2209-2220.
16. Moss, H.G., E.T. McKinnon, and J.H. Jensen, Testing white matter tissue modeling with multiple diffusion encoding MRI. Proc. Intl. Soc. Mag. Reson. Med., 2020. 28.
17. Dhiman, S., et al., PyDesigner: A Pythonic Implementation of the DESIGNER Pipeline for Diffusion Tensor and Diffusional Kurtosis Imaging. bioRxiv, 2021: p. 2021.10.20.465189.
18. Dhital, B., et al., Intra-axonal diffusivity in brain white matter. NeuroImage, 2019. 189: p. 543-550.
Figures