2397
Amide proton transfer MRI-based radiomic signatures for molecular subgrouping of pediatric medulloblastoma1Key Laboratory for Biomedical Engineering of Ministry of Education, Department of Biomedical Engineering, College of Biomedical Engineering & Instrument Science, Zhejiang University, Hangzhou, Zhejiang, China, 2Department of Radiology, Children’s Hospital, Zhejiang University School of Medicine, Hangzhou, Zhejiang, China, 3Philips Healthcare, Shanghai, China, 4Department of Radiation Oncology, The First Affiliated Hospital, Zhejiang University School of Medicine, Hangzhou, Zhejiang, China, 5Department of Biomedical Engineering, City University of Hong Kong, Hong Kong, China, 6Department of Neurosurgery, Children’s Hospital, Zhejiang University School of Medicine, Hangzhou, Zhejiang, China
Synopsis
Keywords: Cancer, Radiomics
Motivation: Medulloblastoma (MB) is classified into different molecular (WNT, SHH, Group 3, and Group 4) subgroups. Accurate identification of molecular subgroups provides clinical value to the diagnosis of MB.
Goal(s): We aim to combine APT MRI and radiomic analysis to establish signatures for distinguishing molecular subgroups of pediatric medulloblastoma.
Approach: Fifty newly diagnosed pediatric patients with medulloblastoma were enrolled in this study. Radiomic features were extracted from APT-related metrics to differentiate MB subgroups.
Results: APT MRI-based radiomic signatures exhibited favorable performance in identifying WNT, SHH, Group 3, and Group 4 subgroups with AUCs ≥ 0.91.
Impact: Our research findings demonstrate that amide proton transfer MRI-based radiomic analysis offers a noninvasive and cost-effective method to distinguish molecular subgroups and holds great potential in providing valuable clinical insights for the diagnosis of pediatric medulloblastoma patients.
Introduction
Amide proton transfer (APT) imaging, a variant of chemical exchange saturation transfer (CEST) imaging(1), is an innovative molecular MRI technique that offers a noninvasive means to probe proteins and peptides(2). Previous studies have utilized structural MRI techniques to qualitatively characterize molecular subgroups of MB, including tumor location and enhancement pattern(3,4). Radiomics, an emerging image analysis technique, has been combined with conventional T1-weighted (T1w) and T2-weighted (T2w) images to subgroup MB in earlier works(5,6). In this study, we aim to combine the radiomics methodology with APT MRI to develop signatures for distinguishing molecular subgroups among pediatric MB patients.Methods
Patients: The local Institutional Review Board approved this study. A cohort of 50 patients with confirmed MB was enrolled in our study from February 2018 to April 2022, including 5 WNT, 14 SHH, 10 G3, and 21 G4 patients. Due to the limited number of patients, only binary categorization was performed to differentiate molecular subgroups of MB, e.g., WNT vs. non-WNT.MRI data acquisition and preprocessing: All patients underwent MRI examinations on a 3T Philips Achieva scanner. A frequency-stabilized turbo-spin-echo CEST sequence(7,8) was employed to obtain APT source images, following specific parameters outlined as follows: RF saturation power/duration=2uT/0.8sec, TR/TE=3000/6.7ms, FOV=230x185mm2, slice thickness=6mm, and 63 frequency offsets from -6 to 80ppm. A vendor-preset “MIX” sequence was implemented to acquire quantitative T1 maps(9). APT-related metrics, including CESTR, CESTRnr, MTRRex, and AREX, were calculated with the reference frame at -3.5ppm and the label frame at 3.5ppm(10).
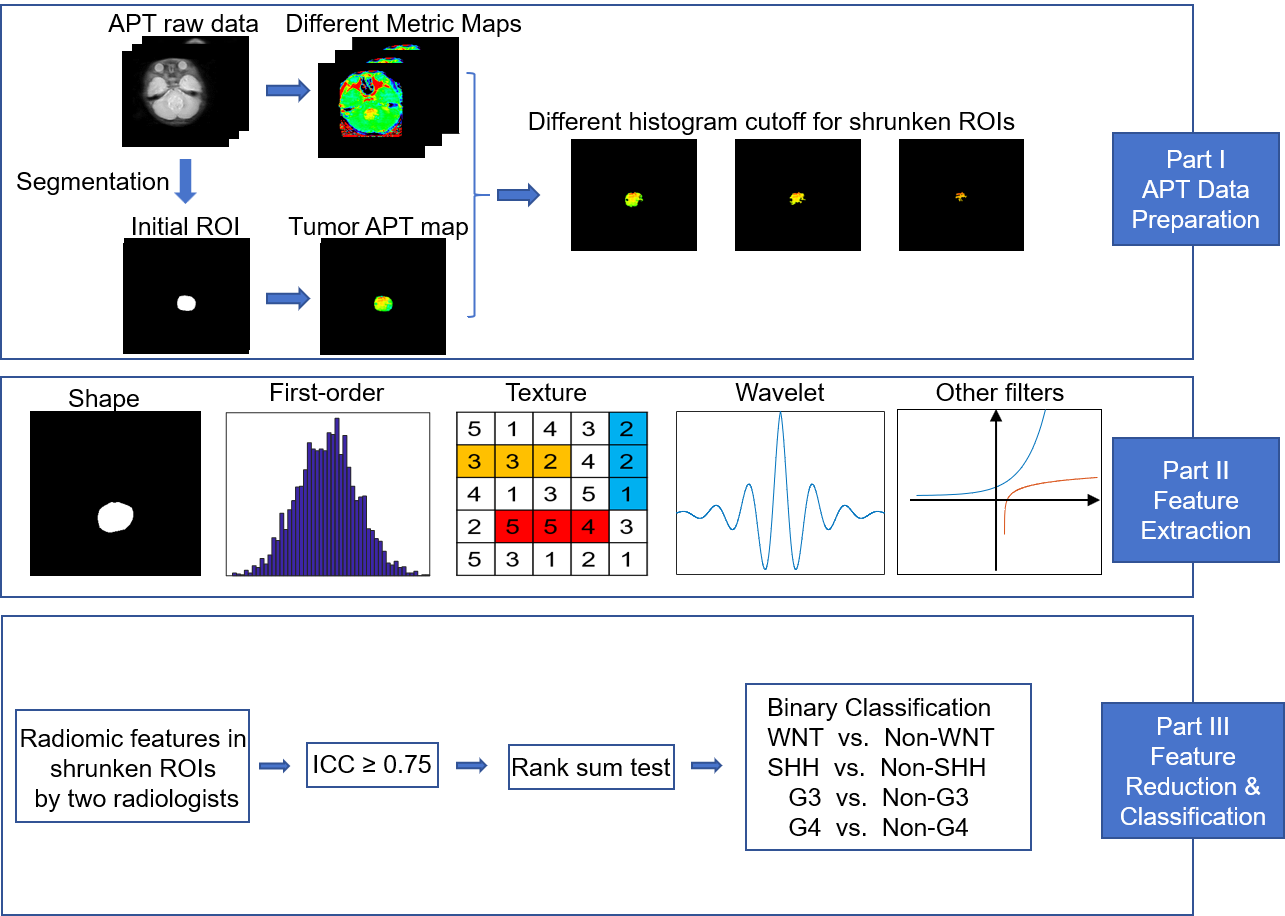
Habitat definition: Two pediatric radiologists delineated the region of interest (ROI) encompassing the entire tumor based on the unsaturated APT source image, using conventional structural MRI as a reference. Subsequently, an automatic ROI-shrinking algorithm was applied to select sub-ROIs where the APT signal intensity surpasses a pre-defined histogram threshold ranging from 0th to 95th percentiles with a step size of 5th percentile(11).
Radiomic feature extraction: A total of 919 features were extracted within sub-ROIs from each APT-related metric using the PyRadiomics tool(12), including 9 two-dimensional shape features, 18 first-order statistical features, 22 GLCM features, 16 GLRLM features, 16 GLSZM features, 14 GLDM features, and 5 NGTDM features. The first-order statistical features and texture features were extracted not only from the original image but also from filter-transformed images of every single metric map, such as wavelet, exponential, and other transformations. All extracted features underwent standardization using z-score normalization for succeeding analysis.
Radiomic signature construction: The intraclass correlation coefficient (ICC) was employed to assess the consistency of radiomic features extracted from ROIs defined by the two radiologists. The features with ICC higher than 0.75 underwent the Wilcoxon rank-sum test and were retained if the p-value was below 0.05. The diagnostic performance of each retained feature was assessed using the area under the curve (AUC) of the receiver operating characteristic (ROC) analysis. Subsequently, a multivariate logistic regression model with stepwise selection was employed to combine the chosen features and construct a signature for each metric. We set an upper limit for the number of features selected to 5 in the model, considering the size of the enrolled participants (13).
Results
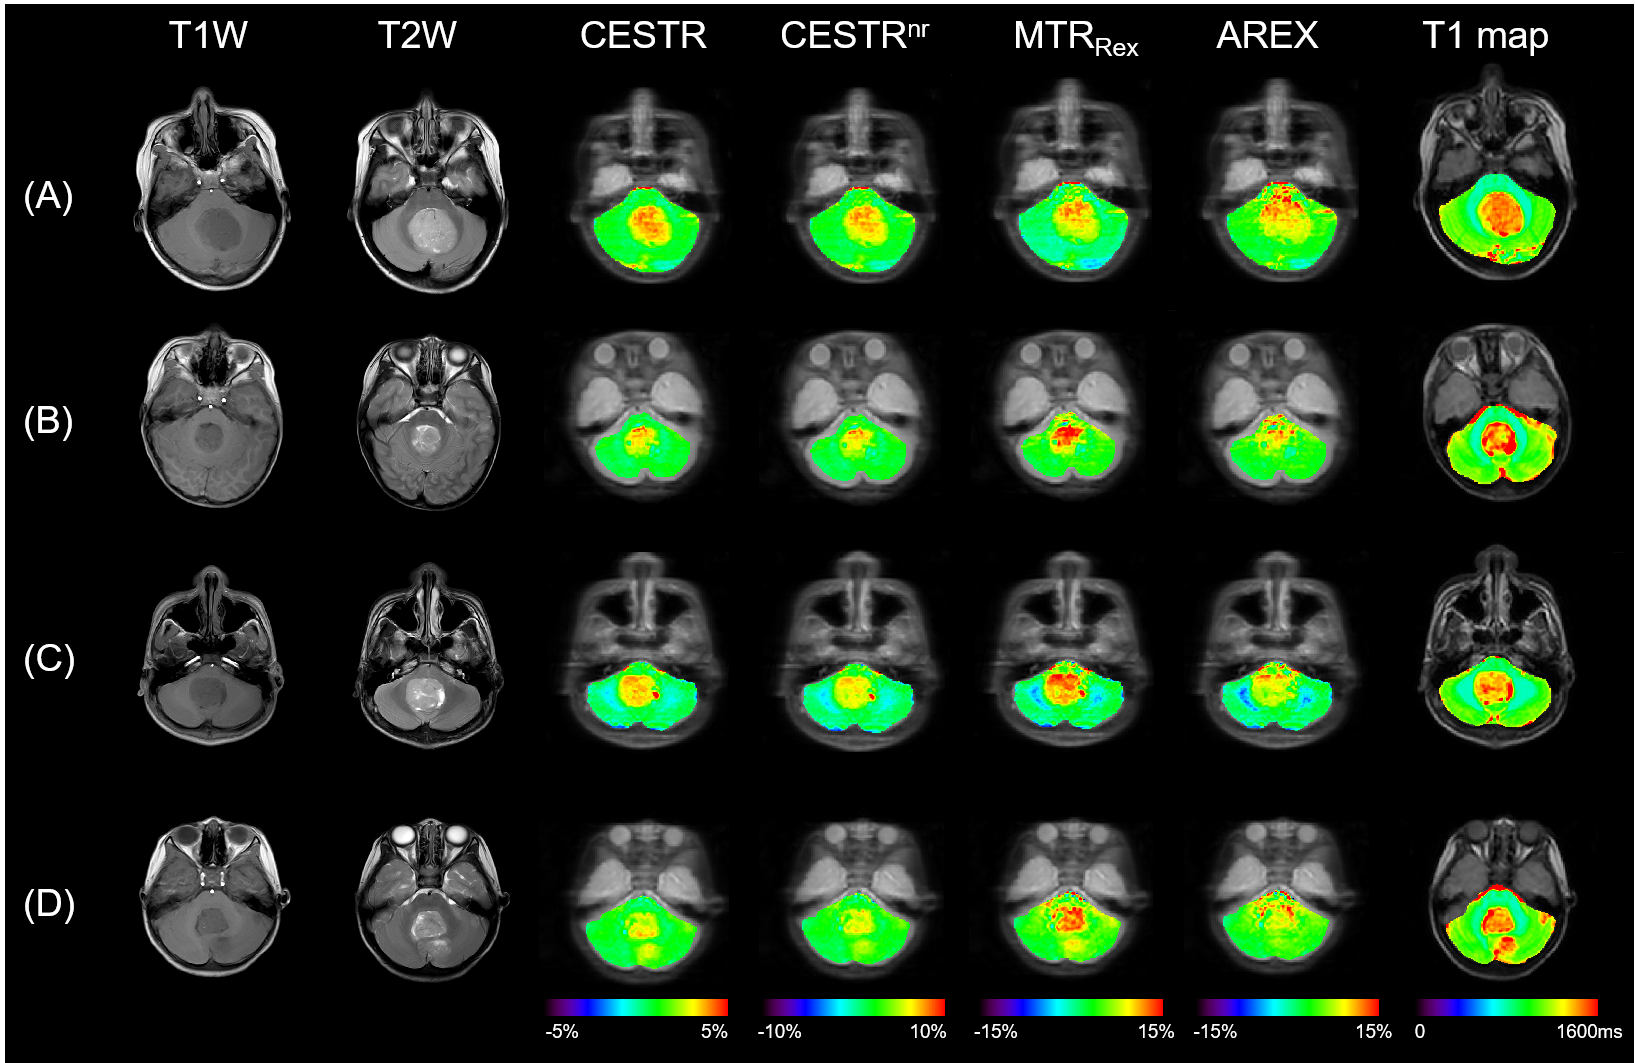
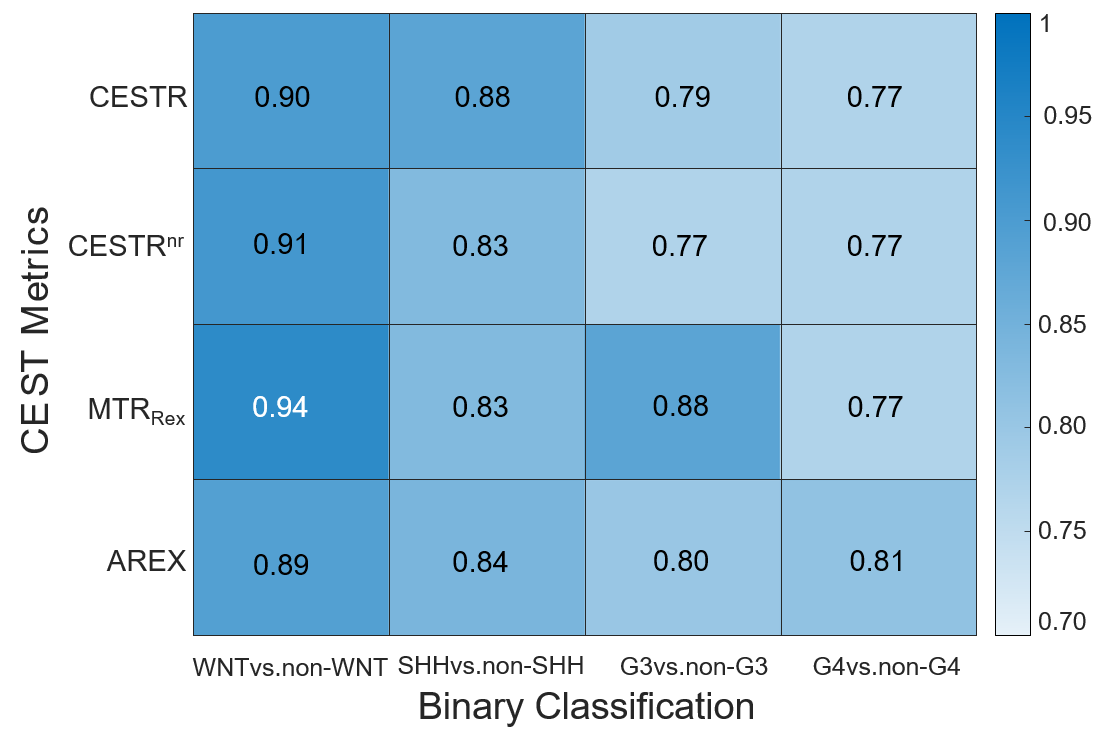
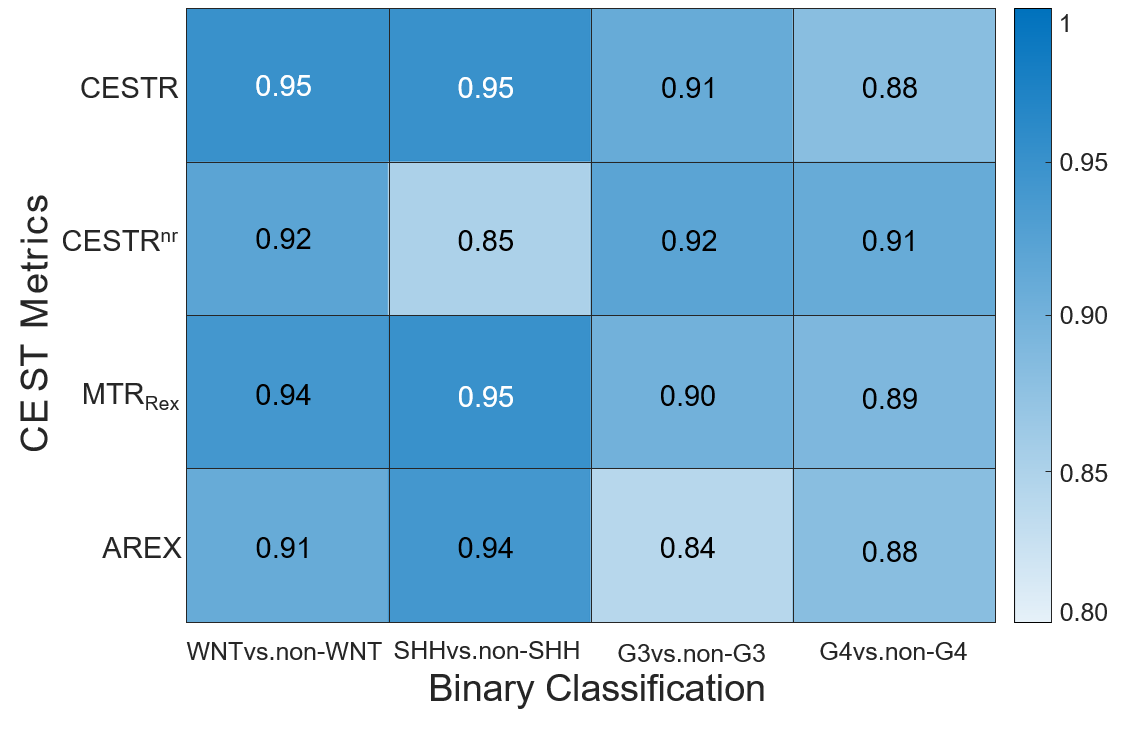
Patients’ demographics are listed in Table 1. Figure 1 exhibits the workflow of this study, including APT data preparation, feature extraction, and feature reduction & classification. Figure 2 showcases representative patients of the four MB subgroups, displaying anatomical T1w and T2w images, APT-related metric maps (CESTR, CESTRnr, MTRRex, and AREX), and quantitative T1 maps. The best ROC results of single radiomic features from various APT-related metric maps at the optimal histogram cutoff levels are presented in Figure 3. The highest AUCs for distinguishing WNT, SHH, Group 3, and Group 4 subgroups with individual radiomic features were 0.94, 0.88, 0.88, and 0.81, respectively. In addition, as displayed in Figure 4, the multivariate logistic regression model improved the AUCs to 0.95, 0.95, 0.92, and 0.91 for stratifying the molecular subgroups.Discussion & Conclusion
Previous studies have applied radiomic analysis to conventional T1w and T2w images for subgrouping MB patients(5,6). Here, we combined APT MRI and radiomic analysis for MB subgrouping. However, there were some limitations in this study. First, these analyses were performed on a small cohort. Second, APT data acquisition was conducted in a single-slice manner instead of 3D imaging. Third, the parameters of the CEST sequence might not be optimal for medulloblastoma patients(14,15). In conclusion, we have demonstrated the potential of APT MRI-based radiomic signatures to distinguish molecular MB subgroups in children noninvasively. This cost-effective approach may add clinical value to the diagnosis of MB patients.Acknowledgements
National Natural Science Foundation of China: 81971605. Key R&D Program of Zhejiang Province: 2022C04031. Leading Innovation and Entrepreneurship Team of Zhejiang Province: 2020R01003. This work was supported by the MOE Frontier Science Center for Brain Science & Brain-Machine Integration, Zhejiang University.References
1. Van Zijl PC, Yadav NN. Chemical exchange saturation transfer (CEST): what is in a name and what isn't? Magnetic resonance in medicine 2011;65(4):927-948.
2. Zhou J, Zhu H, Lim M, Blair L, Quinones‐Hinojosa A, Messina SA, Eberhart CG, Pomper MG, Laterra J, Barker PB. Three‐dimensional amide proton transfer MR imaging of gliomas: initial experience and comparison with gadolinium enhancement. Journal of Magnetic Resonance Imaging 2013;38(5):1119-1128.
3. Perreault S, Ramaswamy V, Achrol A, Chao K, Liu T, Shih D, Remke M, Schubert S, Bouffet E, Fisher P. MRI surrogates for molecular subgroups of medulloblastoma. American Journal of Neuroradiology 2014;35(7):1263-1269.
4. Łastowska M, Jurkiewicz E, Trubicka J, Daszkiewicz P, Drogosiewicz M, Malczyk K, Grajkowska W, Matyja E, Cukrowska B, Pronicki M. Contrast enhancement pattern predicts poor survival for patients with non-WNT/SHH medulloblastoma tumors. Journal of Neuro-oncology 2015;123(1):65-73.
5. Iv M, Zhou M, Shpanskaya K, Perreault S, Wang Z, Tranvinh E, Lanzman B, Vajapeyam S, Vitanza NA, Fisher PG. MR imaging–based radiomic signatures of distinct molecular subgroups of medulloblastoma. American Journal of Neuroradiology 2019;40(1):154-161.
6. Zhang M, Wong SW, Wright JN, Wagner MW, Toescu S, Han M, Tam LT, Zhou Q, Ahmadian SS, Shpanskaya K. MRI radiogenomics of pediatric medulloblastoma: a multicenter study. Radiology 2022:212137.
7. Liu R, Zhang H, Niu W, Lai C, Ding Q, Chen W, Liang S, Zhou J, Wu D, Zhang Y. Improved chemical exchange saturation transfer imaging with real‐time frequency drift correction. Magnetic resonance in medicine 2019;81(5):2915-2923.
8. Liu R, Zhang H, Qian Y, Hsu YC, Fu C, Sun Y, Wu D, Zhang Y. Frequency‐stabilized chemical exchange saturation transfer imaging with real‐time free‐induction‐decay readout. Magnetic resonance in medicine 2021;85(3):1322-1334.
9. In den Kleef J, Cuppen J. RLSQ: T1, T2, and ρ calculations, combining ratios and least squares. Magnetic resonance in medicine 1987;5(6):513-524.
10. Heo HY, Lee DH, Zhang Y, Zhao X, Jiang S, Chen M, Zhou J. Insight into the quantitative metrics of chemical exchange saturation transfer (CEST) imaging. Magnetic resonance in medicine 2017;77(5):1853-1865.
11. Zhang H, Yong X, Ma X, Zhao J, Shen Z, Chen X, Tian F, Chen W, Wu D, Zhang Y. Differentiation of low-and high-grade pediatric gliomas with amide proton transfer imaging: added value beyond quantitative relaxation times. European Radiology 2021;31(12):9110-9119.
12. van Griethuysen JJM, Fedorov A, Parmar C, Hosny A, Aucoin N, Narayan V, Beets-Tan RGH, Fillion-Robin JC, Pieper S, Aerts H. Computational Radiomics System to Decode the Radiographic Phenotype. Cancer Res 2017;77(21):e104-e107.
13. Halligan S, Menu Y, Mallett S. Why did European Radiology reject my radiomic biomarker paper? How to correctly evaluate imaging biomarkers in a clinical setting. European Radiology 2021;31(12):9361-9368.
14. Zhou J, Heo HY, Knutsson L, van Zijl PC, Jiang S. APT‐weighted MRI: Techniques, current neuro applications, and challenging issues. Journal of Magnetic Resonance Imaging 2019;50(2):347-364.
15. Zhou J, Zaiss M, Knutsson L, Sun PZ, Ahn SS, Aime S, Bachert P, Blakeley JO, Cai K, Chappell MA. Review and consensus recommendations on clinical APT‐weighted imaging approaches at 3T: application to brain tumors. Magnetic resonance in medicine 2022;88(2):546-574.
Figures