2394
19F-Magnetic Resonance Spectroscopy to evaluate antidepressant exposure & patient-level factors affecting adolescent brain disposition1Children's Mercy Kansas City, Kansas City, MO, United States, 2University of Kansas Medical Center, Kansas City, KS, United States
Synopsis
Keywords: Adolescents, Drug Development
Motivation: Medication response in adolescent depression is unpredictable and relationships between dose, brain concentrations and clinical response are unknown.
Goal(s): 19F-MRS is uniquely suited to study pediatric brain disposition, as it’s non-invasive, non-radiolabeled and less than minimal risk.
Approach: Youth (n=52) aged 12-21 taking fluoxetine completed 19F-MRS at 3T.
Results: Brain fluoxetine concentrations exceeded plasma concentrations by 9 to 304-fold. Dose-normalized brain concentrations varied 13-fold, explained by plasma concentration and dose with small contributions from BMI, CYP2D6 and ABCB1. 19F-MRS is a valuable tool for studying pediatric brain disposition of fluorine-containing medications and enables inquiry into patient factors that impact brain exposure and response.
Impact: In vivo 19F-MRS measures brain concentrations of fluorine-containing medications and enables inquiry into individual-level factors contributing to brain disposition. This approach fills a critical gap in pediatric drug development, especially where other imaging modalities (e.g., PET) are not feasible.
INTRODUCTION
Depression affects 1 in 5 adolescents and suicide is the second leading cause of death. Due to limited and unpredictable response, a precision therapeutics approach is needed to inform treatment decisions, shorten time to recovery and save lives. Precision therapy requires reliable understanding of the relationships between dose, plasma and brain concentrations, and clinical response. Brain disposition of antidepressant medication in adolescents is not well understood, and factors contributing to variability in response, including pharmacogenetics, are poorly characterized.19F-MRS presents a unique opportunity to detect brain concentrations of fluorine-containing medications, including the antidepressant fluoxetine. Fluoxetine plasma levels are influenced by the major drug metabolizing enzyme (CYP2D6) and response may be influenced by the blood-brain barrier efflux transporter (ABCB1, encoding P-gp)1. Therefore, we evaluated fluoxetine exposure in the blood and brain of adolescents and explored the relationship between brain-blood exposure, response, and the impact of genetic factors.
METHODS
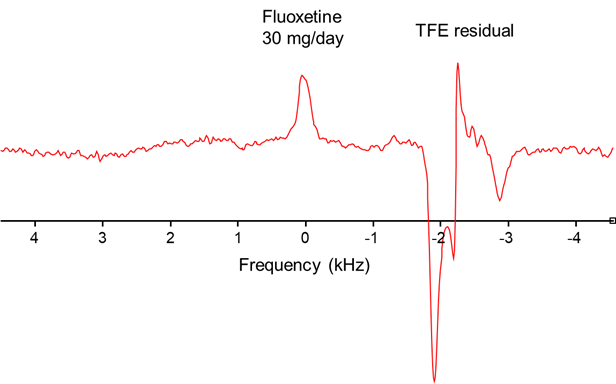
Study design and 19F-MRS: Prospective, observational study in youth aged 12-21 years taking fluoxetine for >4 weeks and no other fluorine-containing medications. Youth completed 19F-MRS on a Skyra 3T scanner using a dual-tuned (19F and 1H) quadrature volume head coil, described previously2. A 5 ml cylindrical vial of trifluoroethanol (TFE) was attached as an external reference to determine transmitter frequency. The 1H-MRS signal was used for shimming and to calibrate the power of 19F-MRS. To maximize SNR, the excitation pulse (Ernst angle of 70°) was matched to TR of 200 ms using the previously reported in vivo T1 of fluoxetine at 1.5T (~200 ms). Participants completed 3 19F-MRS scan blocks (10,000 averages each). Total scan time ~30 minutes. See Figure 1.Quantification of drug concentrations: The fluoxetine brain concentration (Cbrain) was calculated as follows:
Cbrain = (FID amplitude * Reference voltage/Vbrain) * 6.1e-9
where, Cbrain contained fluoxetine and its major metabolite, norfluoxetine, due to their similar chemical shifts. Vbrain was brain volume measured by segmentation of T1-weighted images using SPM (http://www.fil.ion.ucl.ac.uk/spm/). The 19F conversion factor, 6.1e-9, was calculated using a fluoxetine phantom (100 µM fluoxetine in 250 ml 0.9% NaCl) and the expression:
[phantom concentration / (phantom 19F FID amplitude * phantom reference RF amplitude * phantom volume)].
19F FID amplitude was obtained using AMARES3 in jMRUI4 software. No T1 relaxation correction was performed.
Peripheral blood was sampled prior to 19F-MRS and centrifuged at 1000 g x 10 min for plasma separation. Fluoxetine+norfluoxetine plasma concentrations (CPlasma) were quantified using ultra-high performance liquid chromatography-tandem mass spectrometry.
Pharmacogenetic analysis: Using DNA extracted from whole blood, ABCB1 and CYP2D6 was genotyped with Illumina array with ddPCR copy number confirmation.
Clinical response: Self-report depression and anxiety measures were obtained. PHQ9 scores ≥ 115 or Promis Anxiety t-scores ≥ 60 (moderate anxiety) were considered non-responders.
Statistical analysis: Correlation (Spearman’s rho, ρ), ANOVA & linear regression were done in SPSS.
RESULTS
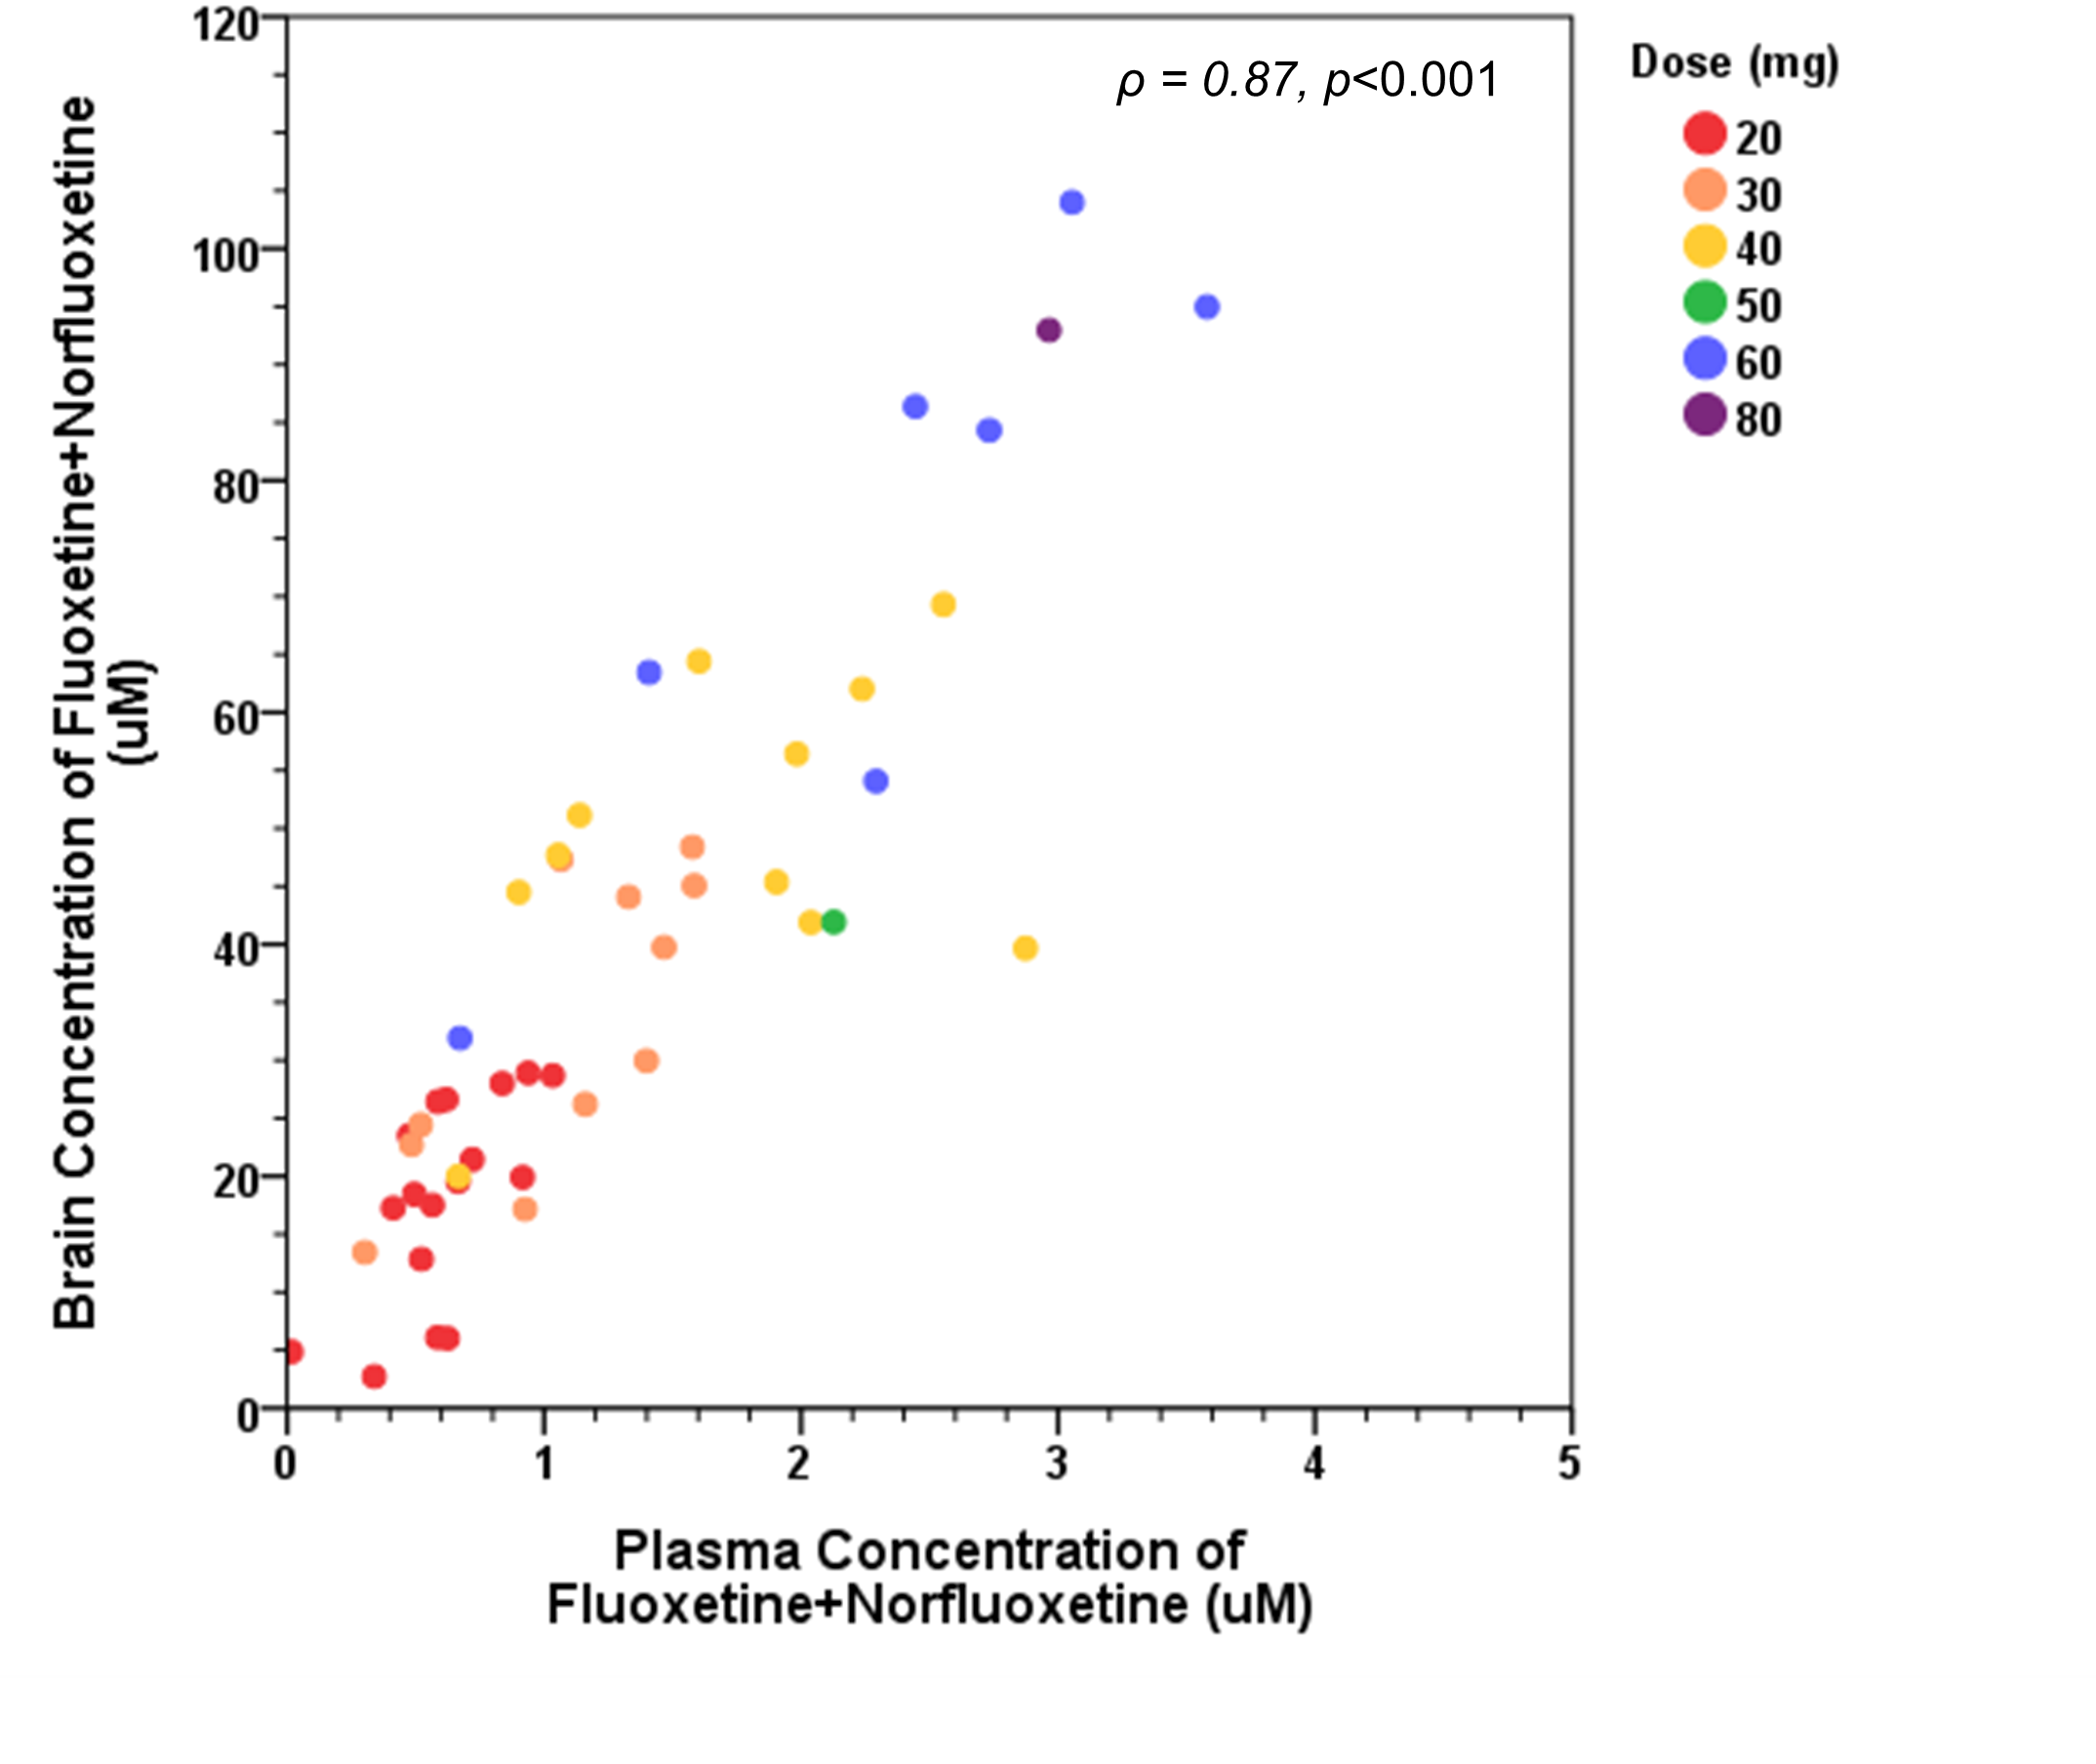
In 52 youth aged 16 ± 2.0 yr, 69% female, 19% gender diverse, taking 20-80 mg fluoxetine daily, Cbrain ranged 2.7-104 mM. Dose-normalized Cbrain varied 13-fold (n=48) and dose-normalized Cplasma varied 72-fold (n=50). Cbrain exceeded Cplasma by 8 to 49-fold, with one outlier having Cbrain 304-fold higher than Cplasma. Correlations between Cbrain & CPlasma (ρ = 0.87, p<0.001) as well as Cbrain & dose (ρ = 0.81, p<0.001) were strong (Figure 2).In a linear regression model predicting Cbrain (n=34), dose, CPlasma, BMI, and CYP2D6 yielded r2adj = 0.89, p<0.001 (dose and CPlasma, r2adj = 0.83; CPlasmaTotal alone r2adj = 0.78; dose alone r2adj = 0.68; all p<0.001). Substituting ABCB1 rs1045642 & rs2032582 for CYP2D6 produced similar results (r2adj = 0.88, p<0.001). Adding age and sex did not improve the model. Cbrain, CPlasmaTotal or brain:plasma ratio was not associated with depressive or anxiety scores (ρ = -0.13 to 0.08) and mean Cbrain, CPlasmaTotal, or brain:plasma ratio did not differ in responders vs. non-responders.
CONCLUSIONS
19F-MRS quantified fluoxetine brain concentrations in adolescents across a range of doses and enabled inquiry into patient-level influences on brain-blood disposition. Although correlated well, Cbrain was substantially higher than Cplasma in all participants suggesting preferential accumulation in the brain, which might facilitate therapeutic effect. Variability in Cbrain was largely explained by dose and Cplasma with modest gains with the inclusion of BMI, CYP2D6 or ABCB1. However, Cbrain or CPlasma and anxiety /depression symptoms were not correlated. Further work is needed to identify other factors that contribute to response and facilitate precision therapeutics.Acknowledgements
We would like to thank the study participants and their families for making this research possible.
This work is supported by the National Institutes of Health (UL1TR002366, K23MH130728), the Paul Patton Trust and the Hoglund Family Foundation.
References
1. Gassó P, Rodríguez N, Mas S, Pagerols M, Blázquez A, Plana MT, Torra M, Lázaro L, Lafuente A. Effect of CYP2D6, CYP2C9 and ABCB1 genotypes on fluoxetine plasma concentrations and clinical improvement in children and adolescent patients. The pharmacogenomics journal. 2014;14(5):457-62. Epub 20140325. doi: 10.1038/tpj.2014.12. PubMed PMID: 24663076.
2. Lee C-Y CI, Dinh JC, Brooks WM, Leeder SJ, and Lee P. Study of MR characteristics of anti-psychotic drugs using fluorine (19F) MR spectroscopy at 9.4T. Proc Int Soc Magn Reson Med. 2017;25(5625).
3. Vanhamme L, van den Boogaart A, Van Huffel S. Improved method for accurate and efficient quantification of MRS data with use of prior knowledge. J Magn Reson. 1997;129(1):35-43. doi: 10.1006/jmre.1997.1244. PubMed PMID: 9405214.
4. Stefan D, Cesare FD, Andrasescu A, Popa E, Lazariev A, Vescovo E, Strbak O, Williams S, Starcuk Z, Cabanas M, Ormondt Dv, Graveron-Demilly D. Quantitation of magnetic resonance spectroscopy signals: the jMRUI software package. Measurement Science and Technology. 2009;20(10):104035. doi: 10.1088/0957-0233/20/10/104035.
5. Richardson LP, McCauley E, Grossman DC, McCarty CA, Richards J, Russo JE, Rockhill C, Katon W. Evaluation of the Patient Health Questionnaire-9 Item for detecting major depression among adolescents. Pediatrics. 2010;126(6):1117-23. Epub 20101101. doi: 10.1542/peds.2010-0852. PubMed PMID: 21041282; PMCID: PMC3217785.
Figures