2393
Edited MRS of the Infant Brain on 28 Scanners1The Russell H. Morgan Department of Radiology and Radiological Science, Johns Hopkins University School of Medicine, Baltimore, MD, United States, 2F.M. Kirby Research Center for Functional Brain Imaging, Kennedy Krieger Institute, Baltimore, MD, United States, 3Developing Brain Institute, Children’s National Hospital, Washington D.C., DC, United States, 4Departments of Radiology, The George Washington University School of Medicine and Health Sciences, Washington D.C., DC, United States, 5Departments of Pediatrics, The George Washington University School of Medicine and Health Sciences, Washington D.C., DC, United States, 6Fetal-Neonatal Neuroimaging and Developmental Science Center, Boston Children's Hospital, Boston, MA, United States, 7Department of Radiology, Harvard Medical School, Boston, MA, United States, 8Department of Radiology, University of Pennsylvania, Philadelphia, PA, United States, 9Lurie Family Foundations MEG Imaging Center, Department of Radiology, Children's Hospital of Philadelphia, Philadelphia, PA, United States, 10Masonic Institue for the Developing Brain, University of Minnesota, Minneapolis, MN, United States, 11Advanced Magntic Resonance Imaging and Spectroscopy Facility, McKnight Brain Institue, University of Florida, Gainesville, FL, United States, 12GE HealthCare, Munich, Germany, 13Wellcome Centre for Integrative Neuroimaging, FMRIB, Nuffield Department of Clinical Neurosciences, University of Oxford, Oxford, United Kingdom, 14Department of Radiology and Pediatrics, Children's Hospital Los Angeles, Los Angeles, CA, United States, 15University of Southern California, Los Angeles, CA, United States
Synopsis
Keywords: Spectroscopy, Data Analysis, Neonatal, Data Acquisition, Data Processing
Motivation: The Healthy Brain and Child Development (HBCD) study is a longitudinal, multi-vendor, multi-site study of early brain development, which will enroll ~7,500 infants. HBCD includes MRS within the imaging protocol.
Goal(s): The goal of this abstract is to present HBCD MRS pilot data, and identify any vendor and site differences in MRS data quality and measured metabolite concentrations.
Approach: HBCD pilot MRS data were successfully acquired on 28 scanners, and analyzed using Osprey 2.5.0, to examine vendor and site differences.
Results: ANOVA results show minimal vendor and site differences which is encouraging for such a large-scale multi-site, multi-vendor study.
Impact: HBCD is an NIH-funded multicenter study of brain development across the first decade of life. It is the largest ever study to incorporate MRS. In this abstract, we present in vivo data demonstrating MRS performance across vendor and site.
Introduction
The first decade of life is a critical period of neurodevelopment during which the brain undergoes structural and functional changes, including growth, synaptogenesis, oligodendrogenesis, and pruning1,2. 1H MRS is a powerful technique for understanding normal neurometabolic development and establishing biomarkers for dysfunctional development3,4. The Healthy Brain and Child Development (HBCD) study is the largest, long-term study of early brain and child development in the United States. The aim of the study is to elucidate how genes and environment shape brain development from the prenatal period through childhood. The overarching goal is to recruit a cohort of 7,500 pregnant women across 25 sites (on 28 scanners) and to follow them and their children through the first decade of life. The longitudinal study will include MRS at four timepoints: birth to 4 years of age. The prime MRS specification is to measure biomarkers of neurotransmitter dysfunction (g-aminobutyric acid, GABA; glutamate, Glu) and oxidative stress (glutathione, GSH; and ascorbate, Asc). The HBCD MRS protocol employs HERCULES5,6 (Hadamard Editing Resolves Chemicals Using Linear-combination Estimation of Spectra) and unedited PRESS to reliably measure these brain chemicals at 3T. In a multi-vendor, multi-site study such as the HBCD study, it is essential to characterize data quality across sites and assess site and vendor differences in metabolite quantification. This abstract reports on PRESS and HERCULES data collected during the pilot phase (November 2022 to July 2023) of the HBCD study in 100 infants on 28 scanners.Methods
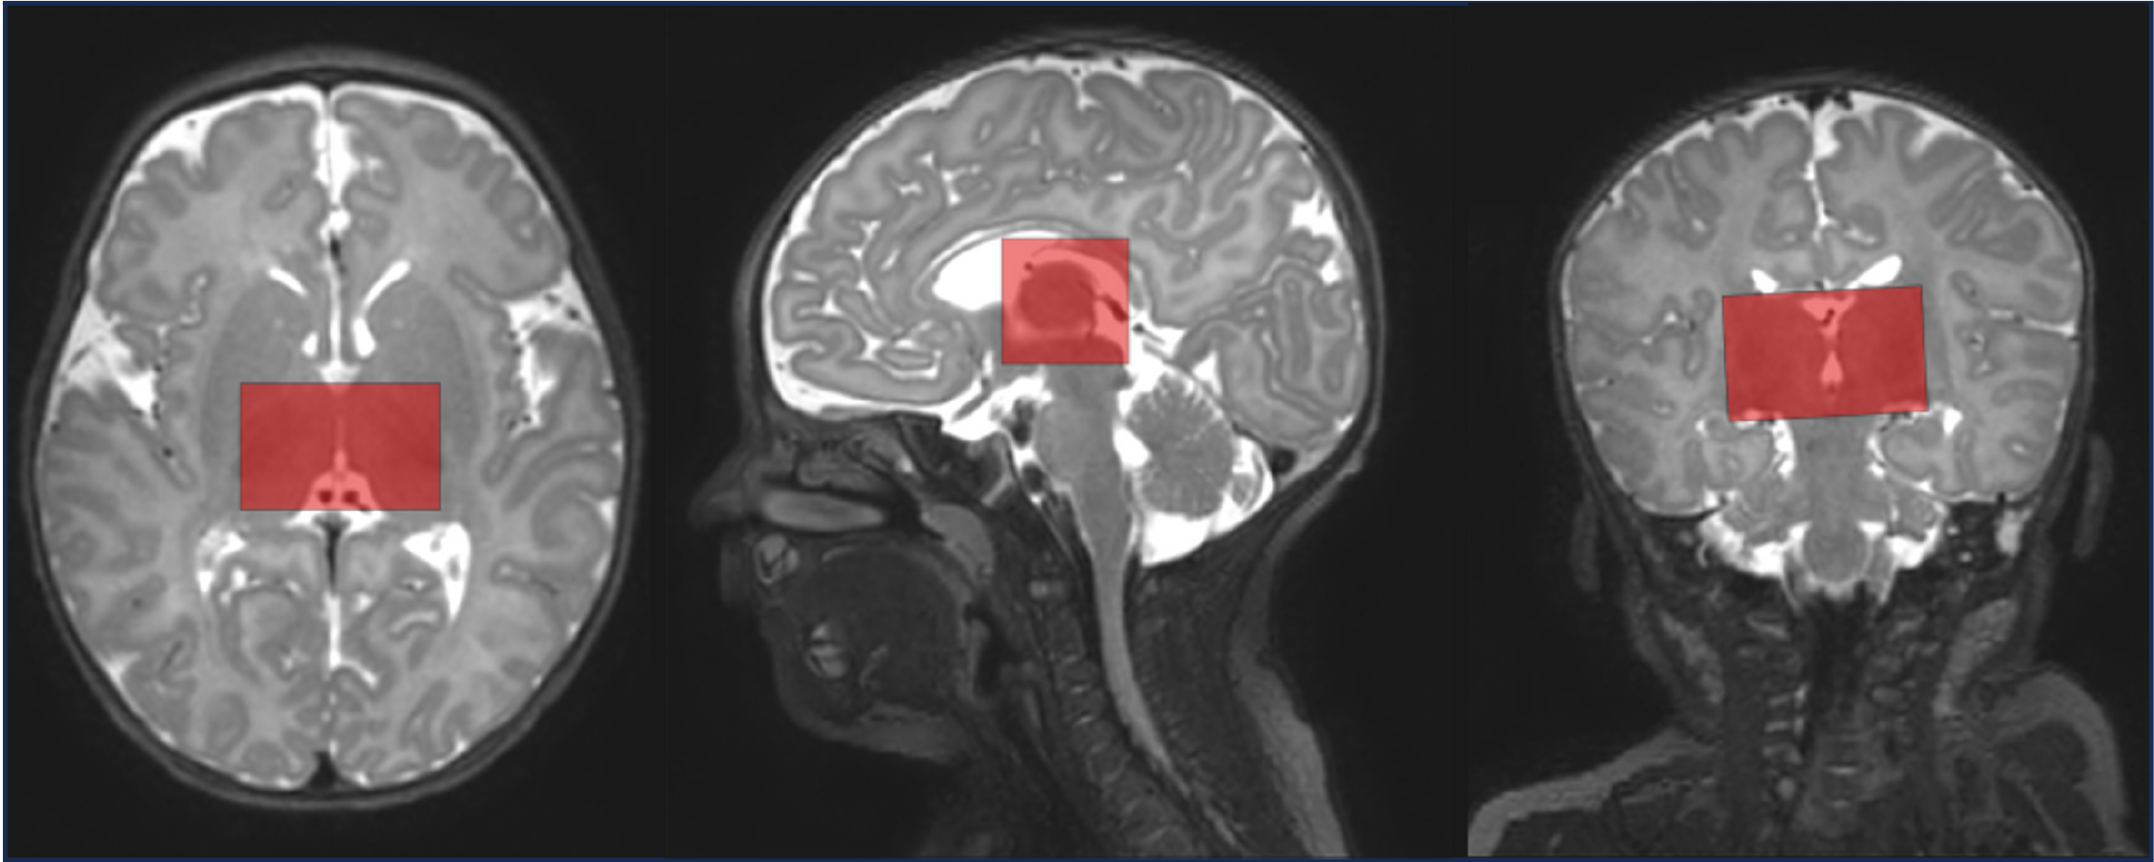
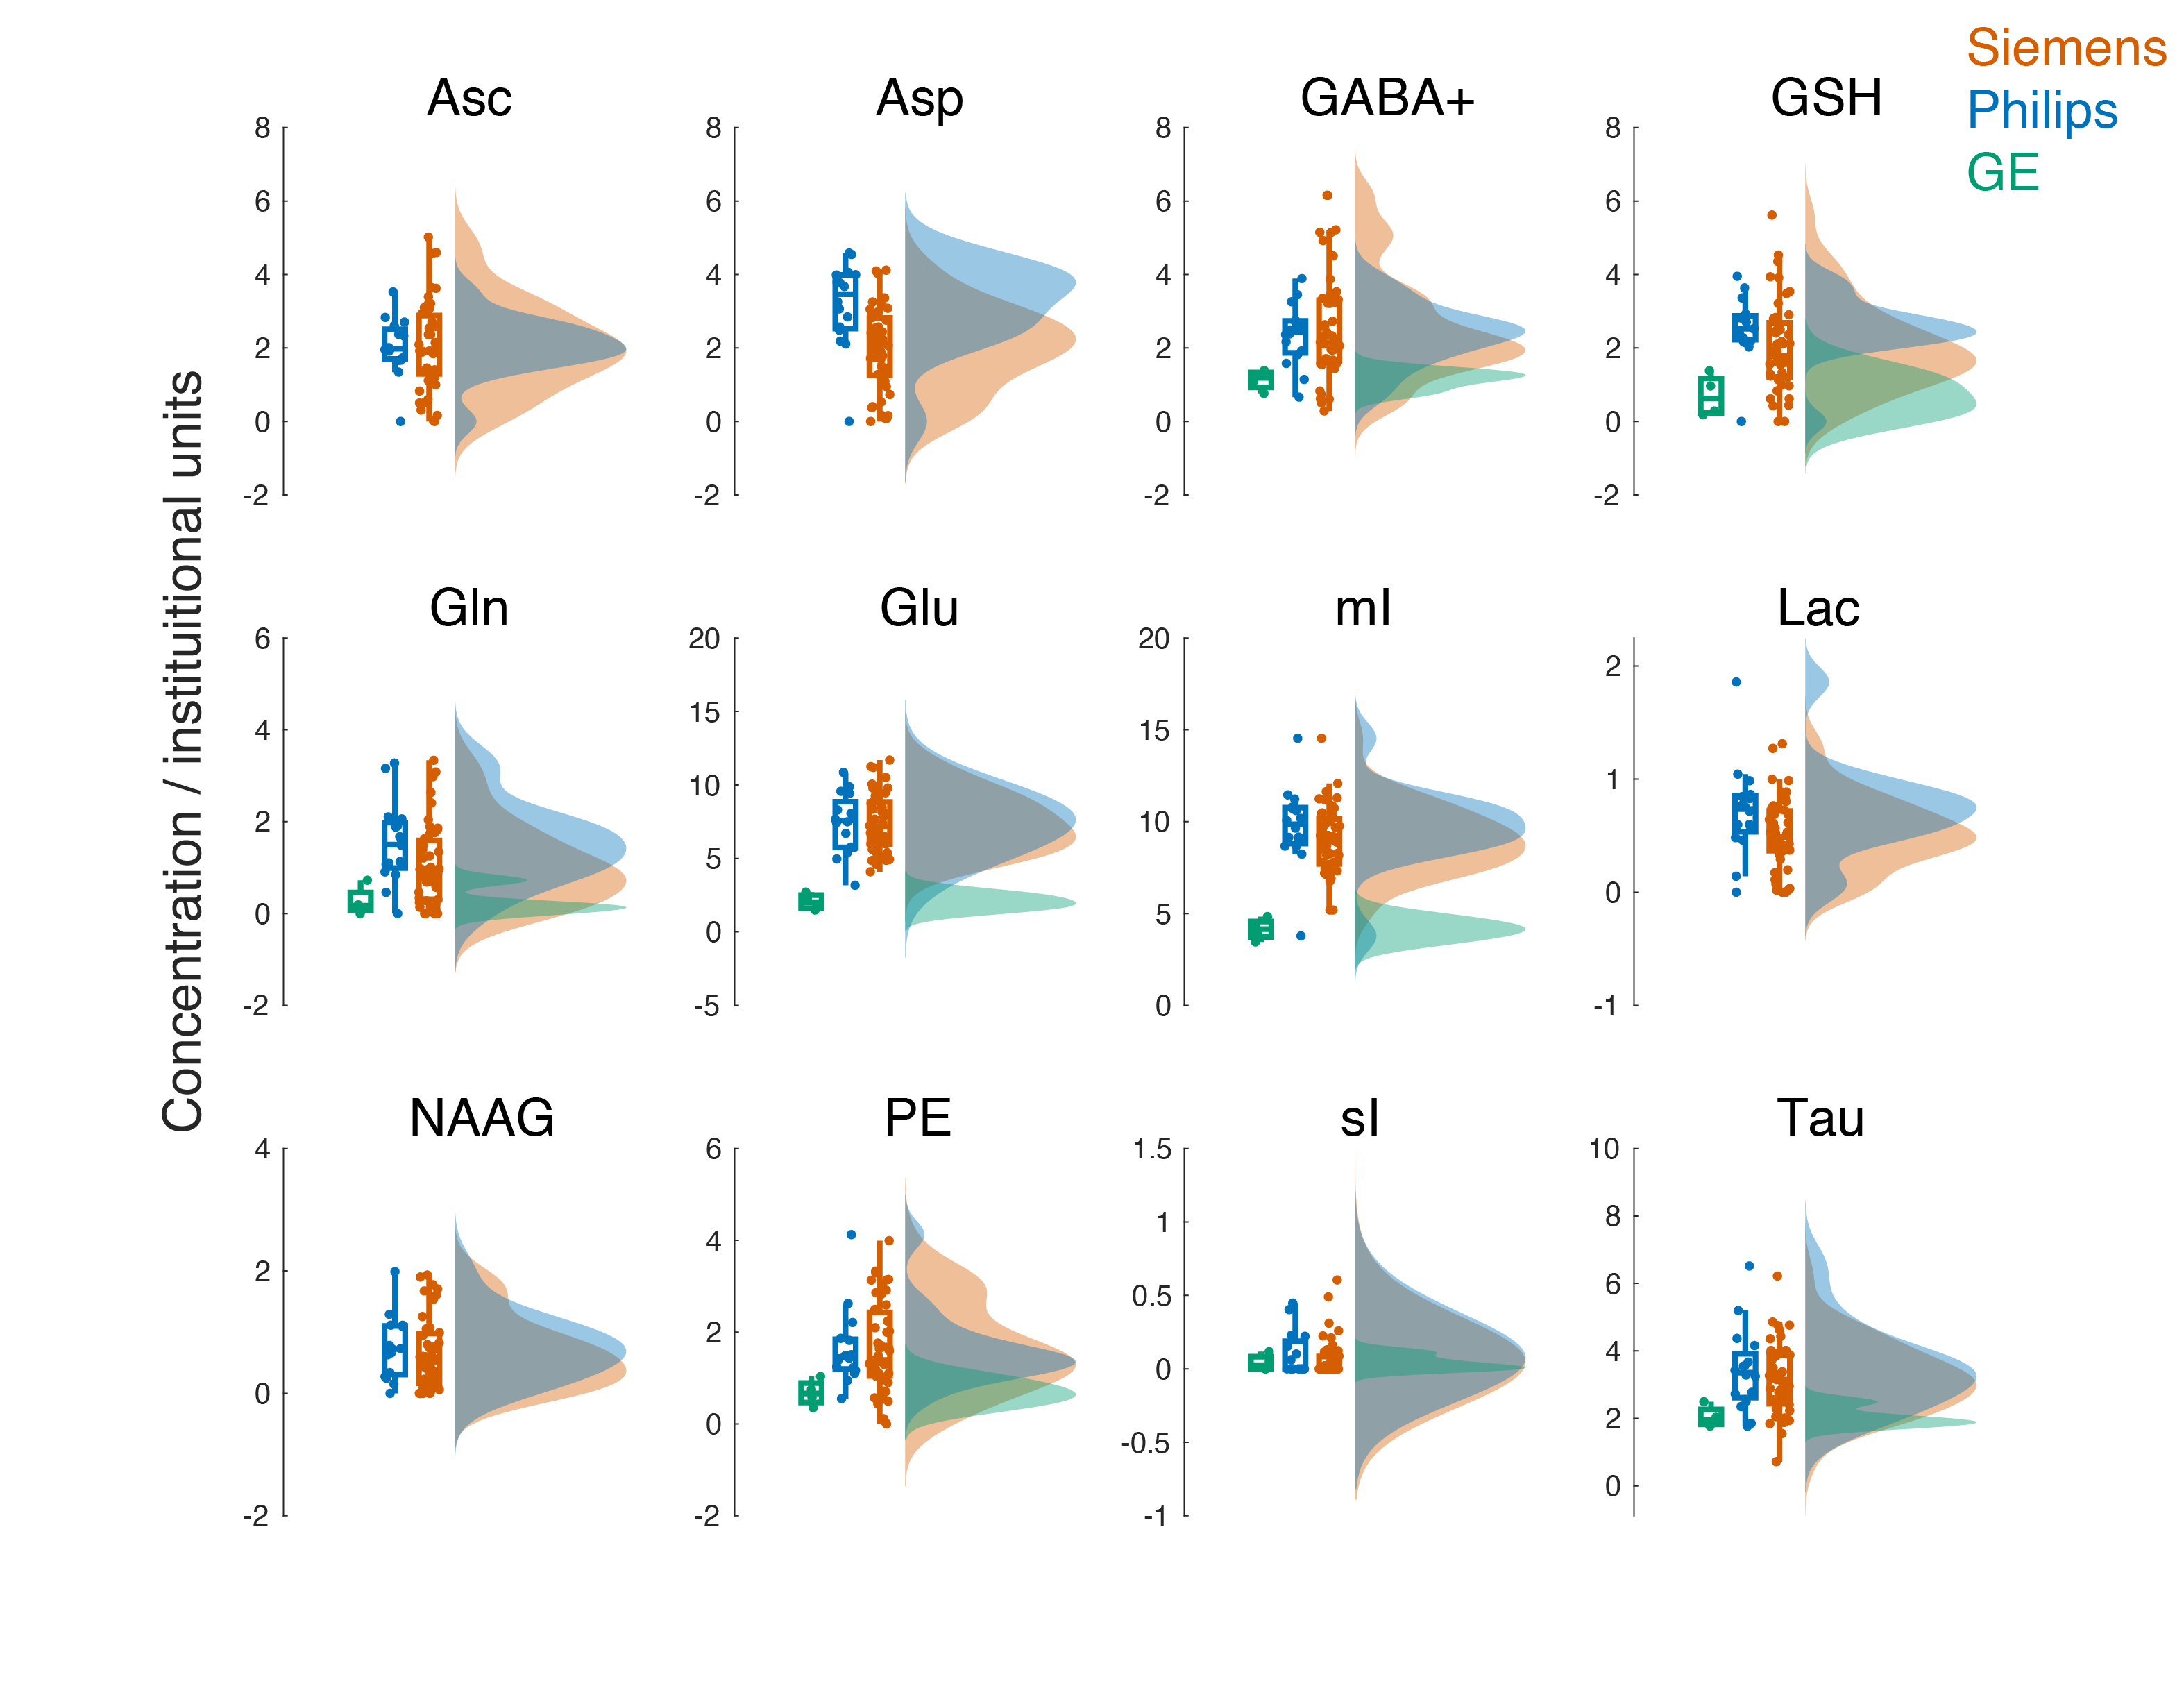
The 28 scanners consist of 20 Siemens, 6 Philips, and 2 GE scanners. The core MRS protocol was developed by the HBCD MRS Working Group in phases from October 2021 to July 2023. The scan protocol was developed and optimized to facilitate quality measurements in infants. MRS data were acquired from a 30x23x23 mm3 voxel in the bilateral thalamus region (Figure 1), using PRESS (TE/TR: 35/2000 ms, 32 transients) and HERCULES (TE/TR: 80/2000 ms, 224 transients) sequences with a total acquisition time of <9 minutes. GE sites used HERMES7 in place of HERCULES, with acquisition parameters matched. Four water reference transients were acquired at TE 35 and 80 ms. All Philips and 6 Siemens sites used the ISTHMUS sequence (Integrated Short-TE and Hadamard Multi-Sequence) that packages these 4 different sequences into one. This combined MRS acquisition sequence will be used for the main HBCD study by all the sites. In total, 79 (from 24 scanners: Siemens S1-S18, Philips P1-P4, GE G1-G2) and 67 (from 22 scanners) PRESS and HERCULES/HERMES datasets respectively were considered for analysis, out of 82 PRESS and 72 HERCULES datasets exported correctly and passing quality control (tCr linewidth<7.5 Hz; acceptable lipid contamination). Spectra were pre-processed and modeled using Osprey 2.5.08. Metabolite concentrations are quantified in institutional units, relative to water. ANOVA testing, followed by multiple comparisons correction, was applied to concentrations, grouped according to vendor and scanner. tNAA, tCr, tCho, Glx, mI, and sI were considered from PRESS data; NAA, tCr, tCho, mI, sI, PE, Tau were considered from HERCULES sum spectra; GABA+ was considered from HERCULES GABA-edited (diff1) spectra, and GSH from GSH-edited (diff2) spectra. Asc, Asp, NAAG, and Lac from diff2 spectra were considered for HERCULES data.Results
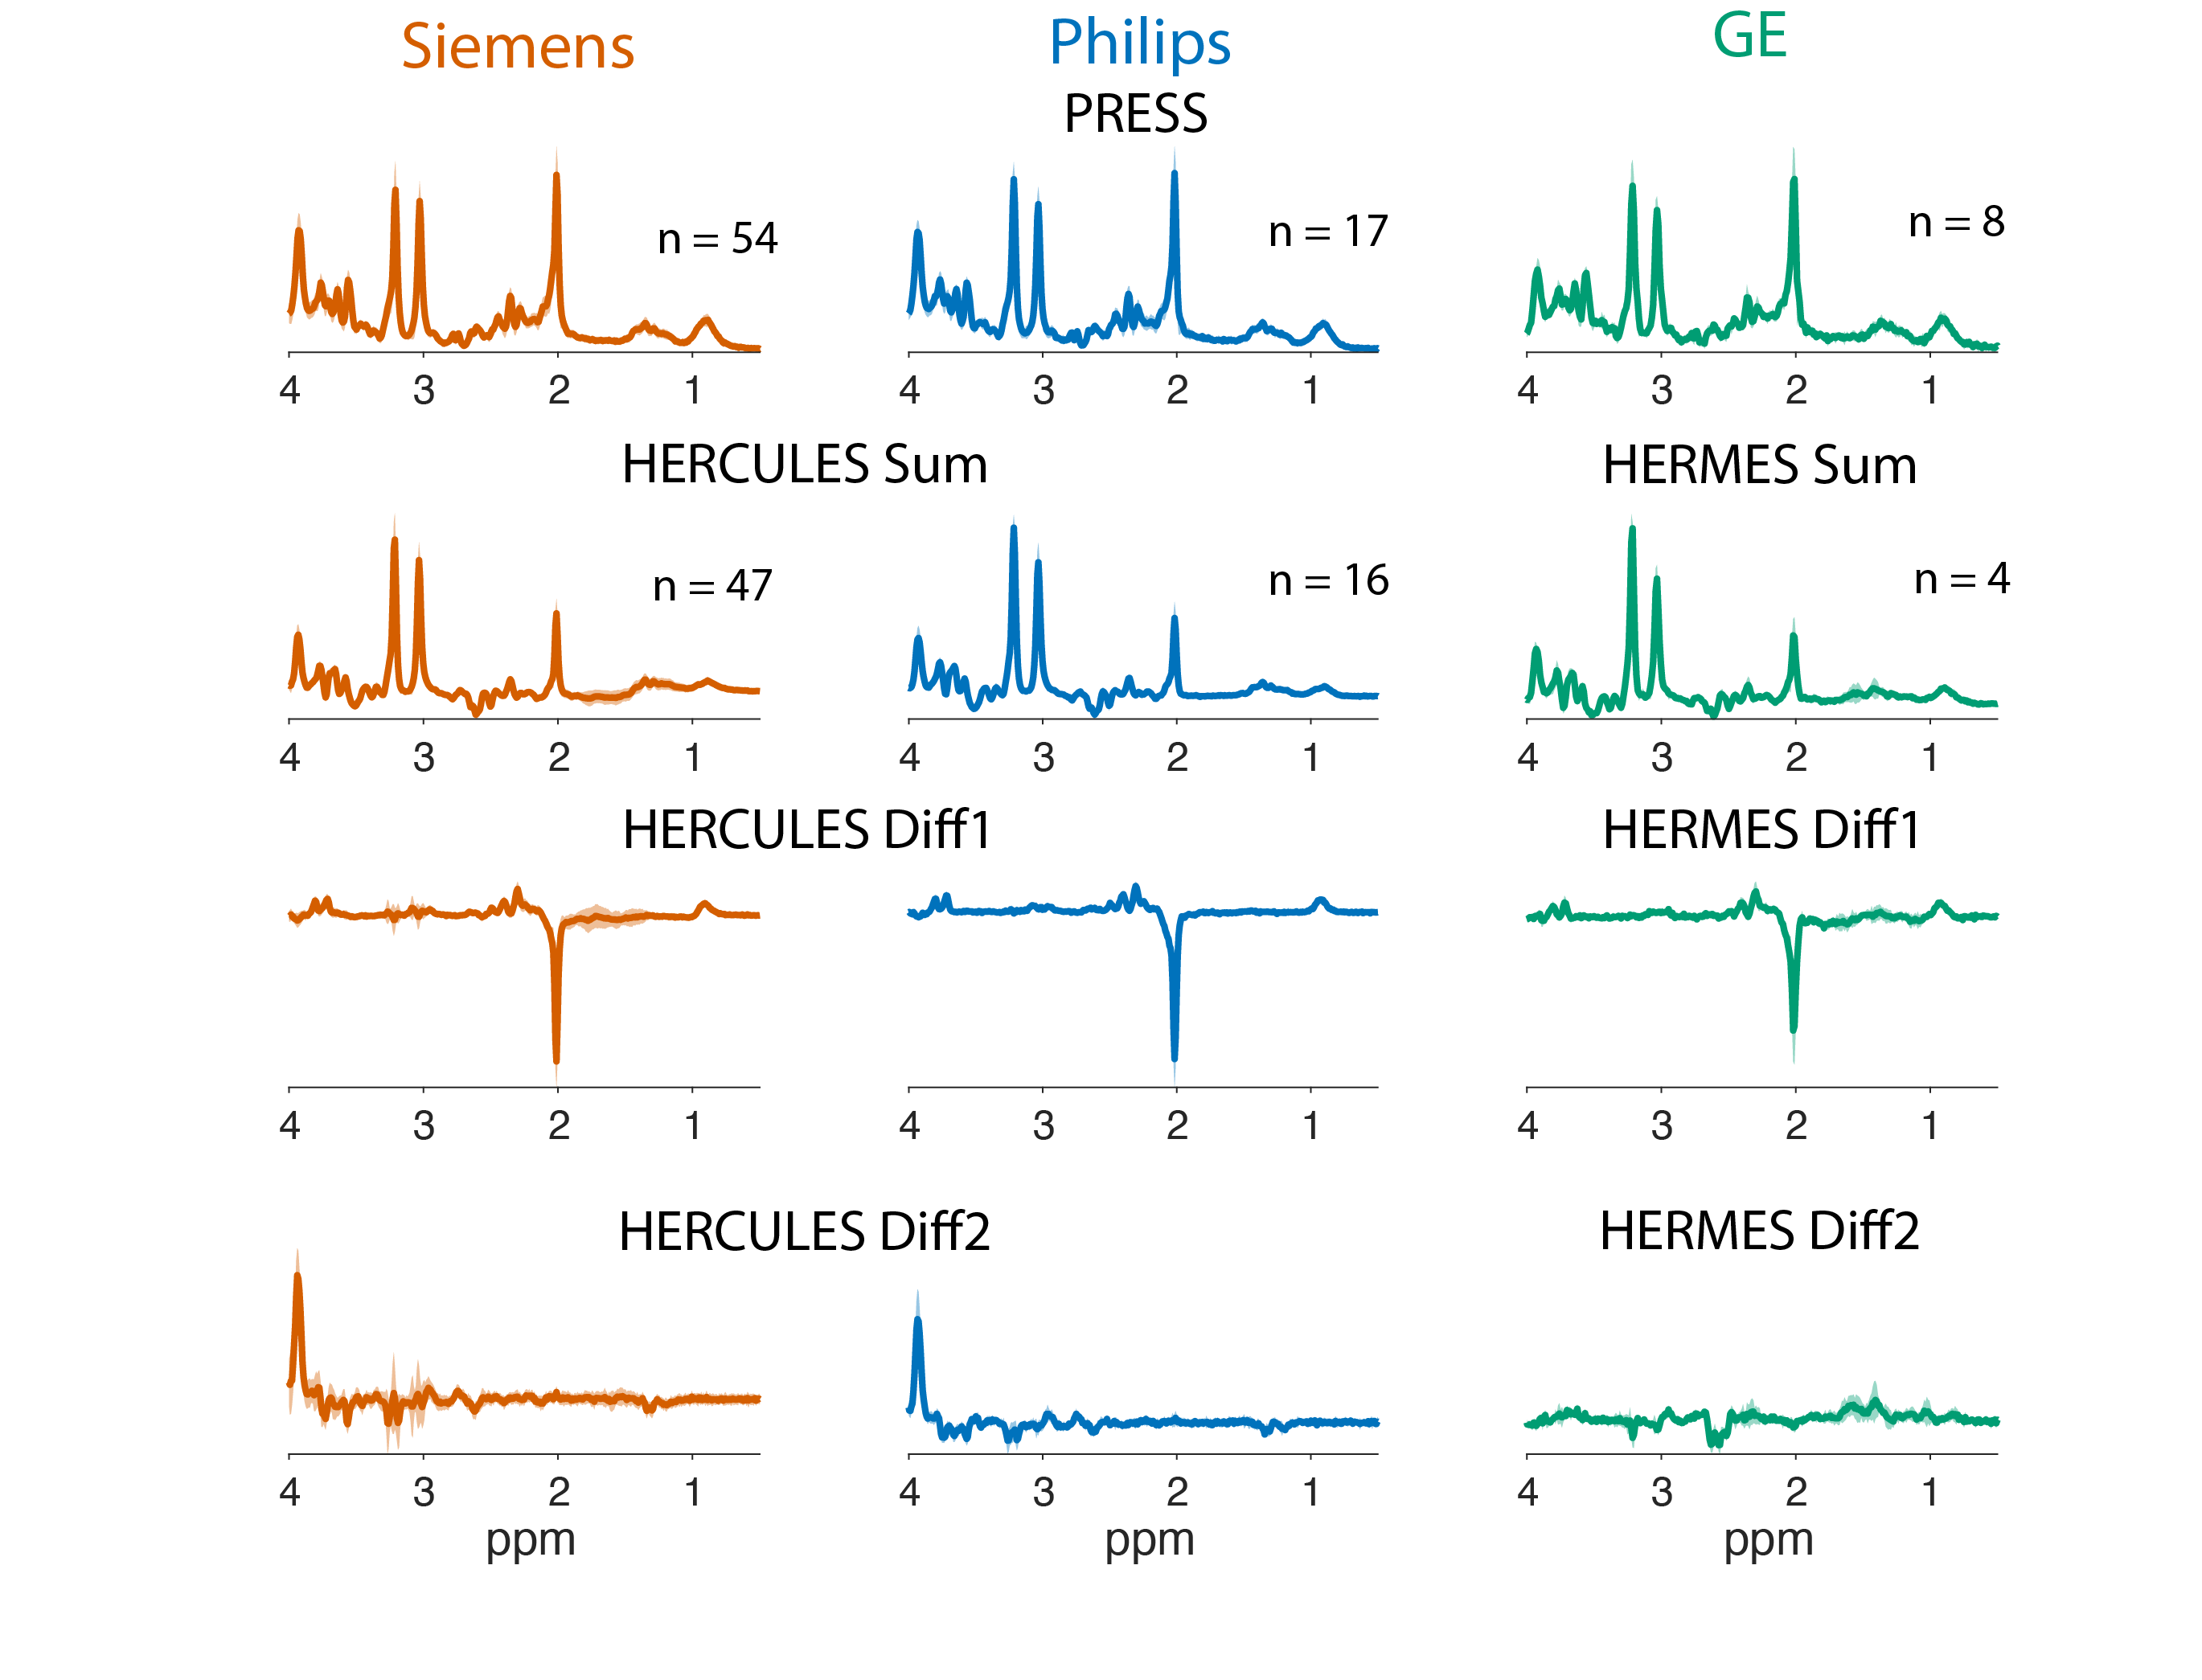
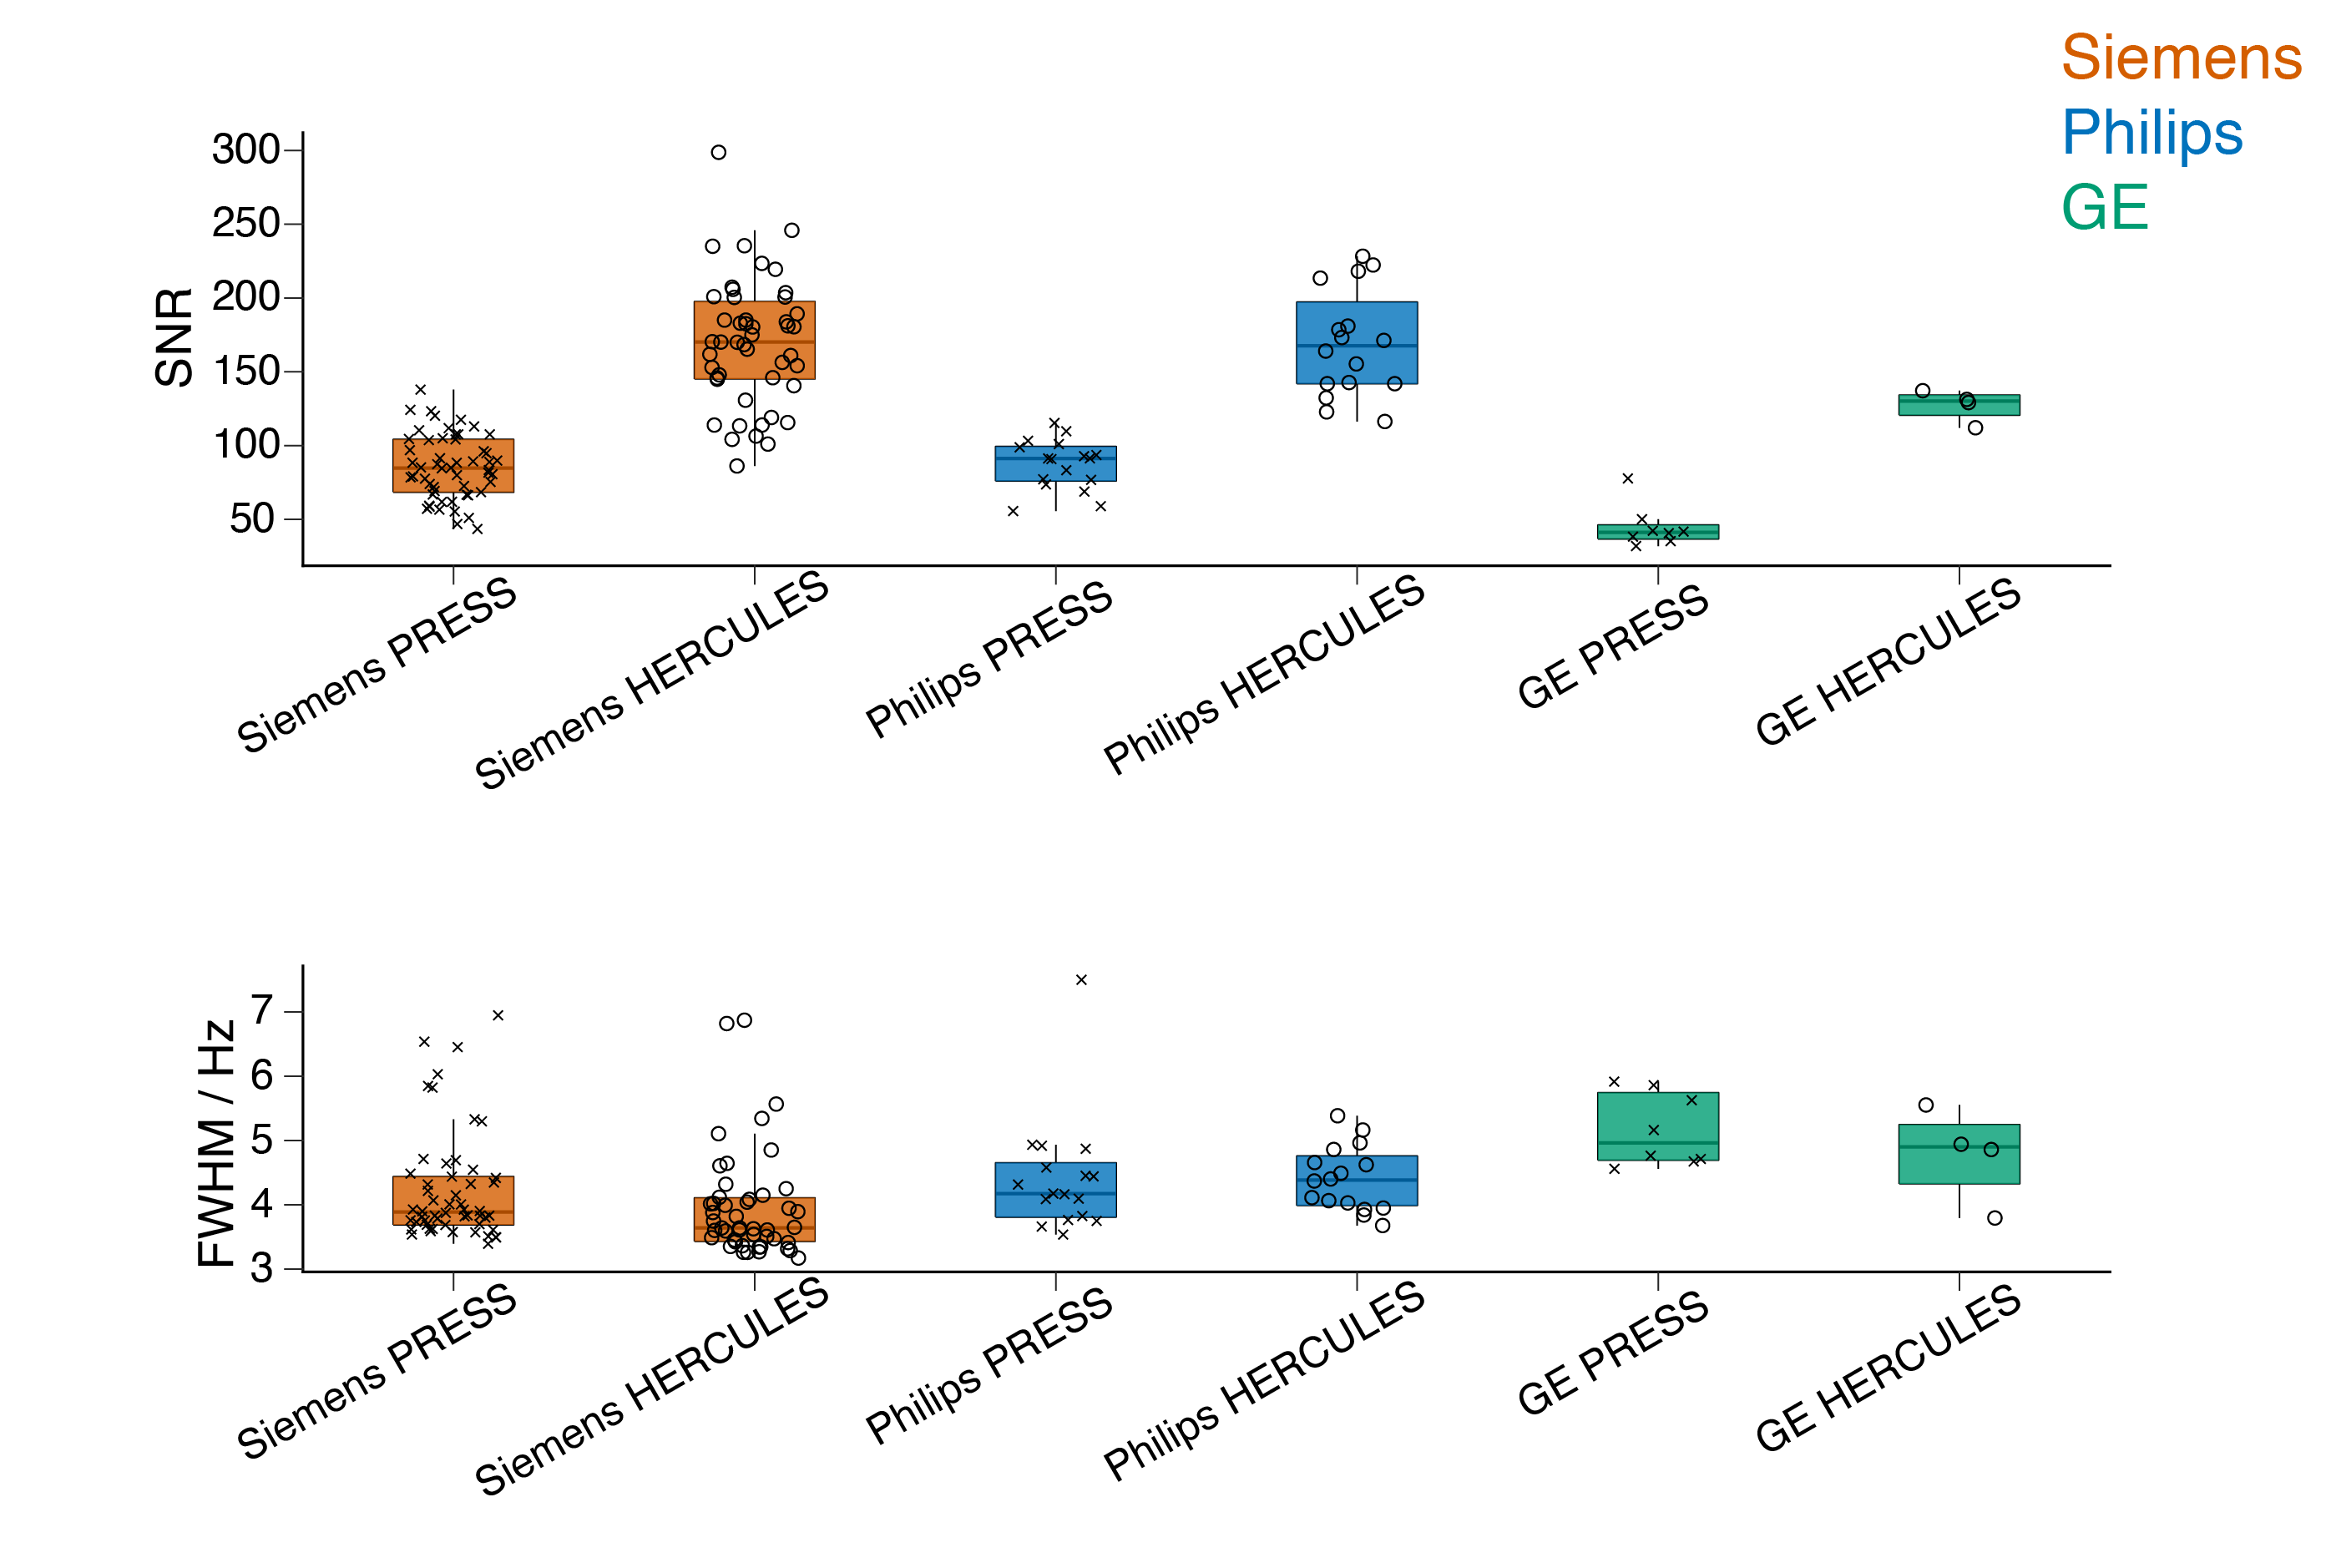
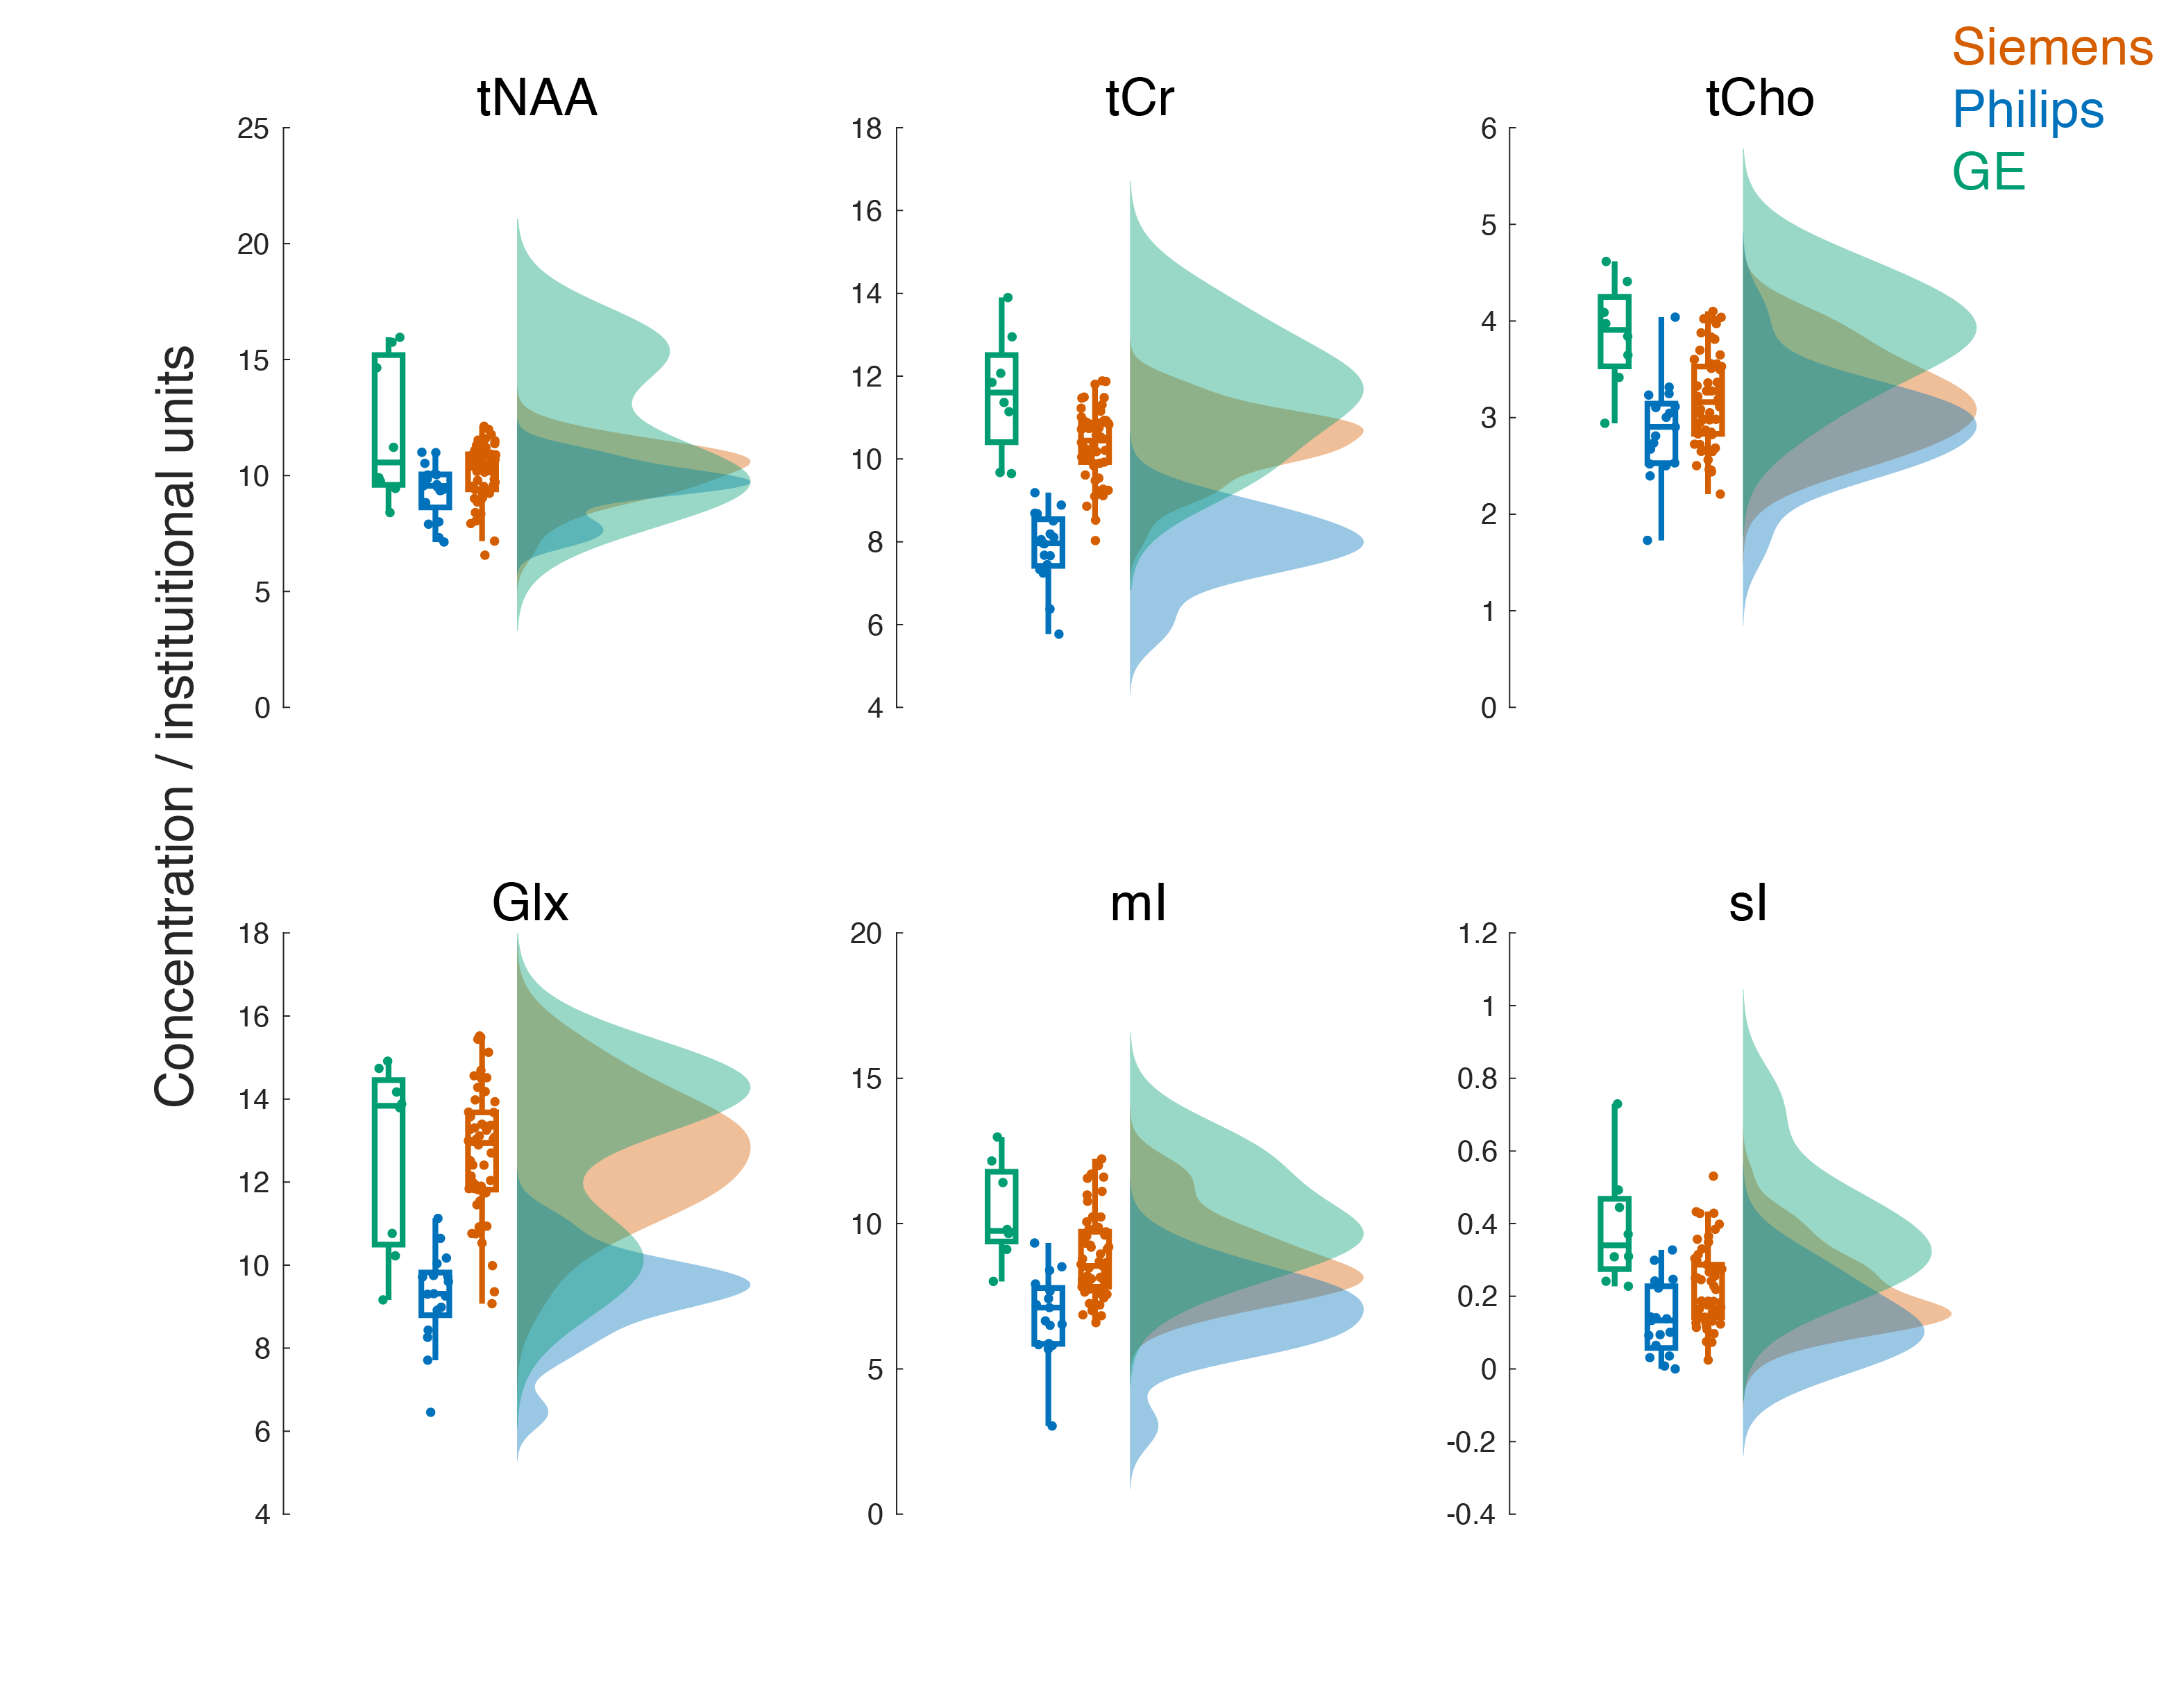
MRS data were successfully acquired on 0-12 months old infants. PRESS and HERCULES spectra grouped by vendor are plotted in Figure 2. A vendor comparison of tCr SNR and FWHM for PRESS and HERCULES data is shown in Figure 3. Concentration plots, colored by vendor, are presented in Figures 4 and 5. Significant differences in concentrations between sites were observed for: tNAA (G2 different from 3 sites), tCr (P4 different from 9 sites), Glx (G2 different from 3 sites), and mI (G2 and P4) from PRESS measurements; NAA (G1 different from 3 sites), tCr (S1 and G1), tCho (G1 and P1), and mI (G1 different from 2 sites) from HERCULES sum spectra; and Lac (P1 different from 8 sites) from diff2 spectra.Discussion
Overall, this dataset illustrates the successful completion of the pilot phase MRS acquisition for HBCD. Low-concentration metabolites were measured in a large-scale study of infants using HERCULES for the first time. In spite of sites of not having prior experience in infant or adult MRS, good levels of agreement between metabolite concentrations were seen across vendors and sites. This analysis has limitations; it focuses on the vendor and site effects in SNR, linewidth, and metabolite concentration, rules regarding data governance do not permit age-related analyses in this phase of HBCD. Since brain segmentation was not implemented during the pilot phase, concentrations were not corrected for tissue composition.Acknowledgements
P41 EB031771; R01 EB016089; R01 023963; R01 EB032788; R00 AG062230; R00 DA051315;
References
1. Song Y, Lally PJ, Yanez Lopez M, et al. Edited magnetic resonance spectroscopy in the neonatal brain. Neuroradiology. 2022:1-16.
2. Blüml S, Wisnowski JL, Nelson Jr MD, et al. Metabolic maturation of the human brain from birth through adolescence: insights from in vivo magnetic resonance spectroscopy. Cerebral Cortex. 2013;23(12):2944-2955.
3. Panigrahy A, Nelson MD, Blüml S. Magnetic resonance spectroscopy in pediatric neuroradiology: clinical and research applications. Pediatric radiology. 2010;40:3-30.
4. Blüml S, Saunders A, Tamrazi B. Proton MR spectroscopy of pediatric brain disorders. Diagnostics. 2022;12(6):1462.
5. Oeltzschner G, Saleh MG, Rimbault D, et al. Advanced Hadamard-encoded editing of seven low-concentration brain metabolites: Principles of HERCULES. Neuroimage. 2019;185:181-190.
6. Saleh MG, Rimbault D, Mikkelsen M, et al. Multi-vendor standardized sequence for edited magnetic resonance spectroscopy. Neuroimage. 2019;189:425-431.
7. Saleh MG, Oeltzschner G, Chan KL, et al. Simultaneous edited MRS of GABA and glutathione. Neuroimage. 2016;142:576-582.
8. Oeltzschner G, Zöllner HJ, Hui SC, et al. Osprey: Open-source processing, reconstruction & estimation of magnetic resonance spectroscopy data. Journal of neuroscience methods. 2020;343:108827.
Figures