2390
Spatiotemporal developmental pattern of brain myelination from 0 to 6 years old1Department of Biomedical Engineering, Zhejiang University, Hangzhou, China, 2Department of Biomedical Engineering, Johns Hopkins University School of Medicine, Baltimore, MD, United States
Synopsis
Keywords: Normal Development, Normal development, Infants, Myelination, Preterm, ASD
Motivation: Myelination in the human brain extends from late pregnancy to the end of adolescence. Yet, its developmental pattern during this period is not fully understand.
Goal(s): We use the BCP dataset to investigate early brain myelination between 0-6 years old.
Approach: We utilized T1-/T2-weighted intensity, a surrogate marker for myelin.
Results: We identified five spatial patterns with distinct developmental trajectories and investigated the biological implications of myelination on developmental diseases, finding that the myelin content of corpus callosum had a significant fully mediated effect on ASD-related indicators. Furthermore, we found an alternation of myelination development affected by preterm birth in a separate cohort.
Impact: We investigated myelination patterns in infants and toddlers by T1w/T2w based on the BCP dataset and identified five distinct regional developmental trajectories. Using a mediation analysis, we found an intrinsic association between myelination and ASD-related restricted repetitive behaviors.
Introduction
Myelination in the human brain extends from late pregnancy to the end of adolescence, with a peak observed in the first postnatal year1. Abnormalities that arise during early development can lead to long-term capacity deficiencies and developmental disorders. The T1-weighted (T1w) and T2-weighted (T2w) intensity ratio has been proposed as a sensitive measure for cerebral myelin content2,3 and has been widely used in adult studies4–6. However, the typical patterns of myelination and mechanisms of interaction with developmental outcomes during 0-6 years old are less understood.In this study, we investigated the longitudinal developmental process of cerebral myelin in the UNC/UMN Baby Connectome Project (BCP)7 based on the T1w/T2w method, characterized the spatial pattern of myelin maturation, and examined the relationship between myelination, behavioral assessments, and preterm-birth.
Methods
Normal developing subjects used in this study are collected from the BCP dataset, including 3D T1-MPRAGE images and 3D T2-SPACE images acquired on a 3T Siemens Prisma scanners. We excluded the subjects who (1) miss T1w or T2w image; (2) lack of basic demographic information; (3) failed image preprocessing; and (4) showed severe outliers in whole-brain signal. The remaining data consisted of 674 sessions from 308 individuals. An additional private data from 105 preterm infants (GA = 32.5±2.0 weeks) were collected from the Children's Hospital of Zhejiang University on a 3T Phillips Achieva scanner.The image processing procedure includes the following steps: (1) Skull stripping using IBEAT. (2) Alignment between T1w and T2w images. (3) N4ITK bias correction8 on the T1w and T2w image. (4) Alignment of images from individual space to 4D structural MRI atlas of BCP9.
Results
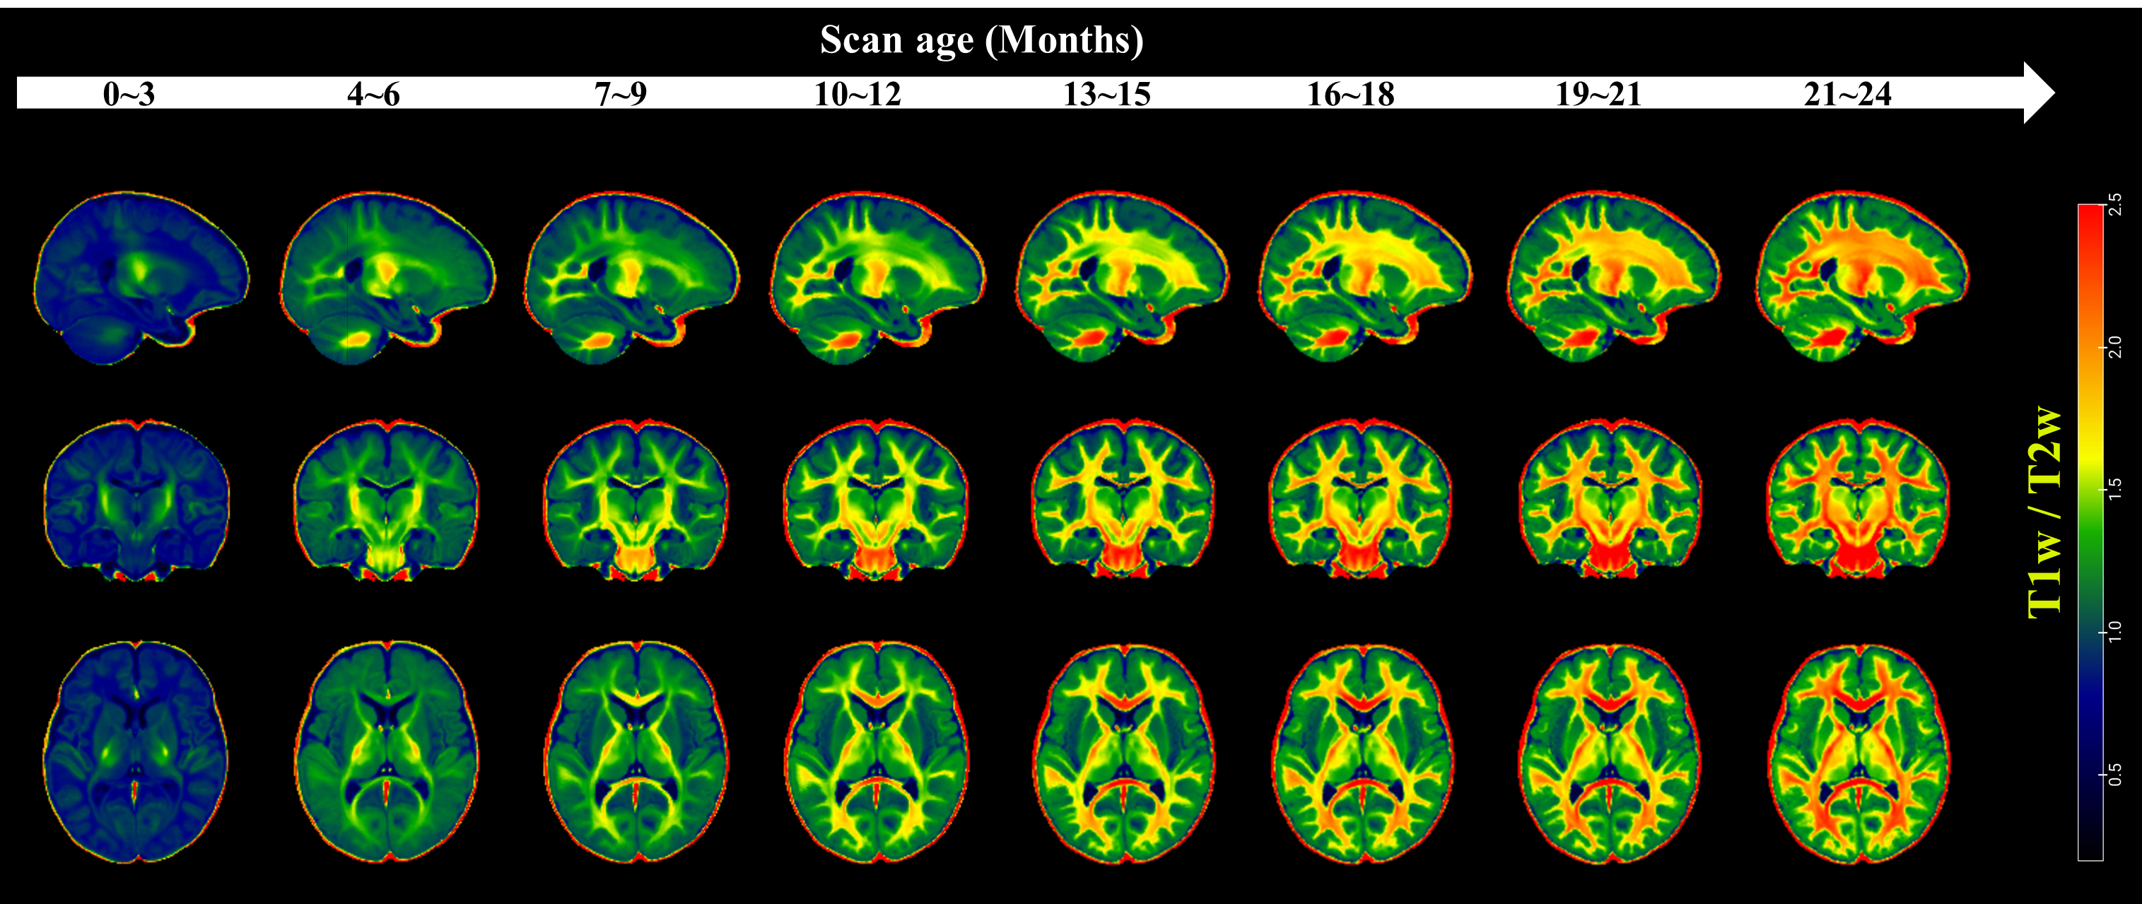
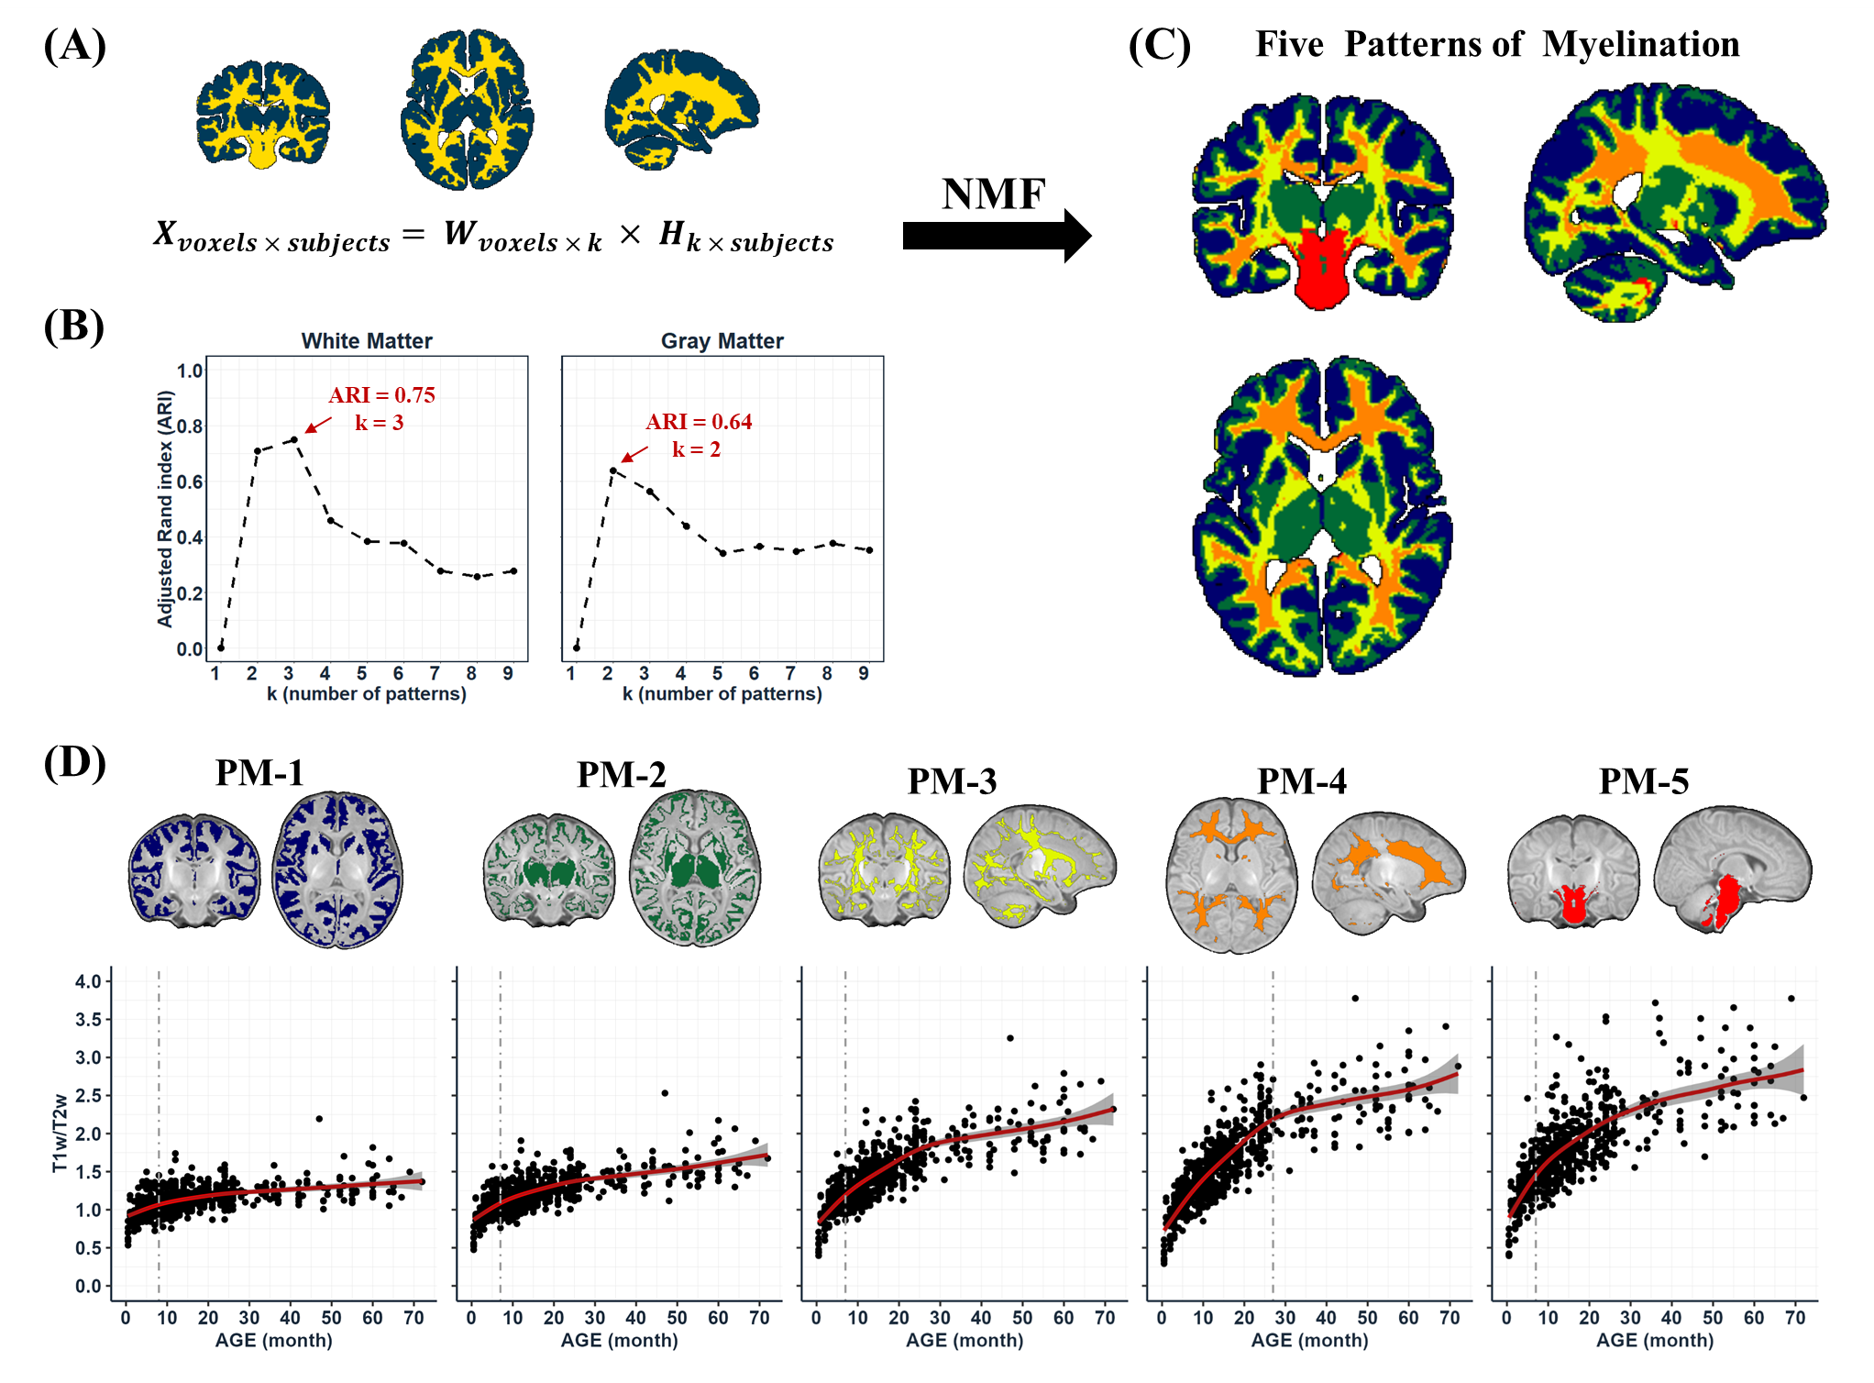
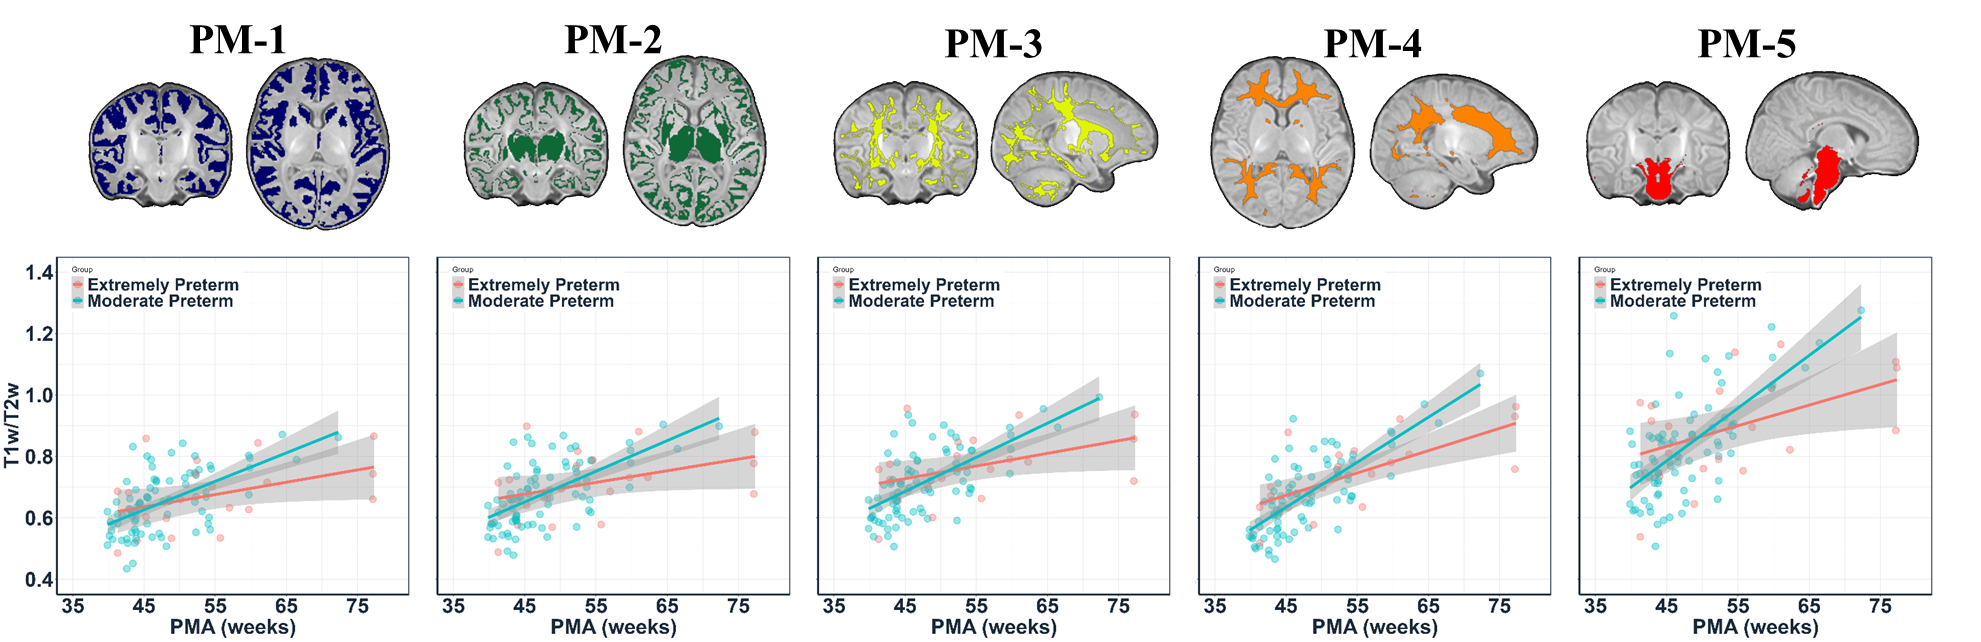
As shown in Fig 1, the formation of myelin in the brain varies regionally from 0-6 years old, and overall follows a developmental gradient from center to periphery, and from caudal to rostral.We performed a spatial clustering based on similarity of the developmental trajectories of myelination by non-negative matrix factorization (Fig 2A-C). The first pattern of myelination (PM-1) was associated with the outermost cortical gray matter, whereas PM-2 highlighted deep GM and the inner cerebral gyrus. PM-3 was mainly found in the internal capsule, which was myelinated significantly faster than gray matter. PM-4 was located in the corpus callosum and the corona radiata, and the inflection point of trajectory occurred after the age of two years, while inflection points of other PMs occurred in the first year. PM-5 was mainly in the brainstem and cerebellar peduncle and had the fastest rate of myelination (Fig 2D).
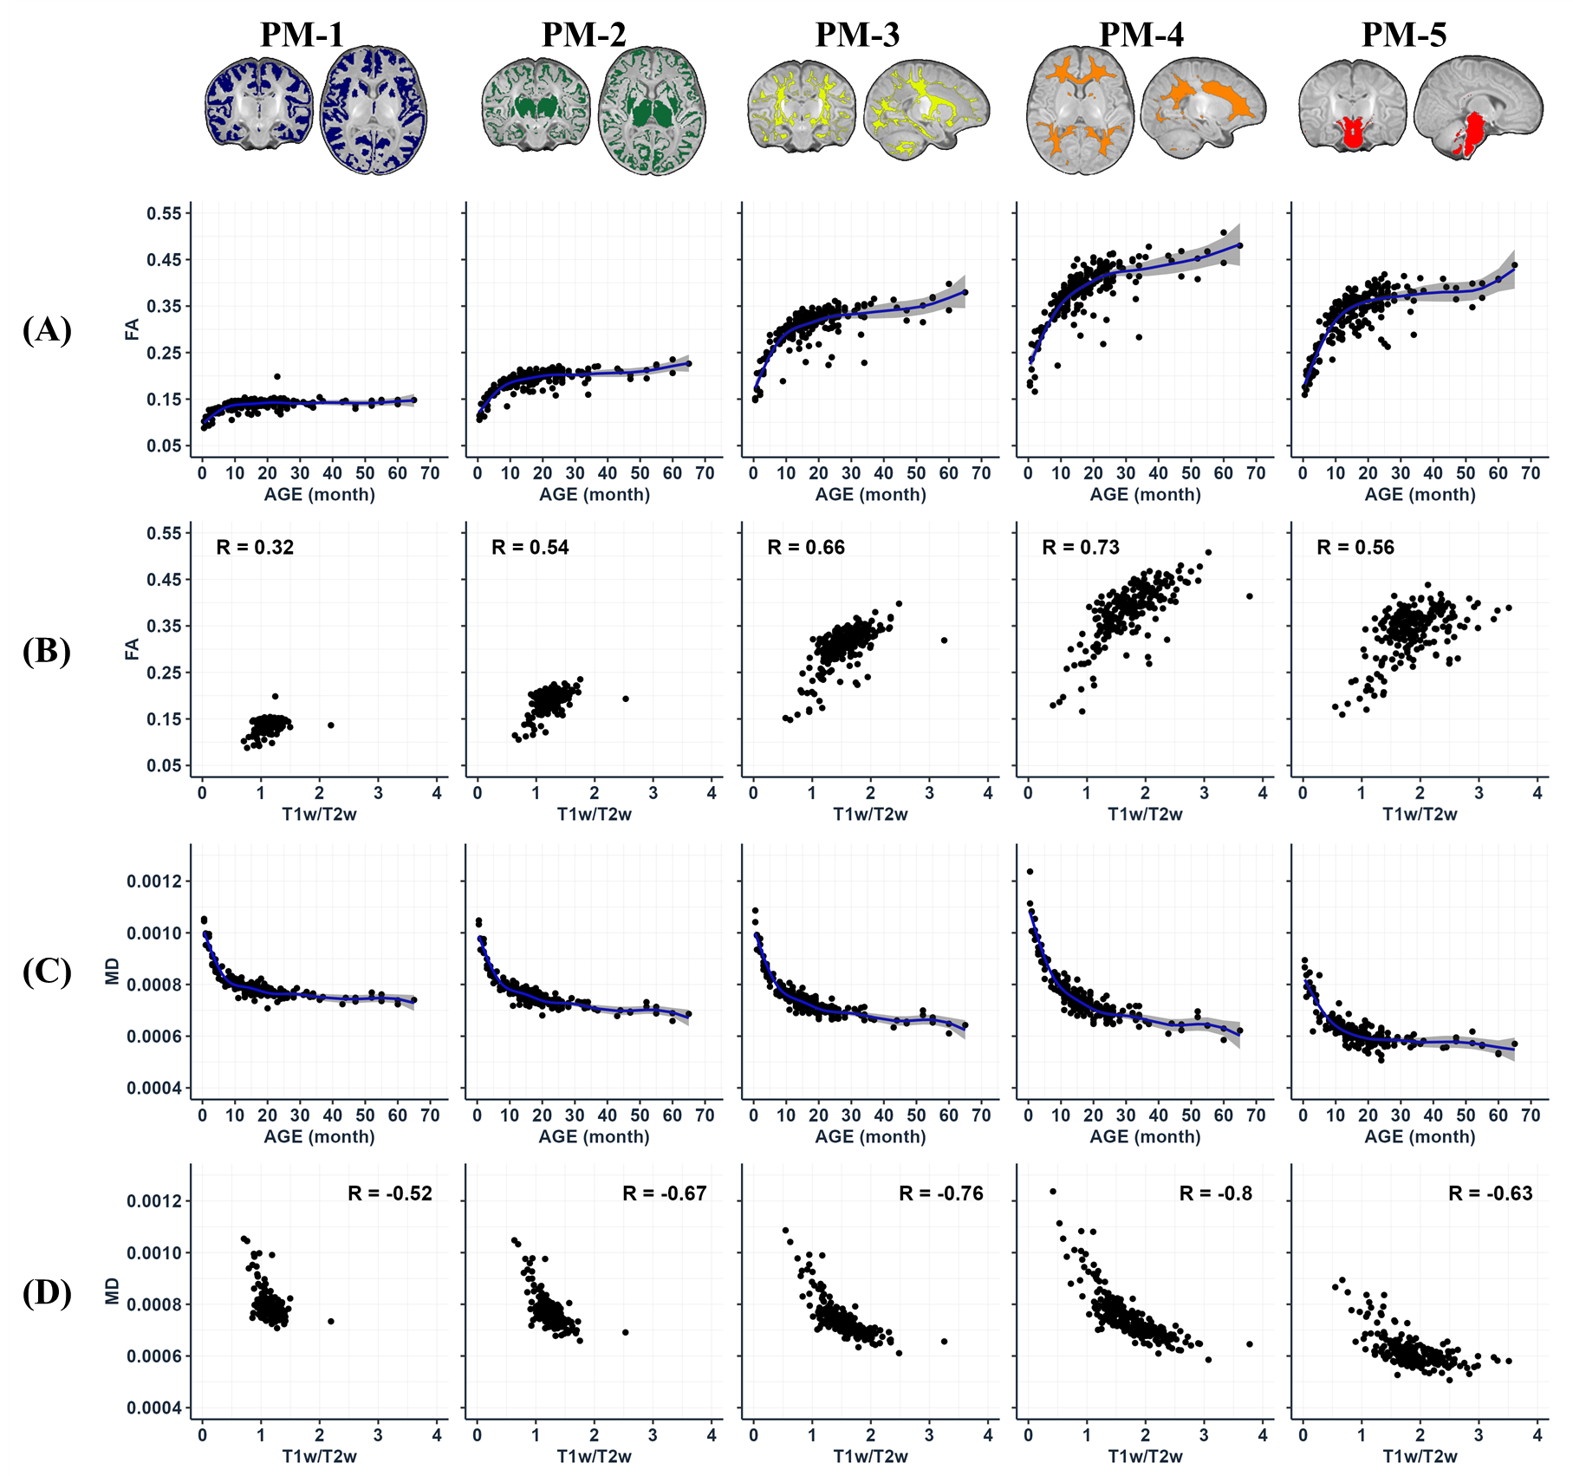
We then examined the DTI-based microstructural metrics in these five PMs, which are thought to also reflect myelination (Fig 3). The developmental trajectories of FA and MD were visually different from T1w/T2w measurement, with more pronounced and earlier inflection points. The association between T1w/T2w and FA or MD revealed a moderate and nonlinear correlation, with stronger correlation in PM-3 and PM-4 (major white matter bundles).
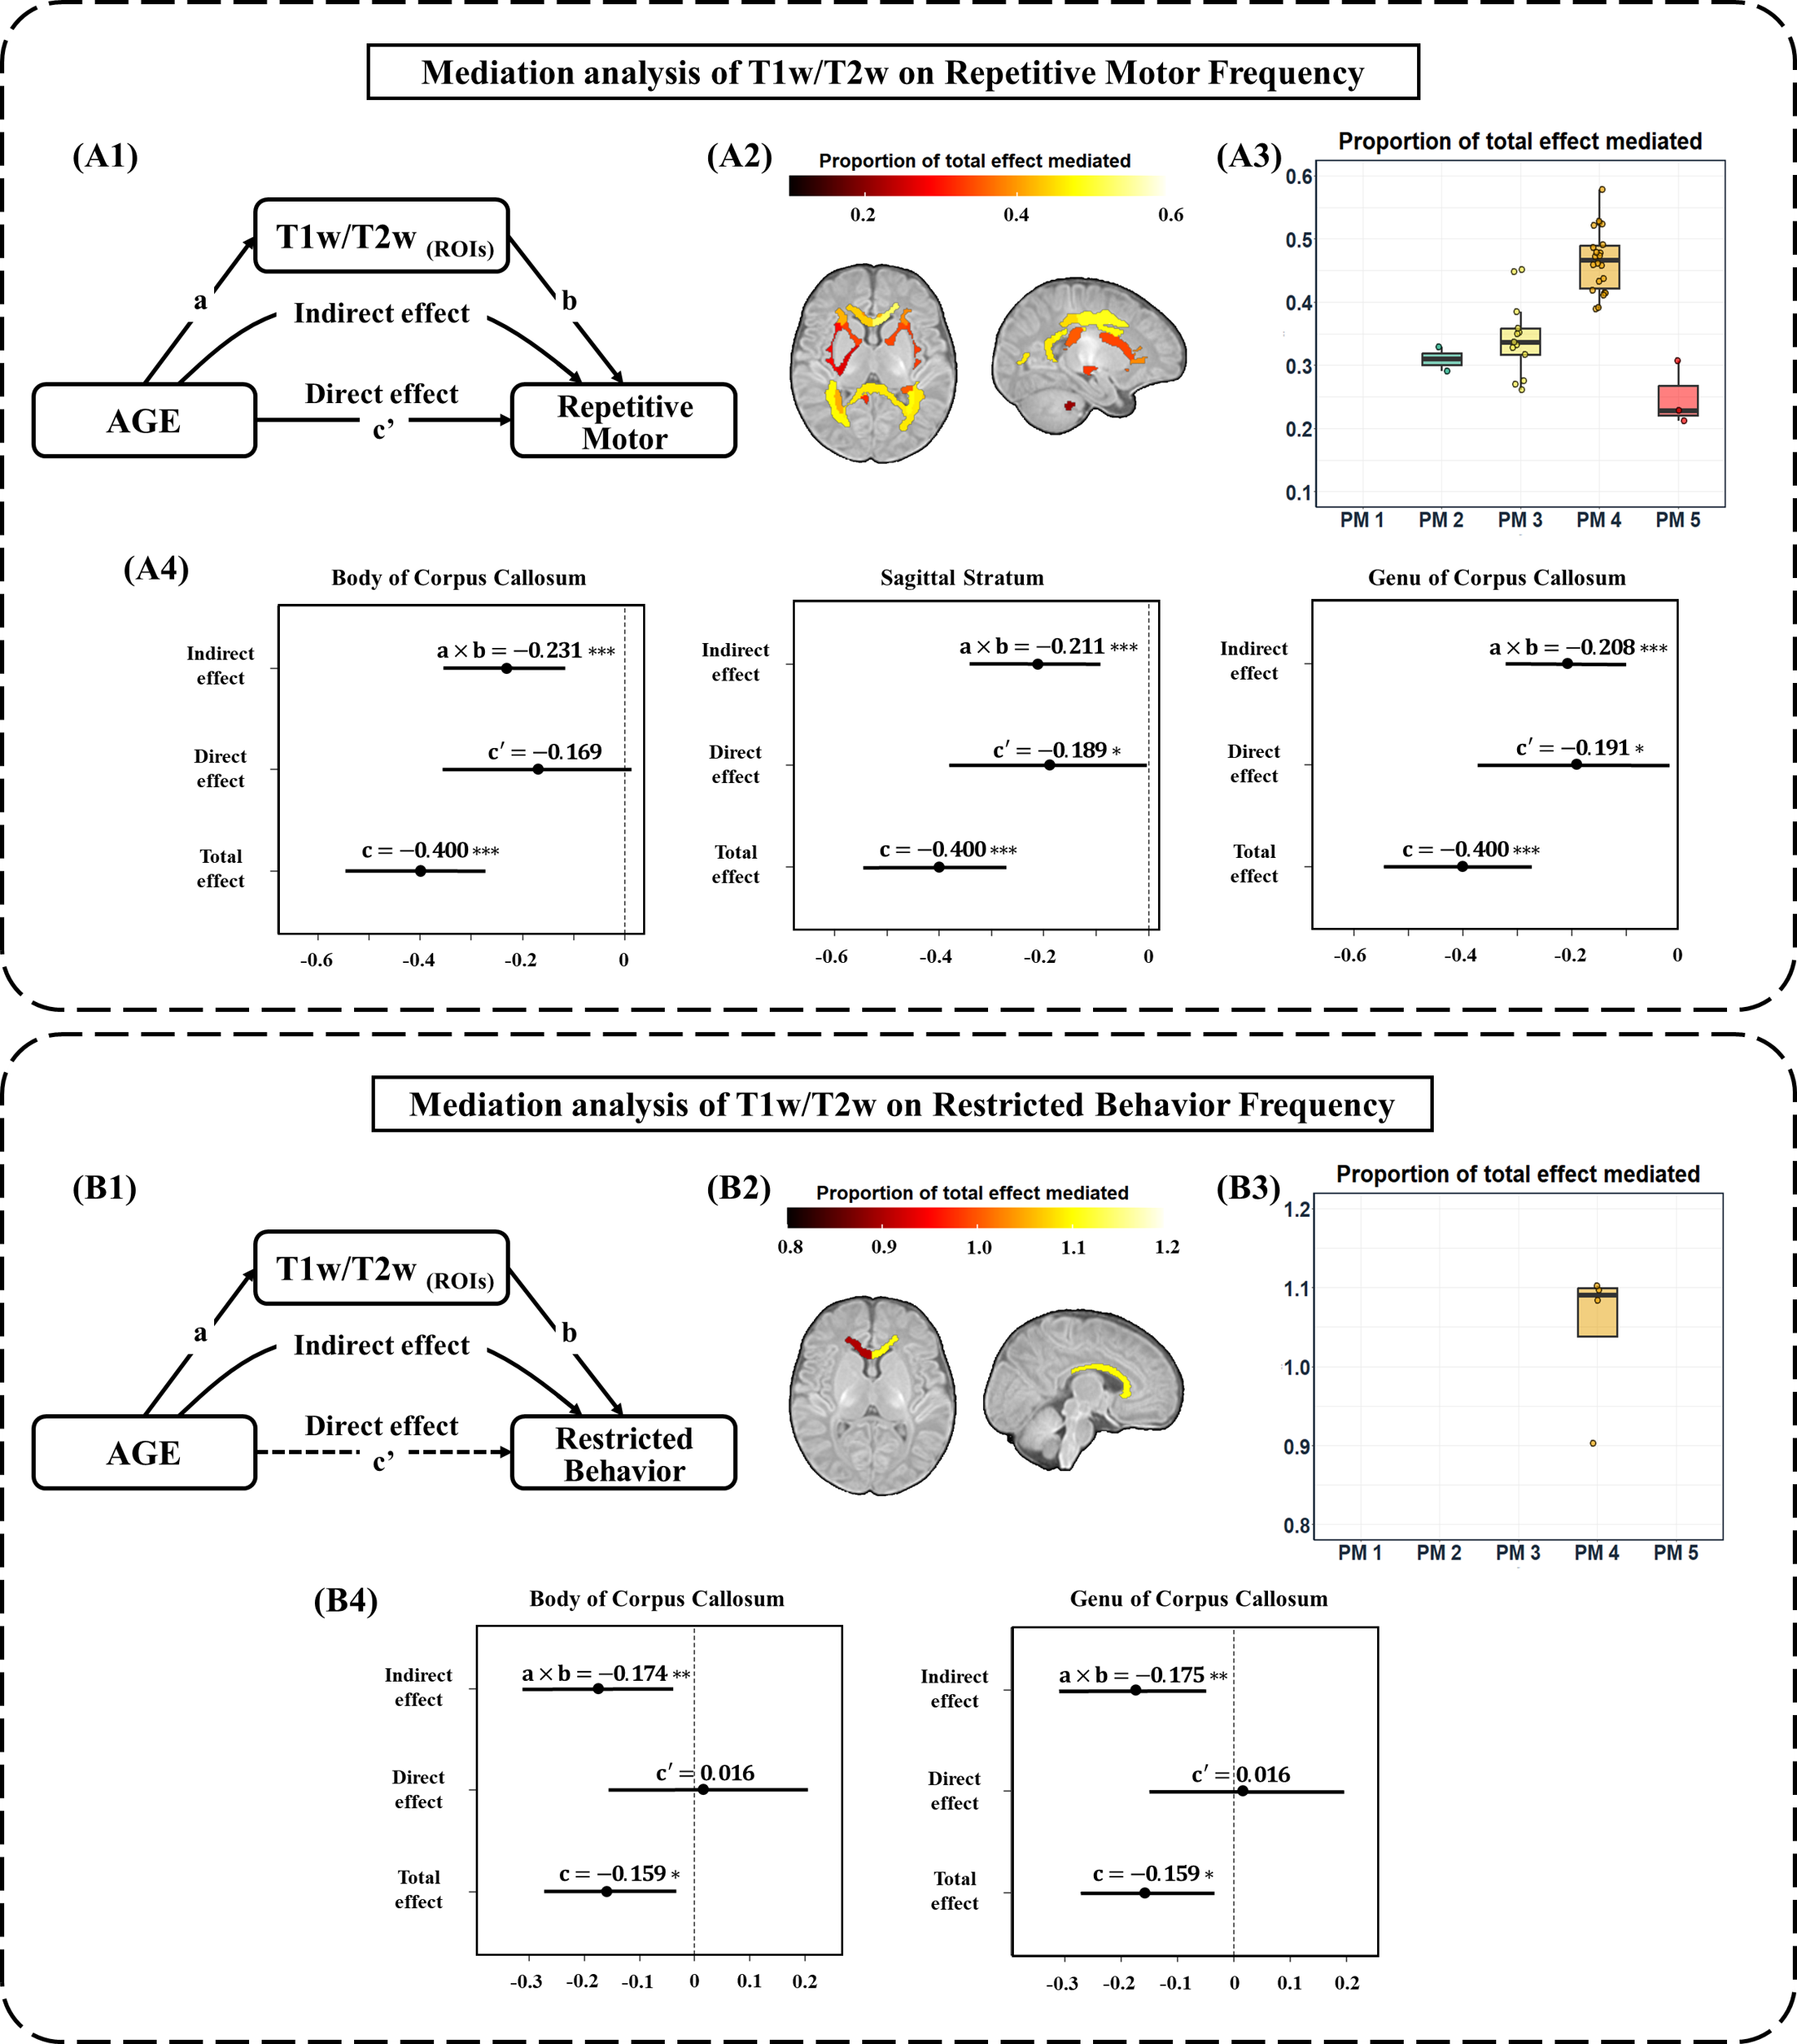
It was found that Repetitive Motor Frequency decreased with age (r = -0.39, p = 1.07×10⁻¹⁰) and negatively correlated with the concurrent myelination measure of brain regions (r between -0.43 and -0.16, p < 0.05, FDR corrected). We further employed mediation analysis and found a full mediating effect of T1w/T2w in the corpus callosum on the reduction of repetitive motor frequency and a significant partial mediating effect in some other regions in PM-3 and PM-4 (Fig 4A). Especially, PM-4 associated white matter region played a strong mediating effect (Fig 4A3). There was also a fully mediated effect of the myelination on the reduction of restricted behaviors in the body and genu of the corpus callosum bilaterally (Fig 4B).
We applied PM1-5 to a private database containing 105 preterm-born infants. We found that each PM pattern showed a significant reduced developmental rate in the extremely preterm-born (GA < 30.5weeks) than moderately preterm-born infants, which may be because myelination in some regions (the internal capsule in PM-3 and the cerebellum in PM-5) begins in mid-pregnancy, and the environmental changes resulting from preterm birth could disrupt and delay the normal process of myelination.
Discussion and Conclusion
We utilized T1w/T2w, a myelin estimation method to depict the brain myelination between 0-6 years old in the BCP dataset, and classified spatially heterogeneous developmental patterns into five categories. T1w/T2w was also found to be associated with preterm birth and autism-related indicators. These findings not only established patterns of spatial development of myelin content from infancy to toddlers for the first time, but also suggested the T1w/T2w based myelination measure can be a useful marker for developmental disorders.Acknowledgements
This work was supported by the Ministry of Science and Technology of the People’s Republic of China (2021ZD0200202), the National Natural Science Foundation of China (81971606, 82122032), and the Science and Technology Department of Zhejiang Province (202006140, 2022C03057). Data used in this article were obtained from the UNC/UMN Baby Connectome Project (BCP) (https://fnih.org/our-programs/baby-connectome-project), funded by NIH.References
- Dubois, J. et al. The early development of brain white matter: A review of imaging studies in fetuses, newborns and infants. Neuroscience 276, 48–71 (2014).
- Glasser, M. F. & Van Essen, D. C. Mapping human cortical areas in vivo based on myelin content as revealed by T1- and T2-weighted MRI. J. Neurosci. Off. J. Soc. Neurosci. 31, 11597–11616 (2011).
- Nakamura, K., Chen, J. T., Ontaneda, D., Fox, R. J. & Trapp, B. D. T1-/T2-weighted ratio differs in demyelinated cortex in multiple sclerosis. Ann. Neurol. 82, 635–639 (2017).
- Ganzetti, M., Wenderoth, N. & Mantini, D. Mapping pathological changes in brain structure by combining T1- and T2-weighted MR imaging data. Neuroradiology 57, 917–928 (2015).
- Beer, A. et al. Tissue damage within normal appearing white matter in early multiple sclerosis: assessment by the ratio of T1- and T2-weighted MR image intensity. J. Neurol. 263, 1495–1502 (2016).
- Ishida, T. et al. Elucidating the aberrant brain regions in bipolar disorder using T1-weighted/T2-weighted magnetic resonance ratio images. Psychiatry Res. Neuroimaging 263, 76–84 (2017).
- Howell, B. R. et al. The UNC/UMN Baby Connectome Project (BCP): An overview of the study design and protocol development. NeuroImage 185, 891–905 (2019).
- Nerland, S. et al. Multisite reproducibility and test-retest reliability of the T1w/T2w-ratio: A comparison of processing methods. NeuroImage 245, 118709 (2021).
- Chen, L. et al. A 4D infant brain volumetric atlas based on the UNC/UMN baby connectome project (BCP) cohort. NeuroImage 253, 119097 (2022).
Figures