2389
Transcriptome-Connectome association from fetal stage to adulthood1Department of Radiology, Children's Hospital of Philadelphia, Philadelphia, PA, United States, 2Department of Radiology, Perelman School of Medicine, University of Pennsylvania, Philadelphia, PA, United States, 3Department of Neuroscience, University of Pennsylvania, Philadelphia, PA, United States, 4Neurogenomics group, Research Programme on Biomedical Informatics (GRIB), Hospital del Mar Medical Research Institute (IMIM), DCEXS, Universitat Pompeu Fabra, Barcelona, Spain, 5Department of Neuroscience and Kavli Institute for Neuroscience, Yale School of Medicine, New Haven, CT, United States
Synopsis
Keywords: Genetics, Normal development, screening; neonatal; brain connectivity; connectome; transcriptome
Motivation: Transcriptome, representing the set of gene expression, exhibits spatiotemporal heterogeneity during brain development, underlying the dramatic changes in brain structural connectivity as measured by diffusion MRI throughout development.
Goal(s): Our goal was to elucidate the association between macroscopic structural connectome and microscopic transcriptome across development.
Approach: Here, we revealed this dynamic association between structural connectome and gene expression from a large cohort of 336 participants from fetal stage to adulthood.
Results: The changes of associated genes’ enrichment in cell types, biological processes, cellular components, and molecular functions across different ages shed light into the dynamic transcriptomic roles in connectome maturation.
Impact: By associating transcriptome map from over 6500 protein-encoding genes and dMRI-derived structural network, we revealed spatiotemporally heterogeneous transcriptome-connectome association from fetal stage to adulthood, providing insights into genetically patterned process of brain topological changes in health and disease.
Introduction
Human brain connectivity, including synaptogenesis and myelination, undergoes dramatic development from fetal stage to adulthood 1-5. These tremendous brain changes are regulated at molecular and cellular level by gene expression, which exhibits heterogeneity in its spatiotemporal patterns across brain regions and development 6-7. We have found coupling between heterogeneous gene-expression profiles and cortical microstructure in the fetus 8. However, there is still a gap in associations between the macroscopic connectome and microscopic transcriptome (the set of gene expression) across development 9. In this study, we sought to bridge this gap and to reveal the dynamic of transcriptome-connectome association across human development from fetal stage to adulthood.Methods
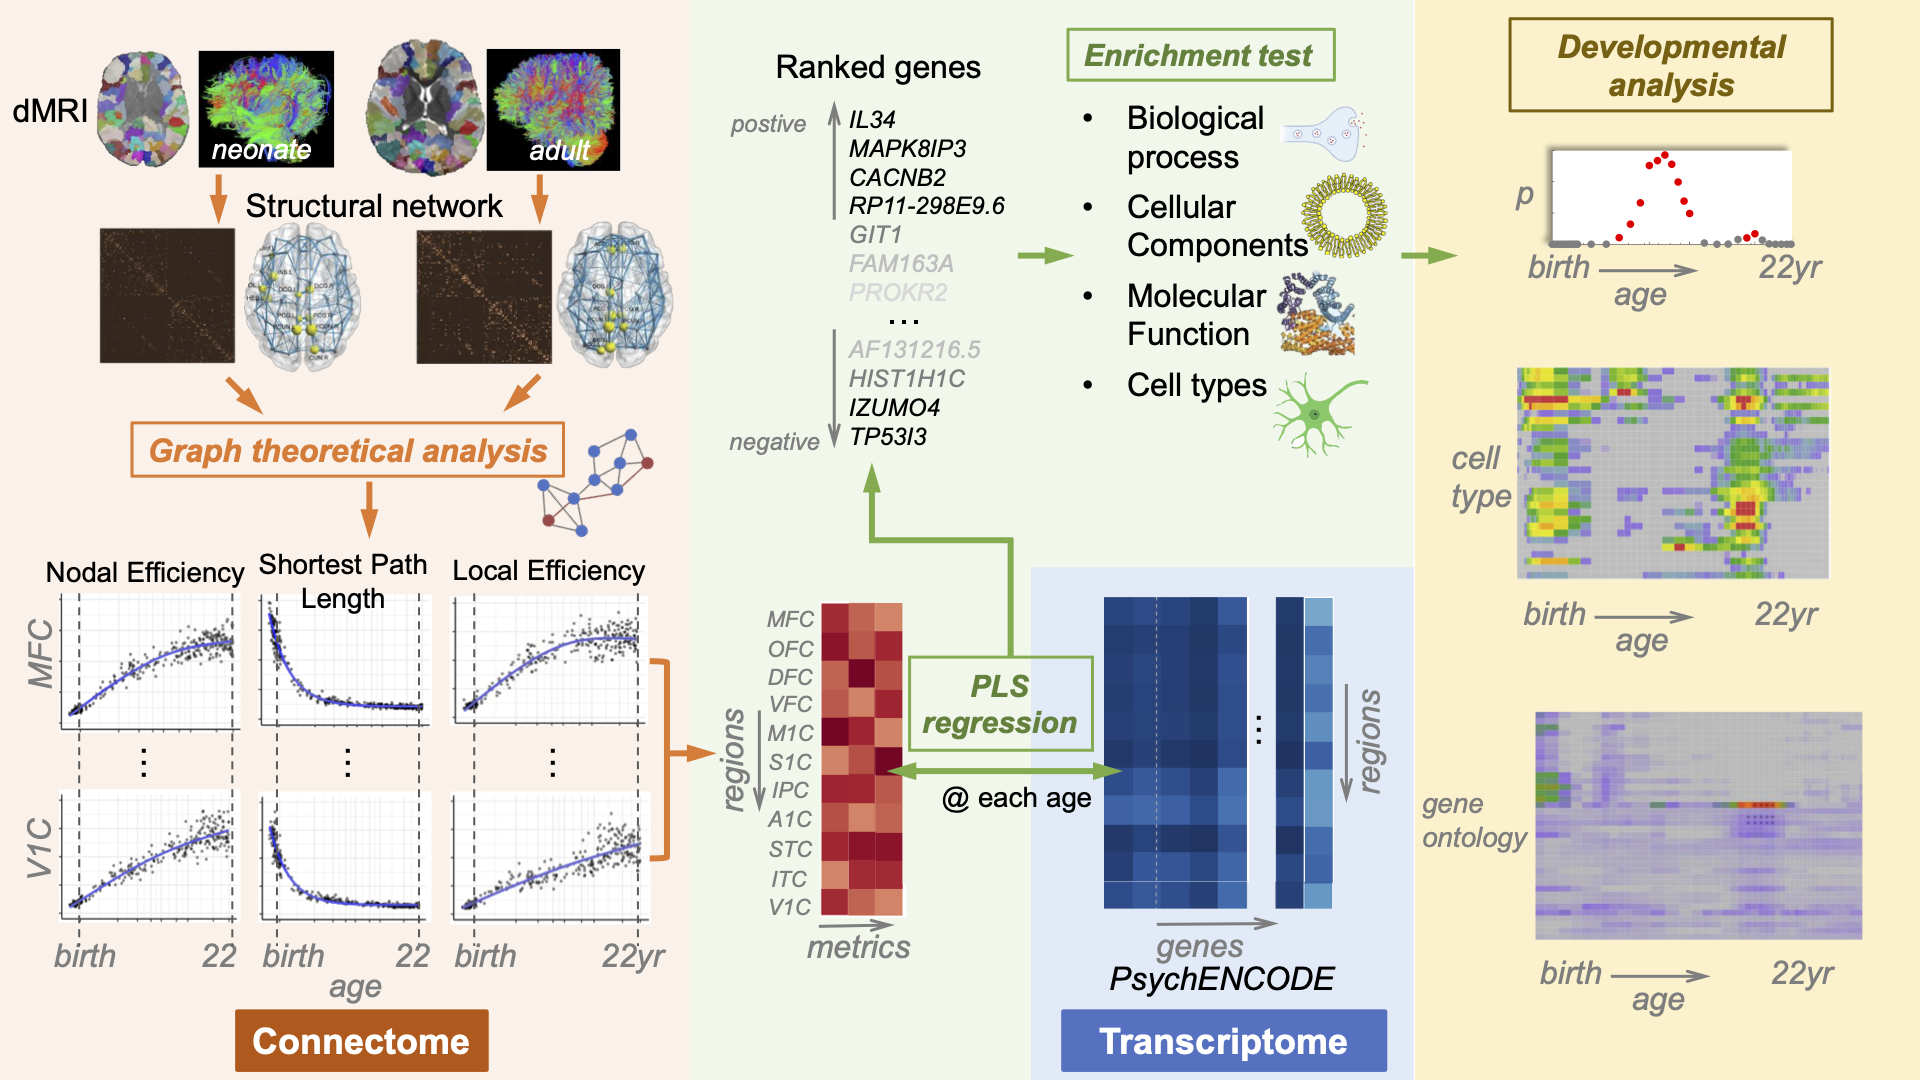
Schematic pipeline of methods is shown in Fig. 1.Subjects and diffusion MRI (dMRI) acquisition: The study included 336 subjects spanning from the fetal stage to adulthood. Neonate dMRI dataset: 87 neonates (56M/31F) aged 29-40 postconceptional weeks (pcw), TR/TE=6850/78ms, FOV=168x168mm2, imaging resolution=1.5x1.5x1.6mm3, b-values=1000s/mm2. Early childhood dMRI dataset: 124 children (55M/69F) aged 0.17-7.91 years, TR/TE=9300/100ms, FOV=256x256mm2, imaging resolution=2x2x2mm3, b-values=1000s/mm2. Childhood to adulthood dMRI dataset: 125 participants (63M/62F) aged 5-22 years from the Human Connectome Project Development cohort, TR/TE = 3222/89.2ms, FOV = 210x210 mm2, imaging resolution=1.5x1.5x1.5mm3, b-values=1500 and 3000s/mm2.
Connectome construction and network analysis: Whole-brain, deterministic tractography was performed in DiffusionToolkit (http://www.trackvis.org/dtk/), with FA threshold of 0.1 and angle threshold of 35o. MNI single-subject template with 256 uniform cortical parcels (nodes) 10 were registered to individual b0 images. When building FA weighted structural network, effects of resolution and number of voxels differences were considered 2. Nodal efficiency (Ne), local efficiency (Neloc), and shortest path length (Lp) were computed using graph theory. Developmental trajectories for Ne and Neloc were fitted with generalized additive models, while Lp was fitted with exponential models based on Akaike information criteria.
mRNA profiling: Tissue-level mRNA sequencing was performed from 39 high-quality brain samples (21M/18F) aged 12pcw-40years from PsychENCODE 6-7. Normalized mRNA level, RPKM (Reads Per Kilobase of transcript per Million mapped reads) of 60155 genes were measured across 11 neocortical regions and were fitted with locally estimated scatterplot smoothing for age-related changes. From the differentially expressed genes, 6506 protein-encoding genes with FDR-corrected p<0.01 were selected. Additionally, single-nuclei RNA sequencing (snRNA-seq) data was generated from three adults.
Transcriptome-connectome association, and gene enrichment analyses: To explore the association, partial least squares (PLS) regression with permutation testing was applied on network metrics (i.e., Ne, Neloc and Lp) with age-matched RPKM at 63 age points from 30pcw to 22 years. At each age point, genes were ranked according to weights on PLS 1 component. Genes with top 10% of absolute weights were selected for further gene enrichment and ontology analysis 11-12 to identify biological processes, cellular components, and molecular functions. Enrichment in cell types was analyzed via Kolmogorov-Smirnov test with snRNA-seq dataset.
Results
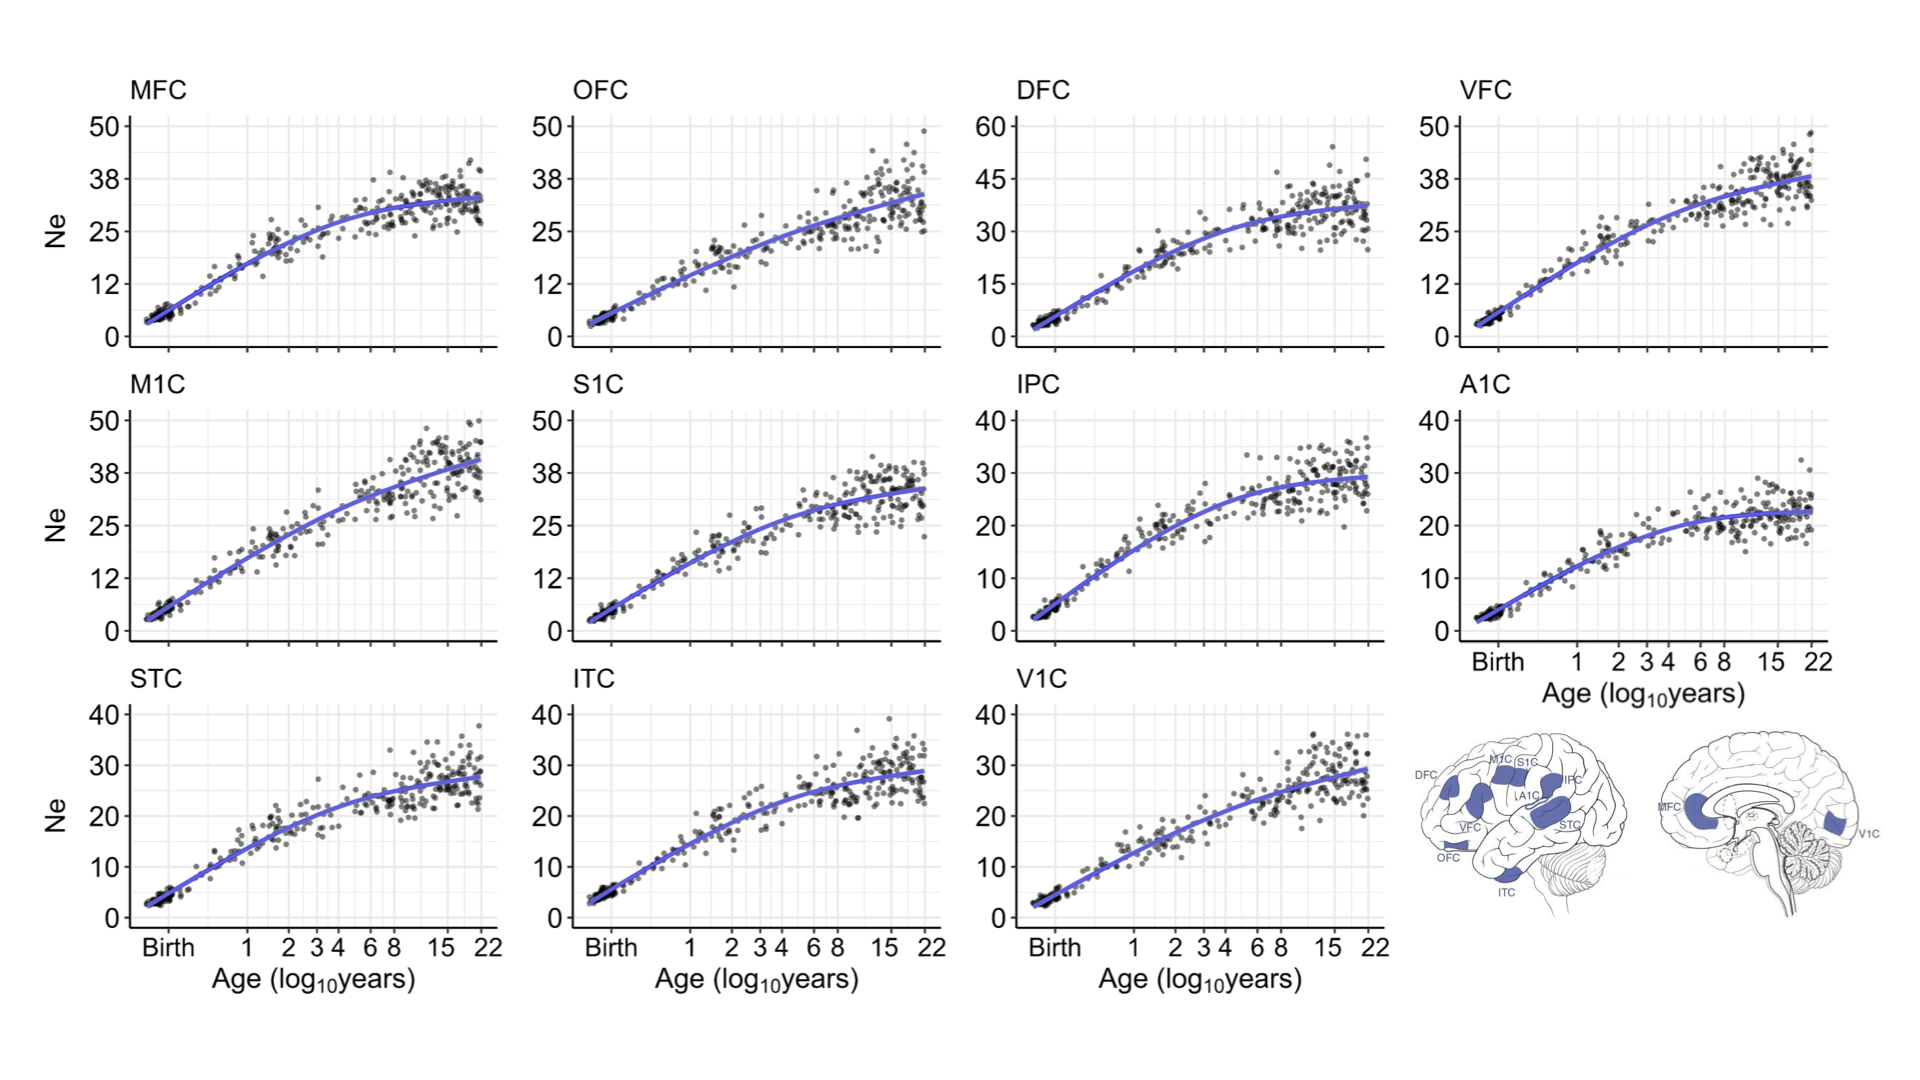
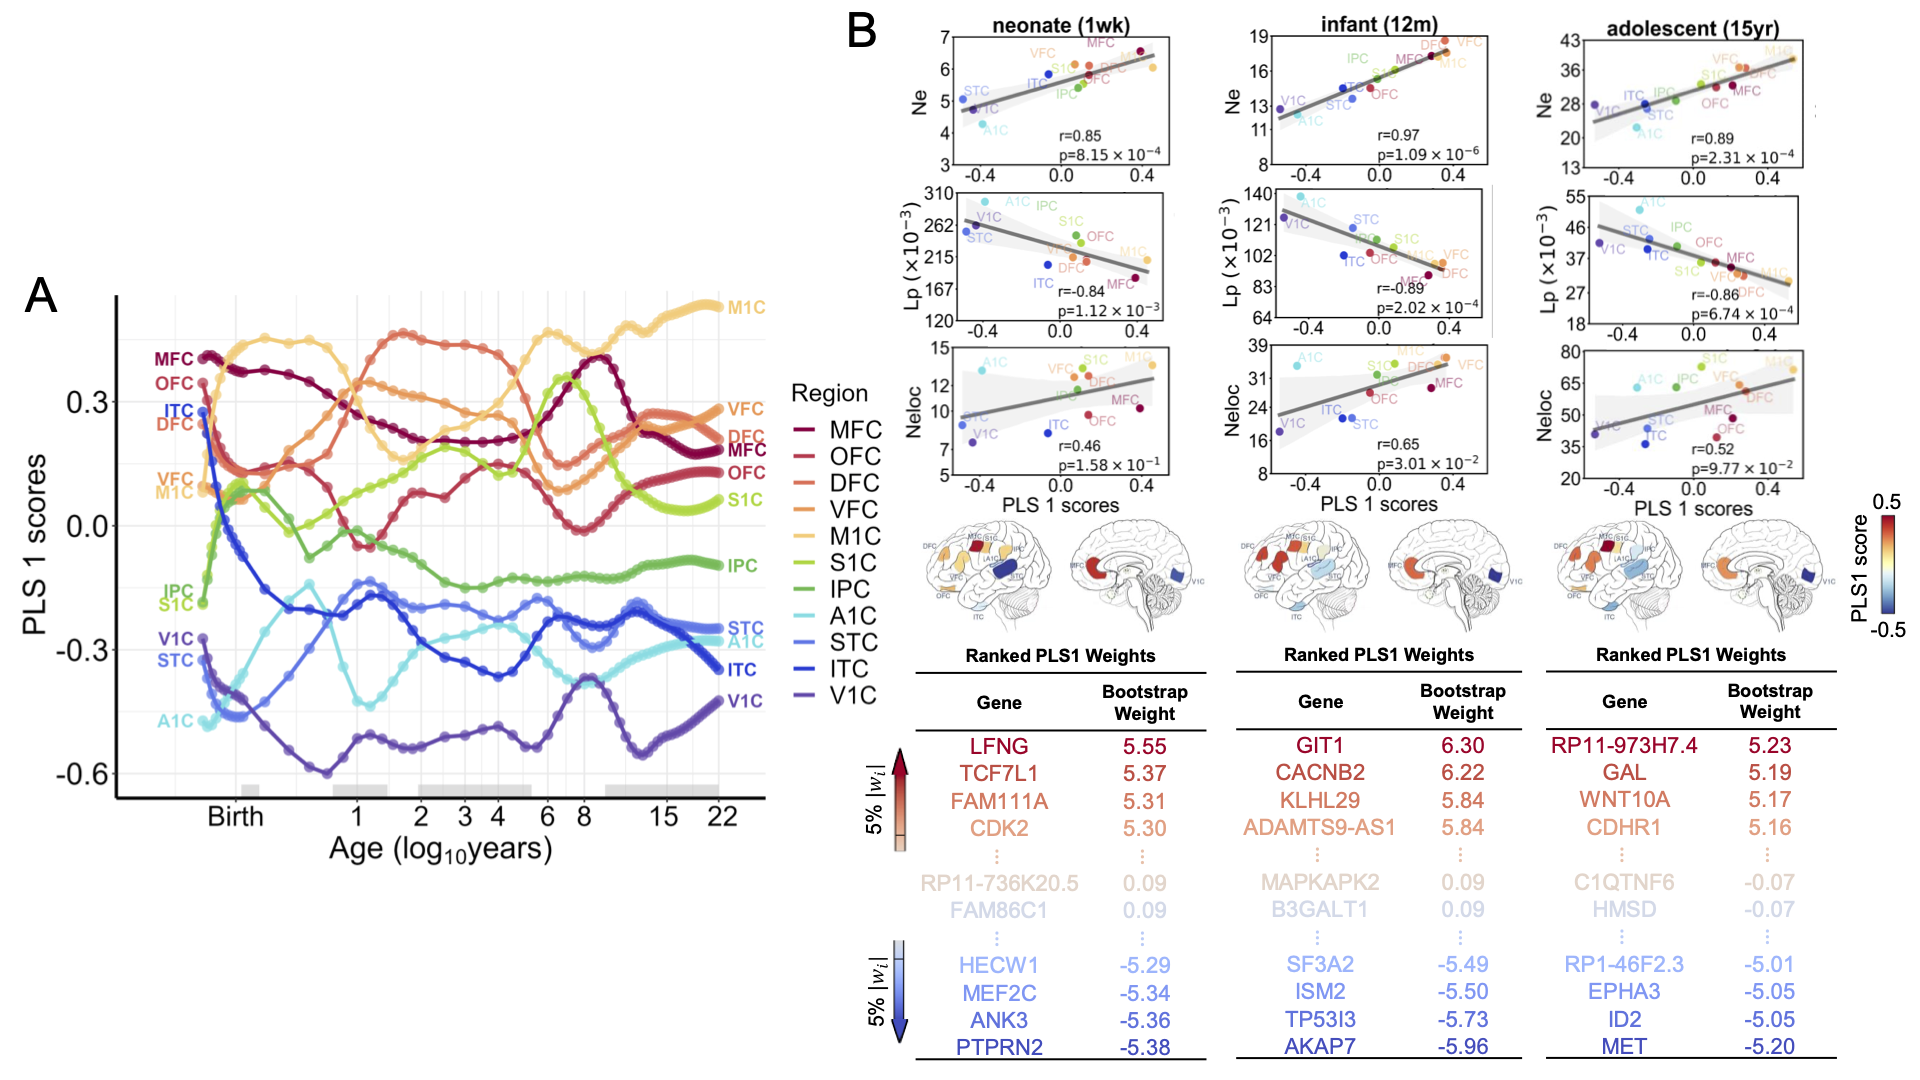
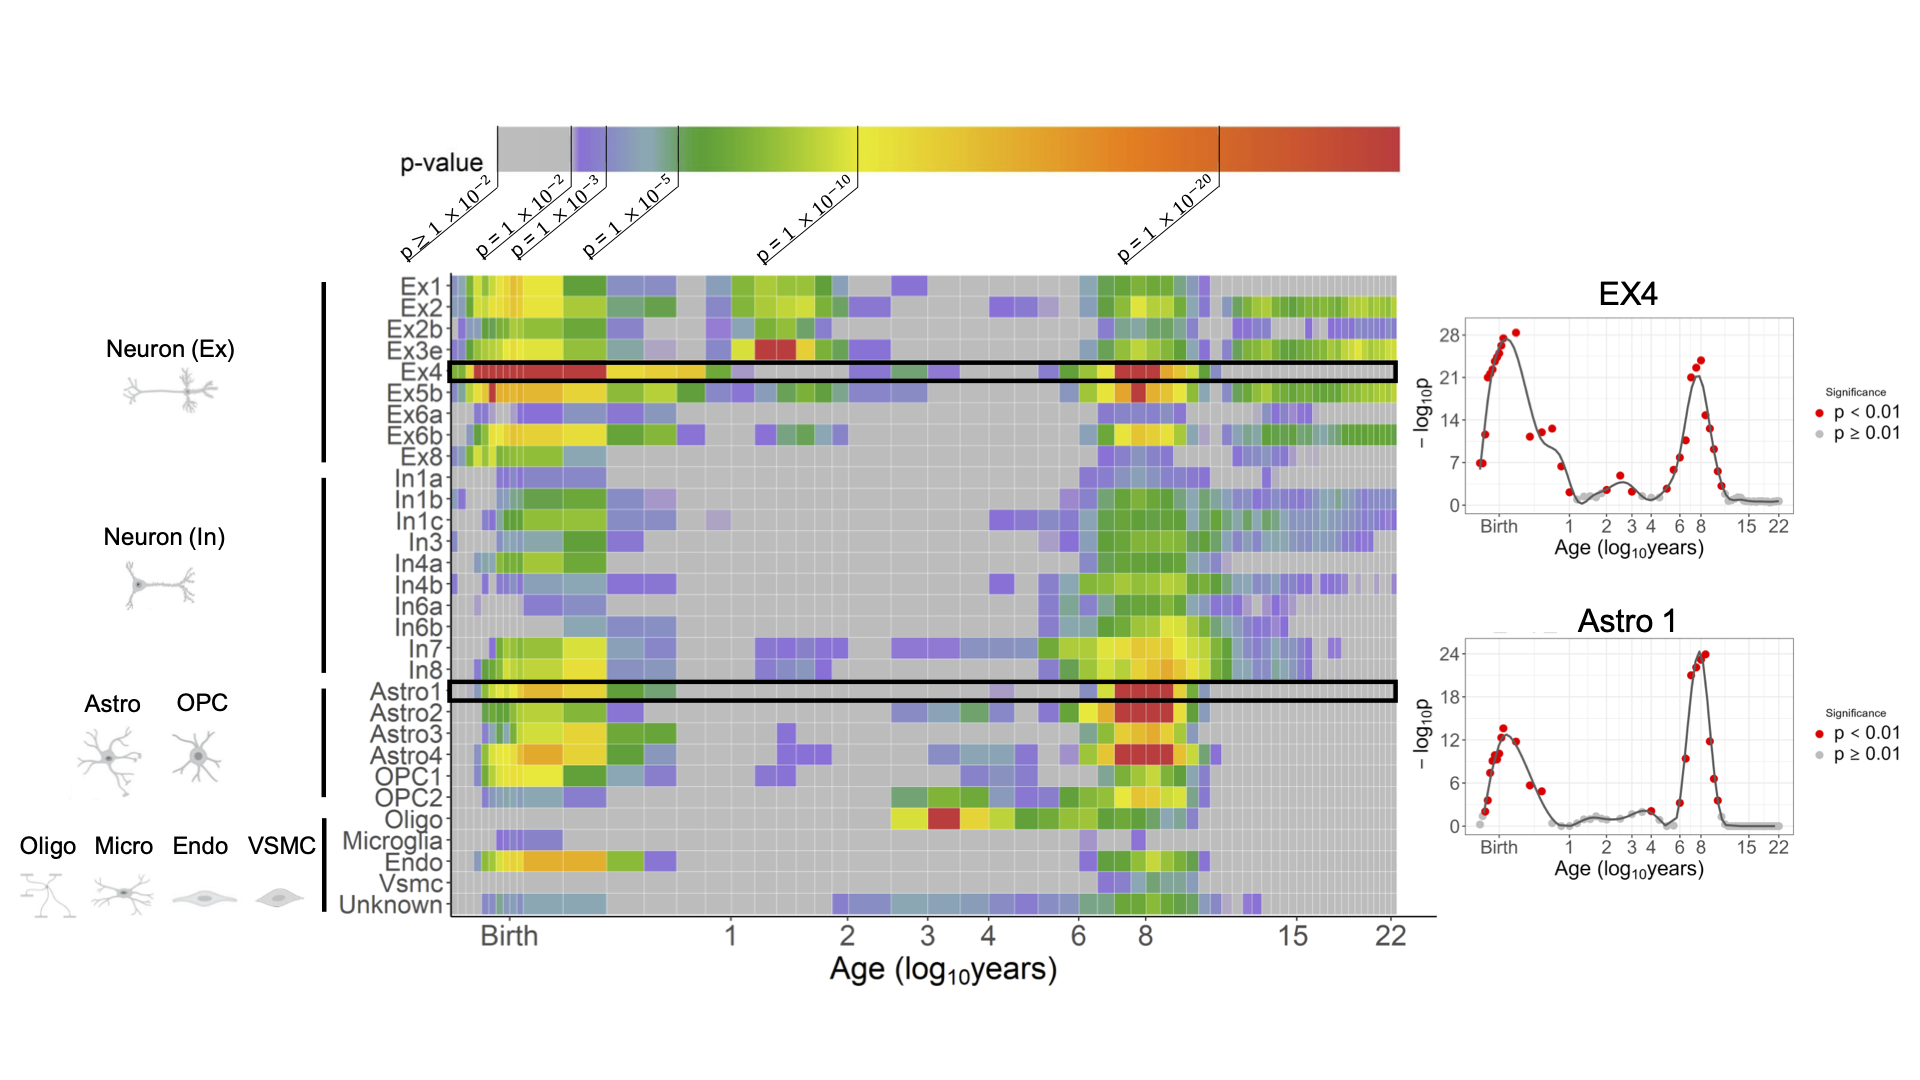
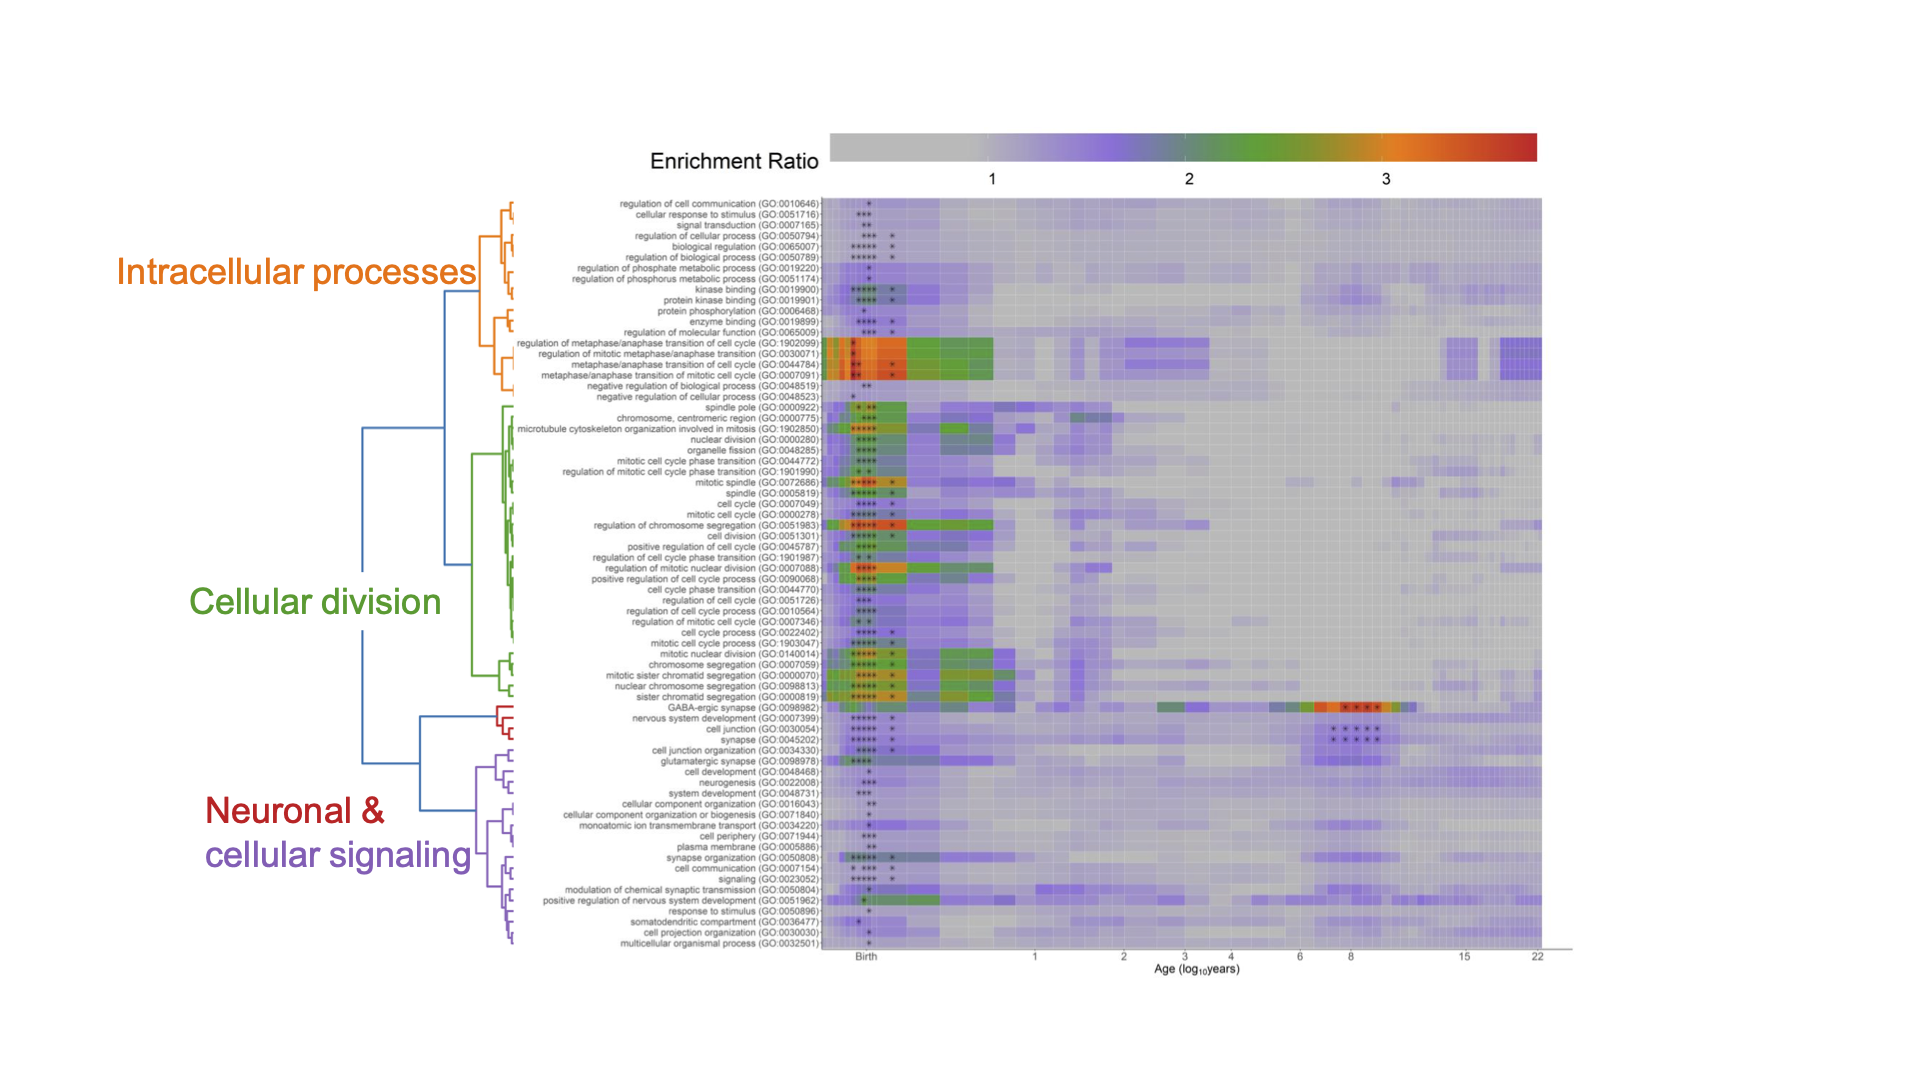
Structural connectome demonstrated differential maturation from 30pcw to 22 years. For instance, nodal efficiency showed heterogeneous increases across brain regions, with prefrontal cortex growing faster than primary auditory cortex (Fig. 2). Significant and dynamic associations between transcriptome and connectome were observed across development (Fig. 3), with more dramatic changes observed before 8 years of age. The association profile indicated by the first PLS component showed overexpression in prefrontal cortex (Figure 3A), and significant correlation with nodal and local efficiency (Figure 3B). Furthermore, we revealed dynamic enrichment in cell types (Fig. 4). Notably, the developmental periods of early infancy and around 8 years feature peaks in gene enrichment related to astrocytes, excitatory neurons, and inhibitory neurons. Oligodendrocytes only displayed enrichment from 2.5 years to early adolescence (Fig. 4). Gene ontology (GO) enrichment patterns mirrored cell type enrichment, with notable significance around birth and at approximately 8 years of age (Fig. 5). For example, intracellular processes and cellular division related GO terms exhibited concentrated enrichment from the third trimester to 1 year of age. Cellular components, such as GABA-ergic synapse and cell junction, displayed high enrichment around birth and 8 years to early adolescence (Fig. 5).Discussion and conclusion
We revealed the spatiotemporal dynamics of transcriptome-connectome association from fetal stage to adulthood. The differential gene enrichment peak ages in various cell types, biological processes, cellular components, and molecular functions may suggest their different roles in macroscopic connectome during development. For example, the peak ages of GABA-ergic synapse mirror the ones with high rates of synaptogenesis in the brain 1,13. Future work will focus on validation of these findings with animal models and the vulnerability of these highlights in neurodevelopmental diseases.Acknowledgements
This study is funded by NIH NIH R01MH092535, R01MH125333, R01EB031284, R01MH129981, R21MH123930 and P50HD105354. The transcriptome data was generated with the support of The BrainSpan Project Consortium by grants MH089929, MH090047, and MH089921 from NIMH. In addition, G.S. received the support of a fellowship from “la Caixa” Foundation (ID 100010434). The fellowship code is LCF/BQ/PI19/11690010. G.S. is also supported by Ministerio de Ciencia e Innovación, Spain (PID2019-104700GA-I00).References
1. Ouyang, M., Dubois, J., Yu, Q., Mukherjee, P., & Huang, H. (2019). Delineation of early brain development from fetuses to infants with diffusion MRI and beyond. Neuroimage, 185, 836-850.
2. Song, L., Mishra, V., Ouyang, M., Peng, Q., Slinger, M., Liu, S., & Huang, H. (2017). Human fetal brain connectome: structural network development from middle fetal stage to birth. Frontiers in neuroscience, 11, 561.
3. Zhao, T., Mishra, V., Jeon, T., Ouyang, M., Peng, Q., Chalak, L., ... & Huang, H. (2019). Structural network maturation of the preterm human brain. Neuroimage, 185, 699-710.
4. Huang, H., Shu, N., Mishra, V., Jeon, T., Chalak, L., Wang, Z. J., ... & Dong, Q. (2015). Development of human brain structural networks through infancy and childhood. Cerebral Cortex, 25(5), 1389-1404.
5. Yu, Q., Peng, Y., Kang, H., Peng, Q., Ouyang, M., Slinger, M., ... & Huang, H. (2020). Differential white matter maturation from birth to 8 years of age. Cerebral Cortex, 30(4), 2674-2690.
6. Zhu, Y. et al. (2018). Spatiotemporal transcriptomic divergence across human and macaque brain development. Science 362.
7. Li, M., Santpere, G., Kawasawa, Y. I., Evgrafov, O. V., Gulden, F. O., Pochareddy, S., ... & Sestan, N. (2018). Integrative functional genomic analysis of human brain development and neuropsychiatric risks. Science, 362(6420).
8. Huang, H., Jeon, T., Sedmak, G., Pletikos, M., Vasung, L., Xu, X., ... & Mori, S. (2012). Coupling diffusion imaging with histological and gene expression analysis to examine the dynamics of cortical areas across the fetal period of human brain development. Cerebral cortex, 23(11), 2620-2631.
9. Fornito, A., Arnatkevičiūtė, A., & Fulcher, B. D. (2018). Bridging the gap between connectome and transcriptome. Trends in cognitive sciences, 23(1), 34-50.
10. Romero-Garcia, R., Atienza, M., Clemmensen, L. H., & Cantero, J. L. (2012). Effects of network resolution on topological properties of human neocortex. Neuroimage, 59(4), 3522-3532.
11. Eden, E., Navon, R., Steinfeld, I., Lipson, D., & Yakhini, Z. (2009). GOrilla: a tool for discovery and visualization of enriched GO terms in ranked gene lists. BMC bioinformatics, 10(1), 1-7.
12. Raudvere, U., Kolberg, L., Kuzmin, I., Arak, T., Adler, P., Peterson, H., & Vilo, J. (2019). g: Profiler: a web server for functional enrichment analysis and conversions of gene lists (2019 update). Nucleic acids research, 47(W1), W191-W198.
13. Huttenlocher, P. R., & Dabholkar, A. S. (1997). Regional differences in synaptogenesis in human cerebral cortex. Journal of comparative Neurology, 387(2), 167-178.
Figures