2384
Automatic Estimation of Neonatal Ventricles-to-Brain Volume Ratio using AI for Monitoring Hydrocephalus1Aspect Imaging, Shoham, Israel, 2Vision Elements, Kfar-Saba, Israel, 3Imaging Division, Sourasky Medical Center, Tel-Aviv, Israel, 4Department of Radiology, Shaare Zedek Medical Center (SZMC), Jerusalem, Israel
Synopsis
Keywords: Neonatal, Neonatal, Neonatal, Point-of-care MRI, Machine Learning/Artificial Intelligence, Segmentation
Motivation: To propose a new approach for managing hydrocephalus in neonates based on neonatal MRI and AI-based brain ventricle volume quantitation, brain parenchyma volume and ventricle-to-brain volumes ratio.
Goal(s): To evaluate the robustness of quantitative measurements of ventricle and brain volumes using AI-based algorithms, on scans acquired on a 1 Tesla permanent magnet neonatal MRI.
Approach: The performance of three AI-based segmentation algorithms was evaluated using linear correlations and Intersection over Union (IoU) score between ground truth and predictions.
Results: Results show high linear correlations between ground truth and algorithm predictions, validating the use of these volumetric measurements to monitor hydrocephalus longitudinally.
Impact: An AI based method for segmenting neonatal MRI images may provide volumetric quantitation and enable fast and accurate decision making on surgical intervention in preterm infants with hydrocephalus.
Introduction
The phenomenon of dilated brain ventricles related to post-hemorrhagic hydrocephalus (PHH) is commonly seen in prematurely born infants. .Although Magnetic Resonance Imaging (MRI) plays an important role in the management of such patients, current decision making in the neonatal intensive care unit (NICU) is driven by linear measurements on cranial ultrasound (cUS) [1]. The availability of automated MRI-based volumetric quantitation, and the ability to reliably compare between two consecutive scans - could improve decisions regarding neuro-surgical intervention. To facilitate MRI-based clinical management, we propose automatic quantitative tools for measuring the volumes of lateral ventricles, third and fourth ventricles, as well as total brain parenchymal volume and ventricle-to-brain volumes ratio. Given the limited availability of neonatal MRI data for training, we investigate performance of 2-D vs. 3-D neural networks. Specifically, we train a 2D U-Net [2] and compare it to the 3D U-Net [3] and a vision-transformer U-Net-R [4]. We evaluate segmentation performance by computing Intersection-over-Union (IoU) scores and perform linear regression of the predicted volumes vs. their ground truth.Methods
Segmentation of the brain ventricles was performed on axial T2 weighted 2D fast-spin-echo (FSE) scans of preterm infants. Scans were acquired on Embrace (Aspect Imaging) neonatal MRI, equipped with a 1 Tesla permanent magnet at room temperature and located in a level 3 NICU at Shaare Zedek Medical Center (Jerusalem, Israel) [5]. Imaging parameters were:(TR=10-13 s, TE=130-150 ms, slice thickness=3-4 mm and FOV=120-140 mm, echo train length = 20, number of slices =24-32). The cohort consisted of 207 premature infant scans (mean gestational age 34.3 weeks ± 5.6 days). The ventricular volume was sub-divided into four chambers: left lateral, right lateral, third and fourth. Additionally, a chamber defined as Cavum septum pellucidum & Cavum verge (CSP-CV) was also segmented. Ground truth annotations were drawn by a radiologist and reviewed by a neonatal radiologist, following the instructions in [6]. The data were split into 167, 20, and 20, volumes for training, validation, and testing, respectively. Given the limited training set size, we compared performance of three different architectures: (1) a 2D U-Net model [2] with a backbone of ResNet-18 [7], (2) a 3D U-Net CNN [3]; and (3) a 3D U-Net R model [4] based on vision transformers. The Dice segmentation loss was used to train all models. The learning rate started was initialized to 0.001 and then decayed by a factor of 0.8-0.95 every 10 iterations. from 0.001 and then decayed by a factor of 0.8-0.95 every 10 iterations. The input to the 2D U-Net was a single 2D image zero padded to 256x224 voxels, while the input to the 3D U-Net was the entire volume (256x224x32 voxels) zero padded to 32 slices. Due to memory considerations, the U-Net-R received as inputs sub-volumes of 96x96x32 voxels, spanning the entire original volume.Results and Discussion
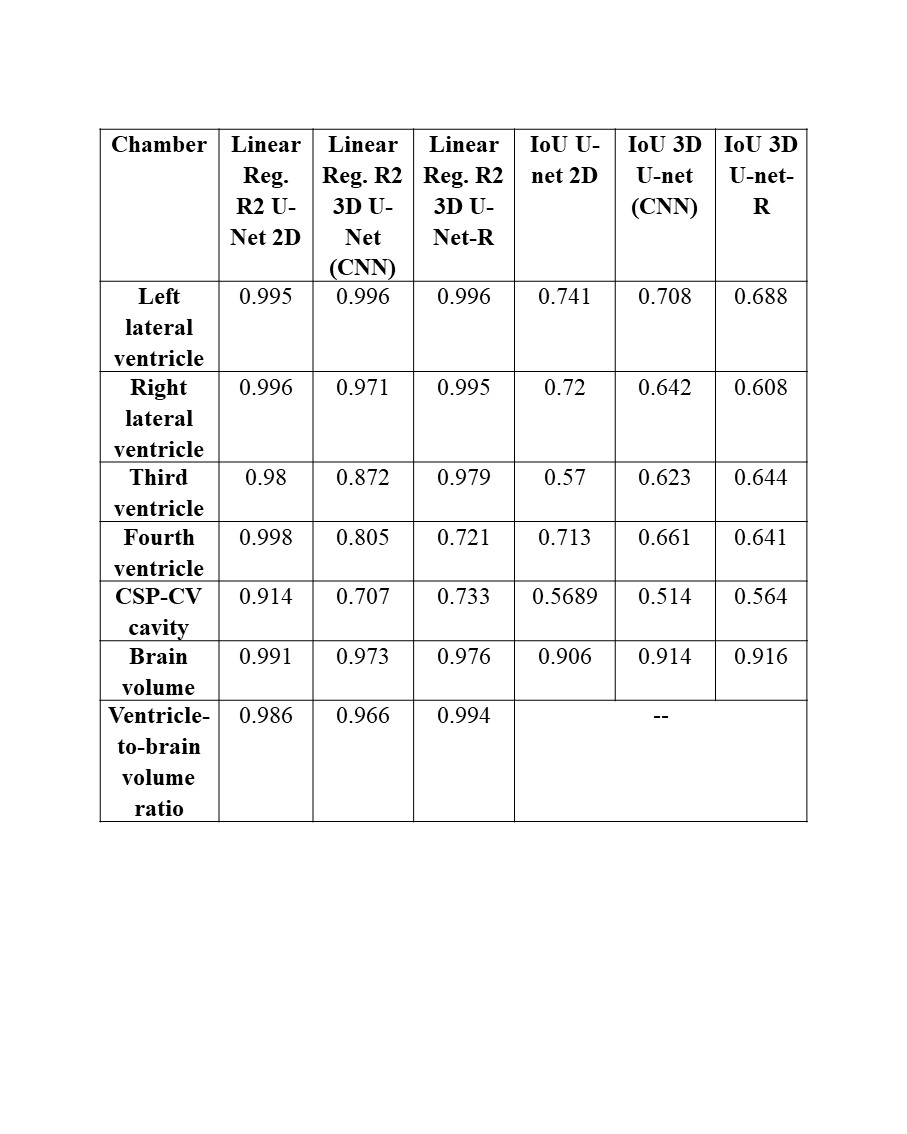
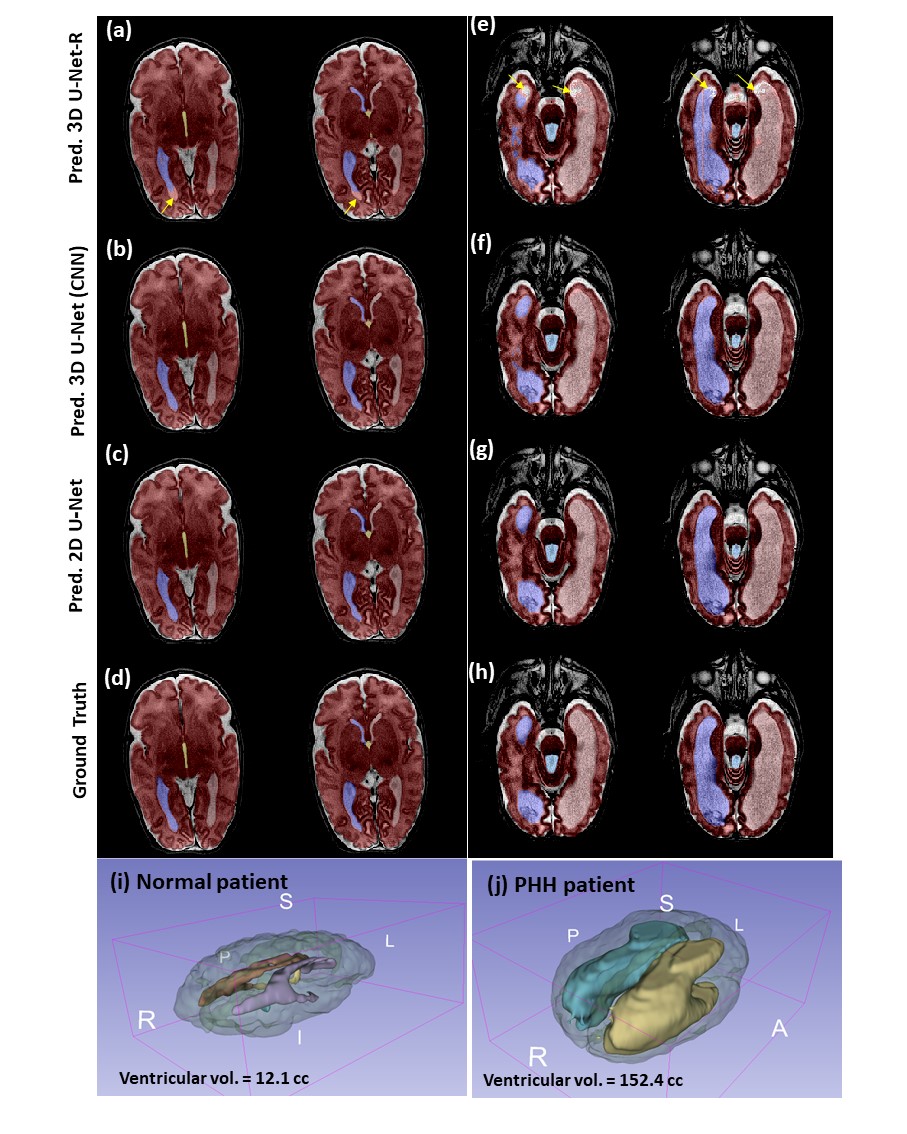
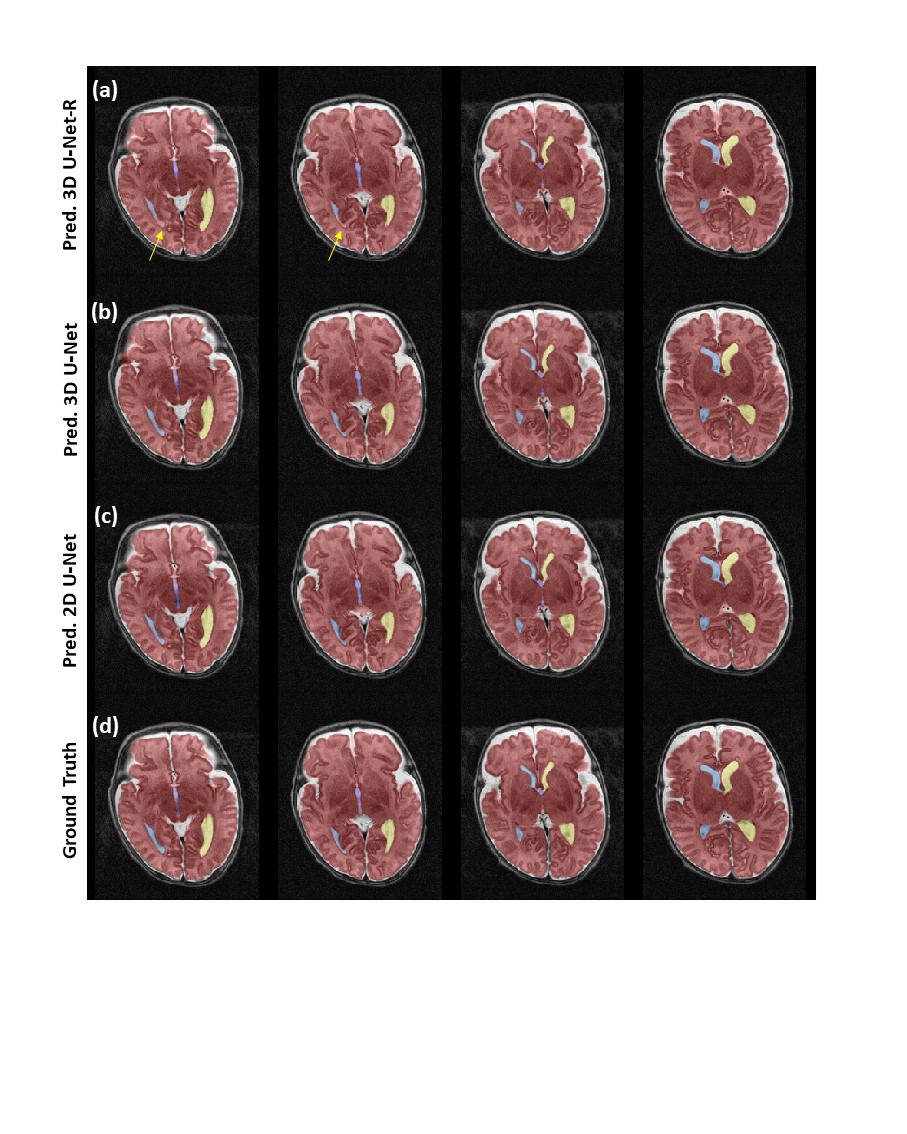
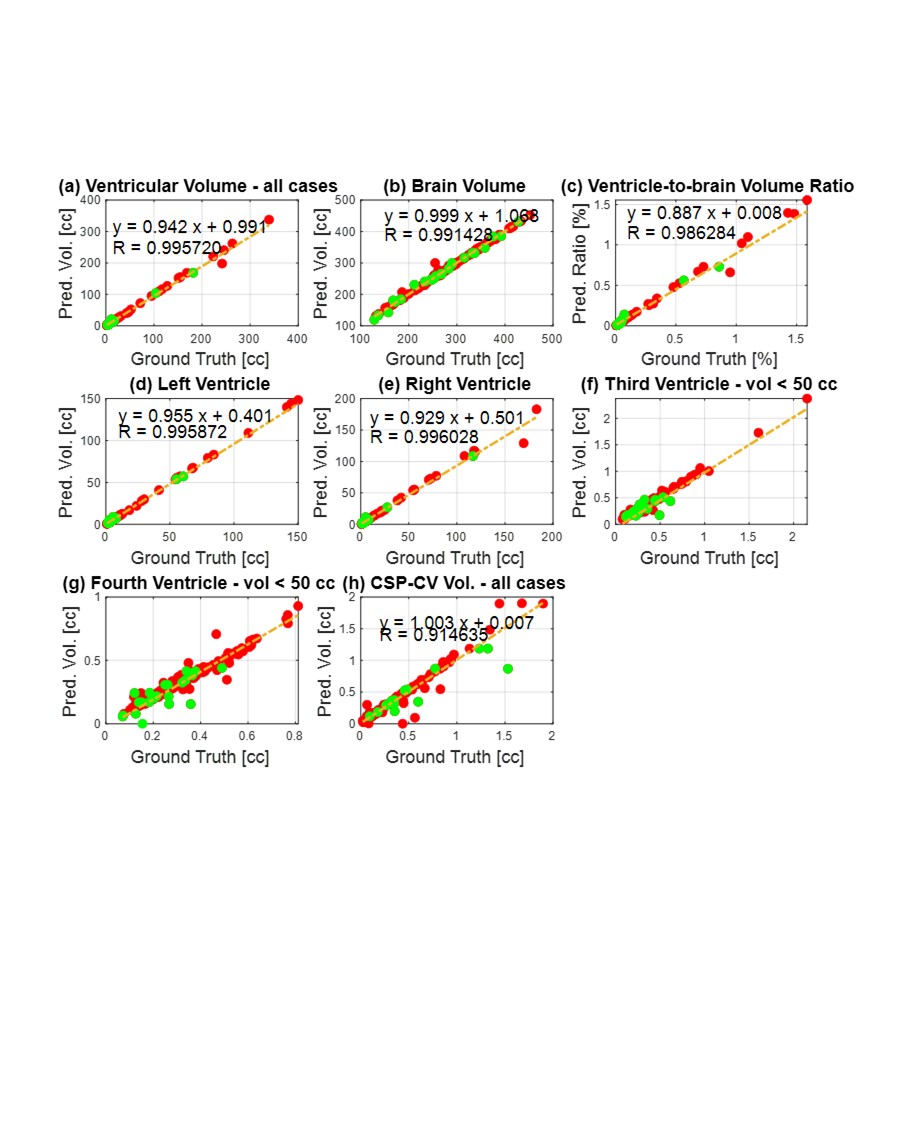
Figure 1 and 2 show the semantic segmentation results achieved by the three models tested in this work: 2D U-Net, 3D U-Net and 3D U-Net-R. In the slices shown in Figures 1-2, the 2D U-Net and 3D U-Net algorithms were able segment the ventricles faithfully, whereas 3D U-Net-R performed less successfully (see arrows in Fig. 1). Intersection-over-Union scores per ventricular chamber in Table 1 show that 3D models give inferior results, compared to 2D U-Net, for most chambers, except for the third ventricle and the brain. We attribute this to the small training dataset and partial volume effects from 2D imaging. Also, notice in Table 1 that 2D U-Net was the only one to achieve high R2 scores for all chambers.Since 2D U-Net segmentation had the highest linear correlations (Table 1), we used it for further evaluation. Figure 3 shows scatter plots of predicted ventricle and brain volumes using 2D U-Net versus their ground truth values.
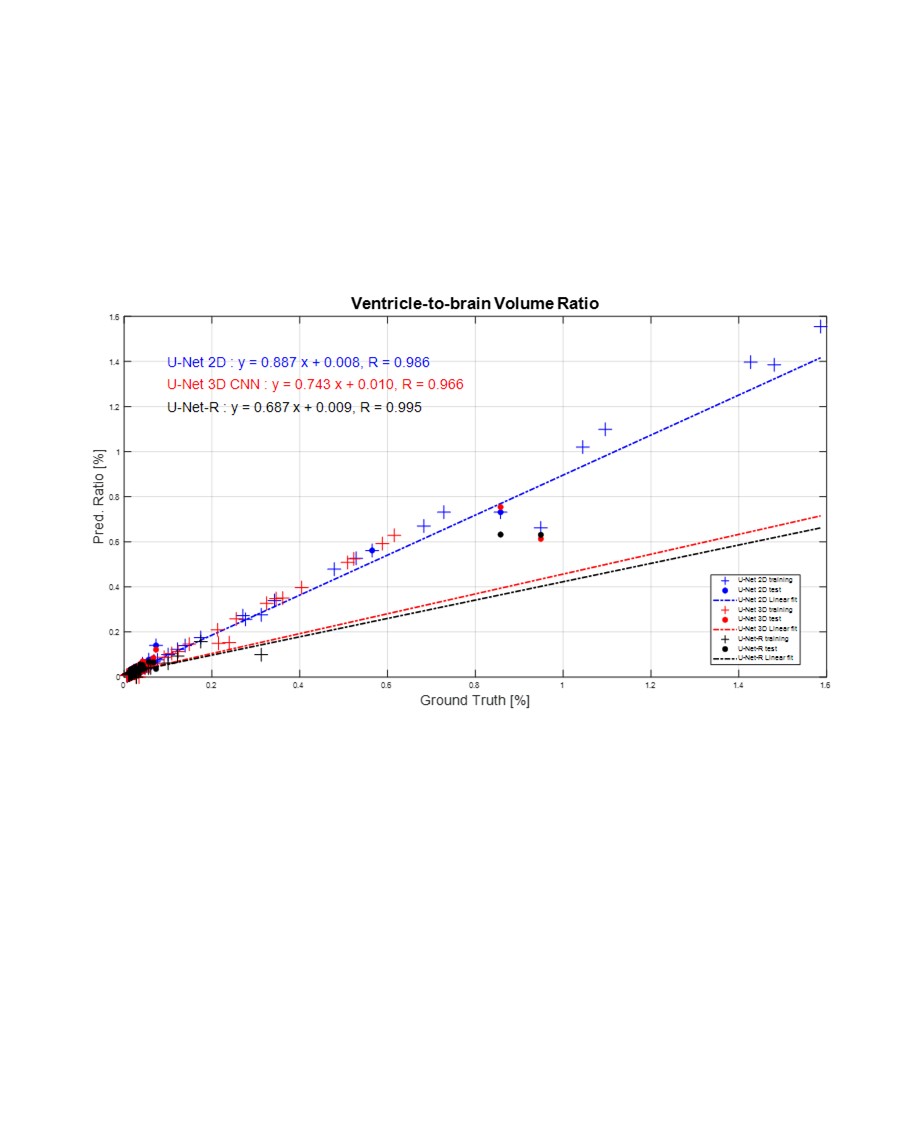
Figure 4 shows the ventricle-to-brain volume ratio prediction vs. ground truth scatter plots, comparing the performance of all tested models. Notice that the linear fit of the 2D U-Net was the closest to the y=x identity line ( ), with a high R2 residuals of 0.986.
Conclusions
We have trained a reliable segmentation model for the brain ventricles and the entire brain surface, as we segment each ventricular chamber separately. Using the 2D U-Net model we achieved high liner correlations between predicted and ground truth segmentations. We showed that we can reliably report the ventricle-to-brain volume ratio which is a promising new biomarker for managing hydrocephalus in the NICU. The measured volume of the CSP-CV cavity was also evaluated. Future work will compare the utility of these MRI-based biomarkers with conventional linear 2D measurements for managing hydrocephalus.Acknowledgements
We thank all the families who gave their consent for their infants to participate in our MRI studies in SZMC. Thanks to MarteckSolutions (Hyderabad, India) for the annotations and to Peter Bendel and Jon Tamir for reviewing this work.References
[1] M. El-Dib et al., “Management of Post-hemorrhagic Ventricular Dilatation in the Infant Born Preterm,” J. Pediatr., vol. 226, pp. 16-27.e3, 2020, doi: 10.1016/j.jpeds.2020.07.079.
[2] O. Ronneberger, P. Fischer, and T. Brox, “U-Net: Convolutional Networks for Biomedical Image Segmentation,” in Medical Image Computing and Computer-Assisted Intervention – MICCAI, 2015, pp. 234--241.
[3] Ö. Çiçek, A. Abdulkadir, S. S. Lienkamp, T. Brox, and O. Ronneberger, “3D U-net: Learning dense volumetric segmentation from sparse annotation,” Lect. Notes Comput. Sci. (including Subser. Lect. Notes Artif. Intell. Lect. Notes Bioinformatics), vol. 9901 LNCS, pp. 424–432, 2016, doi: 10.1007/978-3-319-46723-8_49.
[4] A. Hatamizadeh et al., “UNETR: Transformers for 3D Medical Image Segmentation,” Proc. - 2022 IEEE/CVF Winter Conf. Appl. Comput. Vision, WACV 2022, pp. 1748–1758, 2022, doi: 10.1109/WACV51458.2022.00181.
[5] K. R. Thiim et al., “Clinical experience with an in-NICU magnetic resonance imaging system,” J. Perinatol., 2022, doi: 10.1038/s41372-022-01387-5.
[6] J. L. Quon et al., “Artificial intelligence for automatic cerebral ventricle segmentation and volume calculation: A clinical tool for the evaluation of pediatric hydrocephalus,” vol. c, no. 2, pp. 131–138, 2022, doi: 10.3171/2020.6.PEDS20251.Artificial.
[7] S. Yang et al., “Deep learning segmentation of major vessels in X-ray coronary angiography,” Sci. Rep., vol. 9, no. 1, pp. 1–11, 2019, doi: 10.1038/s41598-019-53254-7.
Figures