2383
Alterations in Resting State Functional Magnetic Resonance Imaging in Children from Mexico with and without Obesity1Faculty of Physical and Mathematical Sciences, Benemérita Universidad Autónoma de Puebla (BUAP), Puebla, Mexico, 2Hospital Infantil de México, Federico Gómez, CDMX, Mexico, 3Facultad de Física, UAM campus Iztapalapa, CDMX, Mexico, 4Hospital Infantil de México, Federico Gómez, Mexico City, Mexico, 5King`s College London, London, United Kingdom
Synopsis
Keywords: Neuro, fMRI (resting state)
Motivation: Obesity and its associated comorbidities represent a health risk to population. This is even more relevant to children, as it can affect their cognitive development.
Goal(s): Understanding the neurological pathophysiology of infant obsity is of paramount interest.
Approach: Find differences in functional connectivity between infant obese and normoweight groups. This using Resting State and ROI to ROI analyses
Results: Both groups presented the 15 RS-networks except for the Executive Control Network for the obese. The obese groups recruited three times more brain regions for the different RS-networks. ROI-to-ROI analysis presented larger number of connections for the Normoweight involving the Cerebellum and the Left-Inferior-Gyrus.
Impact: This is a first step in a larger project in which cognitive deficits of children associated with obesity are correlated to brain function through MRI and cytokine measurements. Here we establish ground differences between obese and normoweight cohorts.
Aim: To point out the differences in RS-networks and Functional Connectivity (FC) between resting state networks considering the different brain region recruited as well as a ROI-to-ROI connectivity analysis. All this, to assess different physiological mechanisms of infant brain depending on BMI.
Methods: 126 male children with ages within 7 and 10, were subdivided into a Normo-Weight (NW) group and an obese (OB) group, according to their BMI. MR imaging was performed on a 3T Siemens Skyra system. T1-weighted 2D-FLASH (Fast low angle shot) sequence with repetition time (TR) = 285 ms and echo time (TE) = 2.49 ms; Field of View (FOV) of 250 x 250 mm and matrix size, 320 x 320 x 44, with resultant pixel size of 0.78 x 0.78 x 3.5 mm. Axial slices (n= 44) covered the entire brain volume, rostro-caudally. Subsequently, RS-fMRI was performed using a 2D-echo planar imaging (EPI)-Simultaneous multi-slice (SMS) sequence. (SMS is a methodology used by Siemens to accelerate image acquisition). Parameters were a TR = 1500 ms; TE = 30 ms; flip angle 70°; matrix size, 94 x 94 x 44; variable FOV but resultant pixel size of 2.36 x 2.36 x 3.5 mm; with 240 brain volumes collected in 6 mins. The grouped resting state networks for each cohort was then calculated with the GIFT software toolbox. Differences between the resting state network´s regions recruited as well as in FC within and with other Resting state networks were calculated. Finally, a ROI-to-ROI analysis was performed comparing both groups using the CONN toolbox.
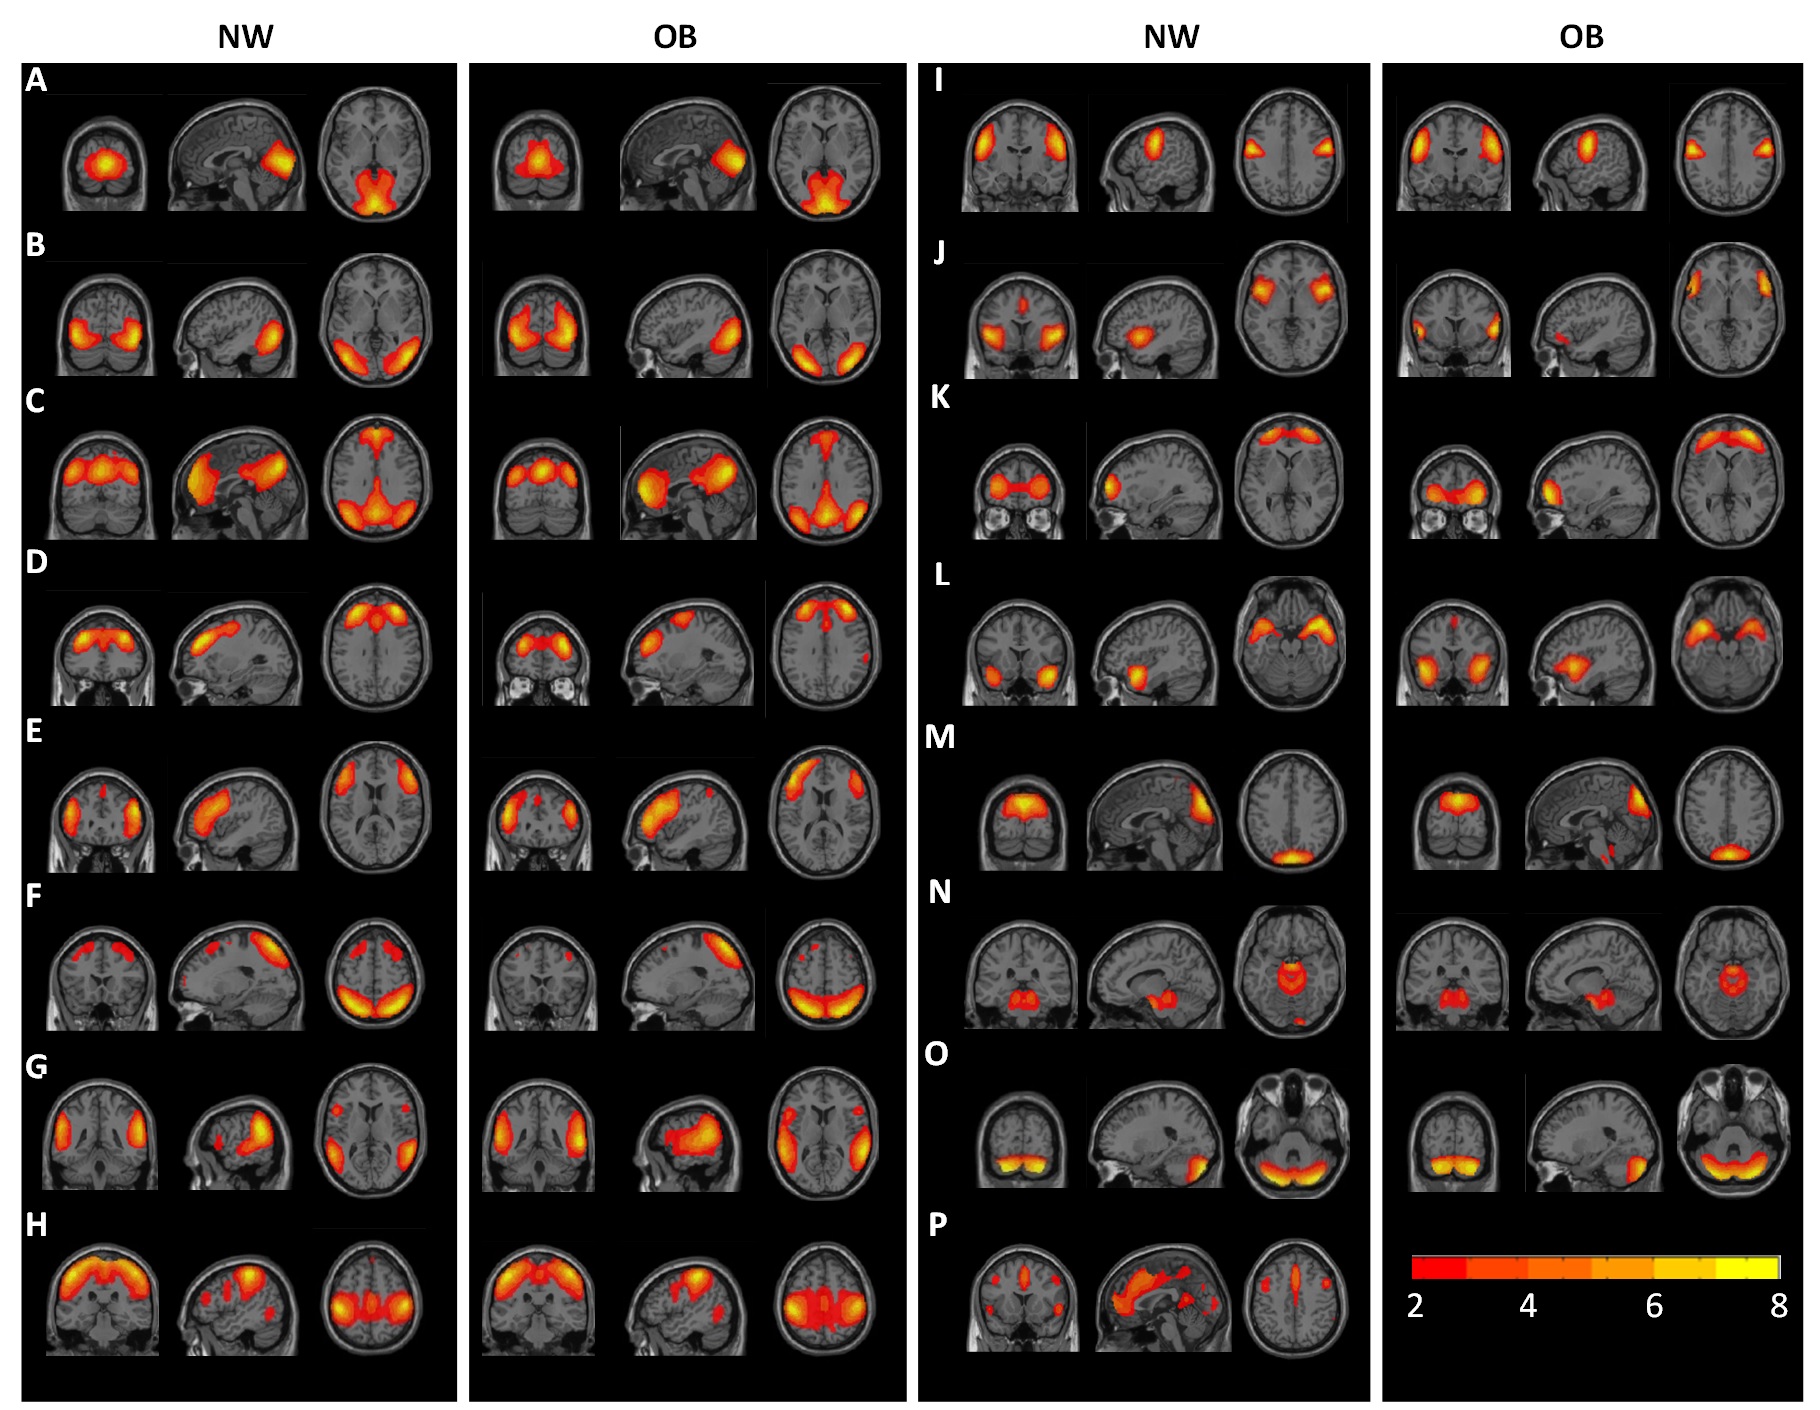
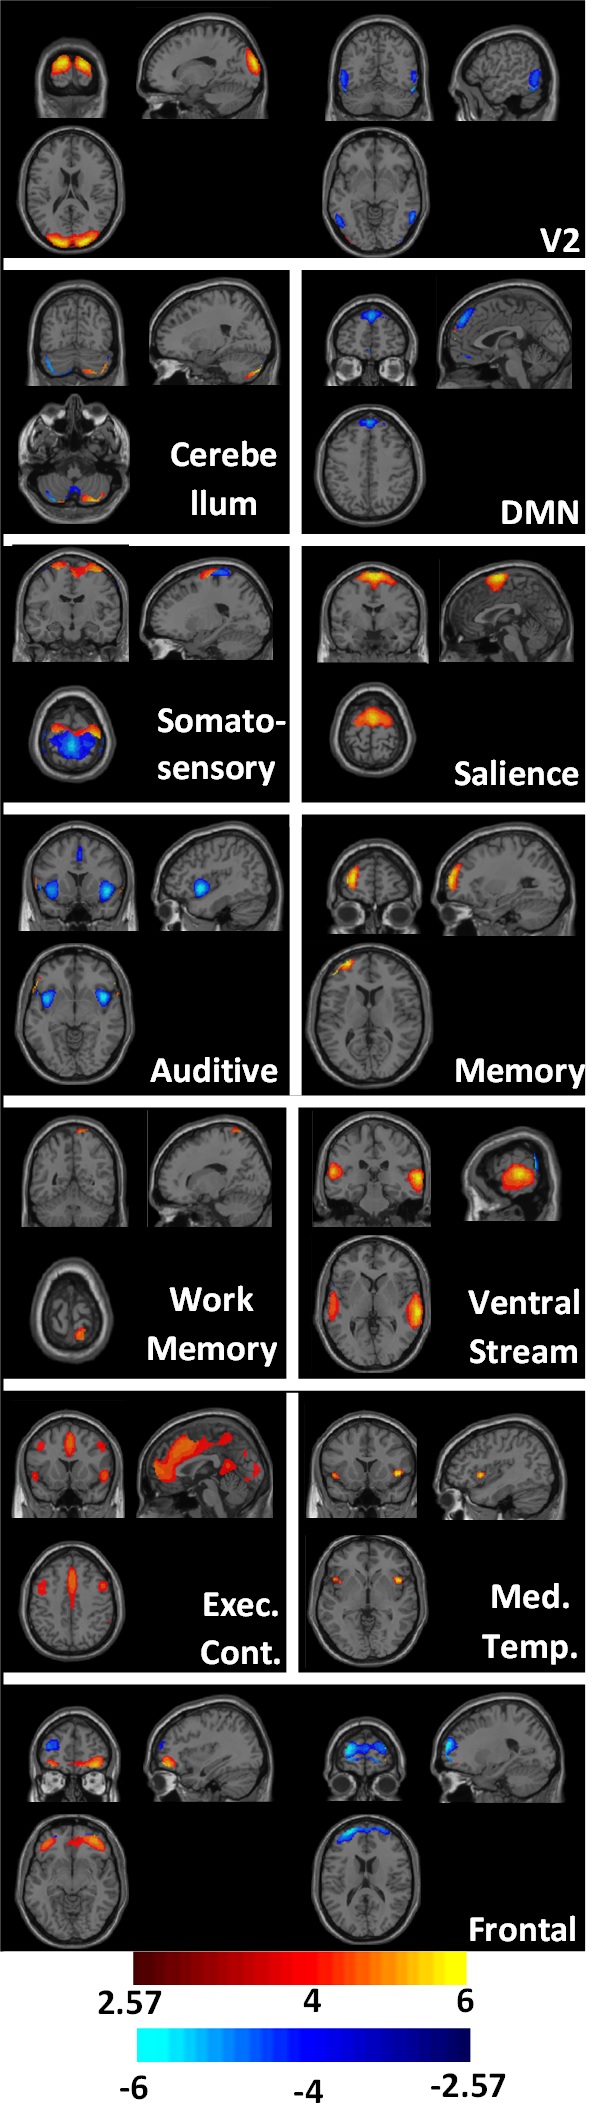
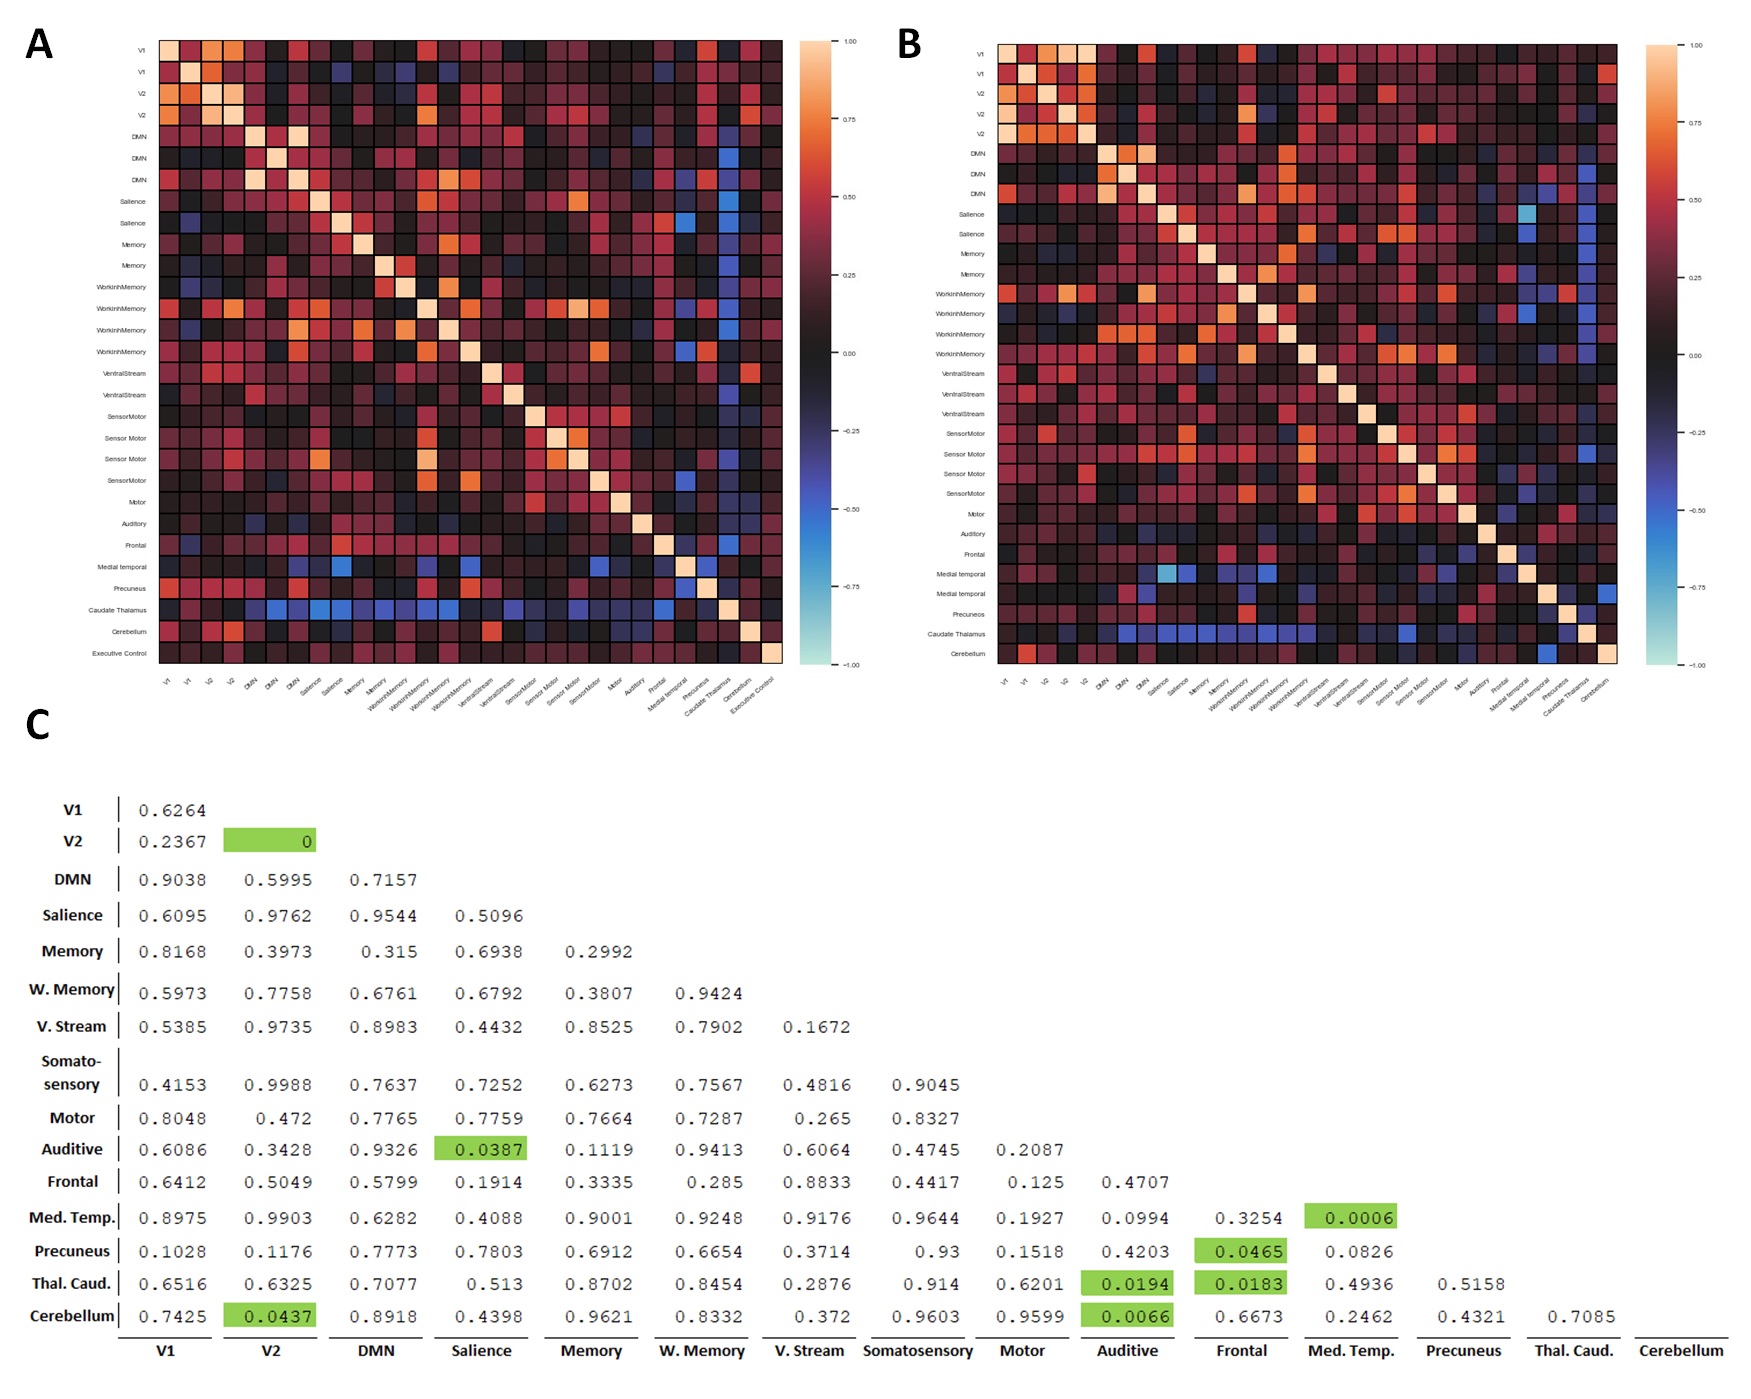
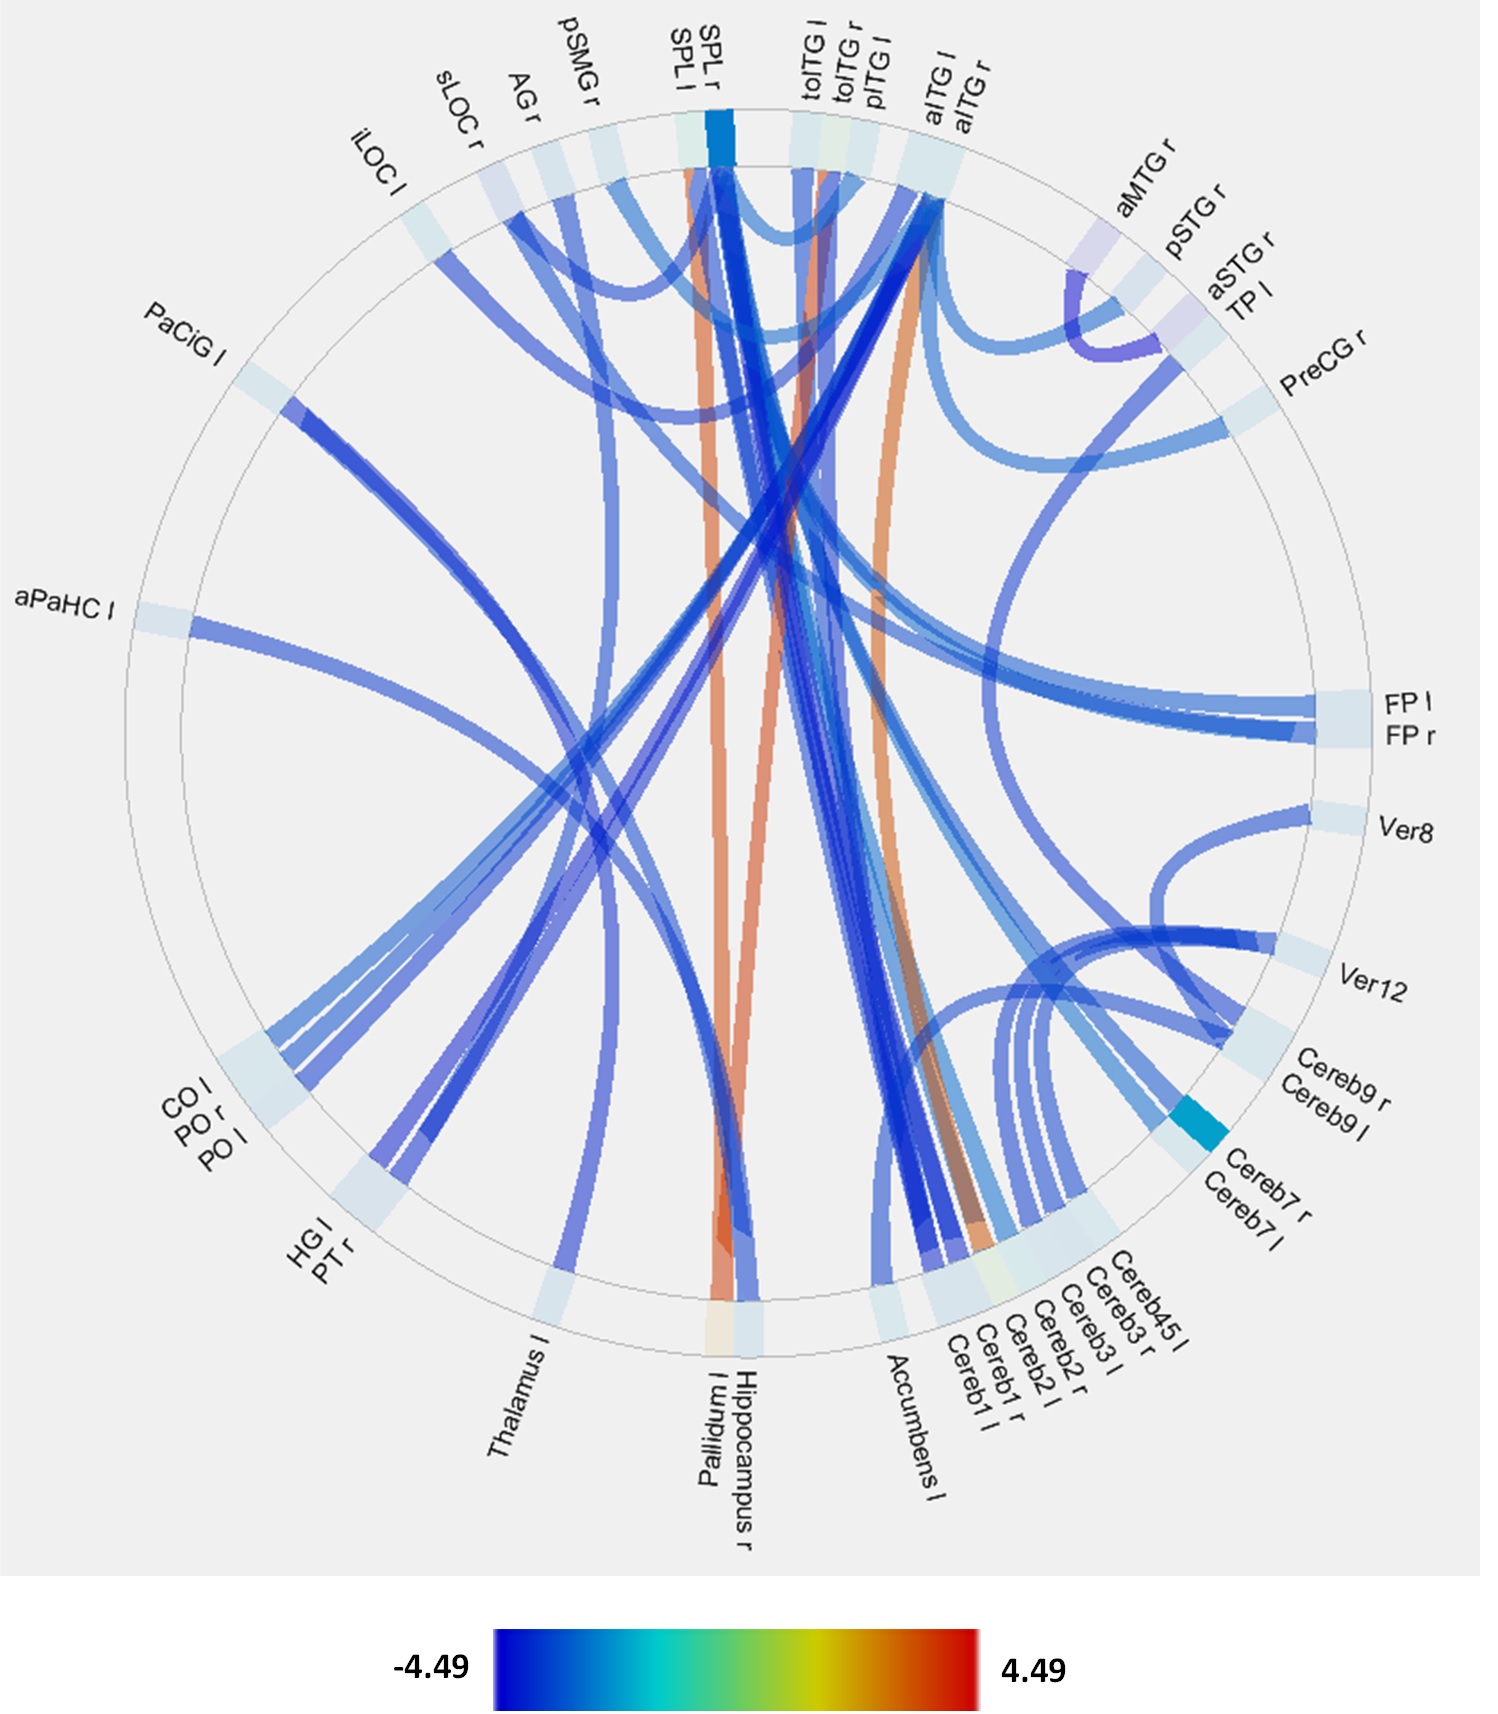
Results: Both groups presented the 15 RS-networks commonly known in field except for the Executive Control Network for the OB (see Figure 1). The OB groups recruited three times more brain regions for the different RS-networks when compared to NW (see Figure 2). These regions were functionally related to Visual, Motor, Auditory and Frontal brain function. The FC within RS-networks and with other RS-networks, was smaller for OB than NW (see Figure 3). This result was also found in a ROI-to-ROI analysis with much larger number of connections for the NW which involved the Cerebellum, Hippocampus, and the Left Inferior Gyrus (see Figure 4).
Conclusions: OB volunteers presented differences with NW patients regarding brain functional recruitment and functional wiring, that indicated the presence of different learning and functional physiological processes. More studies are required to assess if BMI could be the reason for these differences or just a consequence of it. As future work, graphical properties of the resting state networks obtained here will be correlated to anthropometric and cytokine data as well as IQ test results, trying to respond the question behind this study: Which is the physiological reason for cognitive delay in obese children.
Acknowledgements
We would like to thank CONAHCyT, RCUK, Newton Fund, KC London for their support for this project. Also, for their support of the Ph.D. student MIAdlR. We would also like to thank Hospital Infantil de México, Federico Gómez; for the use of their MR Scanner and working hours from their technologists, phlebotomists, psychiatrists, and all other technical personnel involved in this study.References
No reference found.Figures