2382
Application of MAP-MRI Diffusion Model in Preoperative Brain Development in Infants with Congenital Heart Disease1Lanzhou University Second Hospital, Lanzhou, China, 2Gansu Provincial Maternity and Child-Care Hospital, Lanzhou, China, 3Siemens Healthineers, Shanghai, China
Synopsis
Keywords: Neuro, Nervous system
Motivation: Non-invasive quantitative methods to assess the brain development of children with congenital heart disease (CHD) has been a hot topic .
Goal(s): The main focus of this study is to investigate how MAP-MRI can be used to assess preoperative brain development in children with CHD.
Approach: In this study, quantitative and correlational analyses of preoperative brain development in CHD children were performed using the multi-parameter indicators of the MAP-MRI diffusion model.
Results: The results show that children with CHD exhibit cerebral microstructural abnormalities preoperatively, and MAP-MRI parameter indicators can be used for early prediction of preoperative neurodevelopment in CHD children.
Impact: MAP-MRI parameter indicators can serve as imaging reference values for preoperative brain development in children with CHD, aiding clinical professionals in focusing on the neurodevelopment of these patients while treating their CHD.
Introduction
Neurodevelopmental abnormalities are common in children with congenital heart disease (CHD)[1-2]. The assessment of brain development in CHD children using non-invasive quantitative methods has been a recent research focus. MAP-MRI is a novel spatial data acquisition model derived from Diffusion Spectrum Imaging (DSI) that utilizes multiple quantitative parameters to describe the spatial structural characteristics of interwoven neural fibers[3-5]. This study primarily explores the application value of MAP-MRI in preoperative brain development assessment in CHD children.Methods
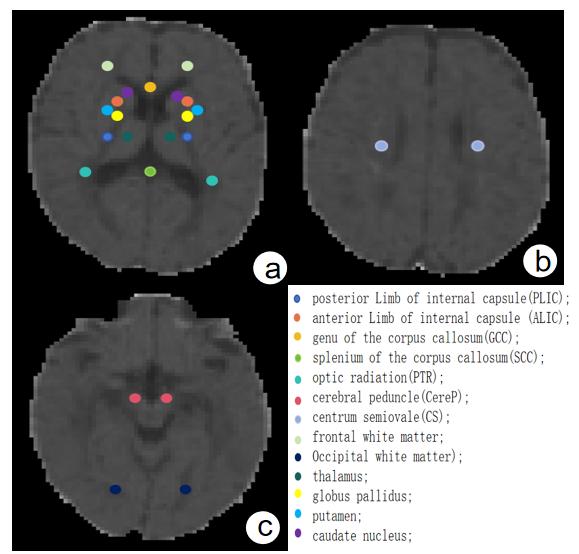
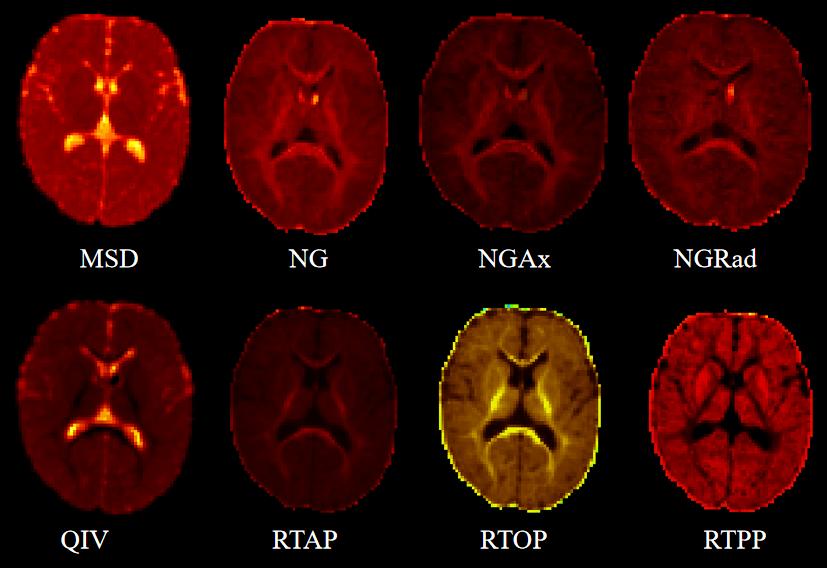
Prospective data was collected from 30 children with CHD aged 2 to 36 months who were admitted for treatment from February to October 2022, forming the observation group. Additionally, 30 healthy infants and toddlers of matching age and gender were collected to form the control group. Both groups of participants underwent Gesell Development Schedules (GESELL) development scale assessments. All participants underwent routine MRI and axial DSI scans on a 3T MRI (MAGNETOM Lumina, Siemens Healthineers, Erlangen,Germany) scanner. The DSI scan parameters were as follows: TR = 3000 ms, TE= 118 ms, slice thickness =3 mm, Field of View = 180 mm x 180 mm, matrix size = 220×100, 128 scan directions, maximum b-value = 2000 s/mm², scan time = 6 min 47 s. DSI images were processed using the NeuDiLab software developed in-house based on the tool DIPY (Difusion Imaging in Python, https://dipy.org/) to generate multiple MAP-MRI parameter maps. Using ITK-SNAP 4.0.1 software, 24 brain regions of interest (ROIs) were manually delineated on various parameter maps for both groups (as shown in Figure 1), and MAP-MRI parameter values were calculated (as shown in Figure 2).This study conducted the analysis using SPSS 27.0 software. The two independent sample t-tests were employed to compare the MAP-MRI parameter values and the scores of various functional areas of the GESELL between the two groups. Pearson correlation analysis was used to observe the correlations between the MAP-MRI parameter values in different brain regions and the scores of various functional areas in the GESELL. A p-value of less than 0.05 was considered statistically significant, indicating a significant difference.Results
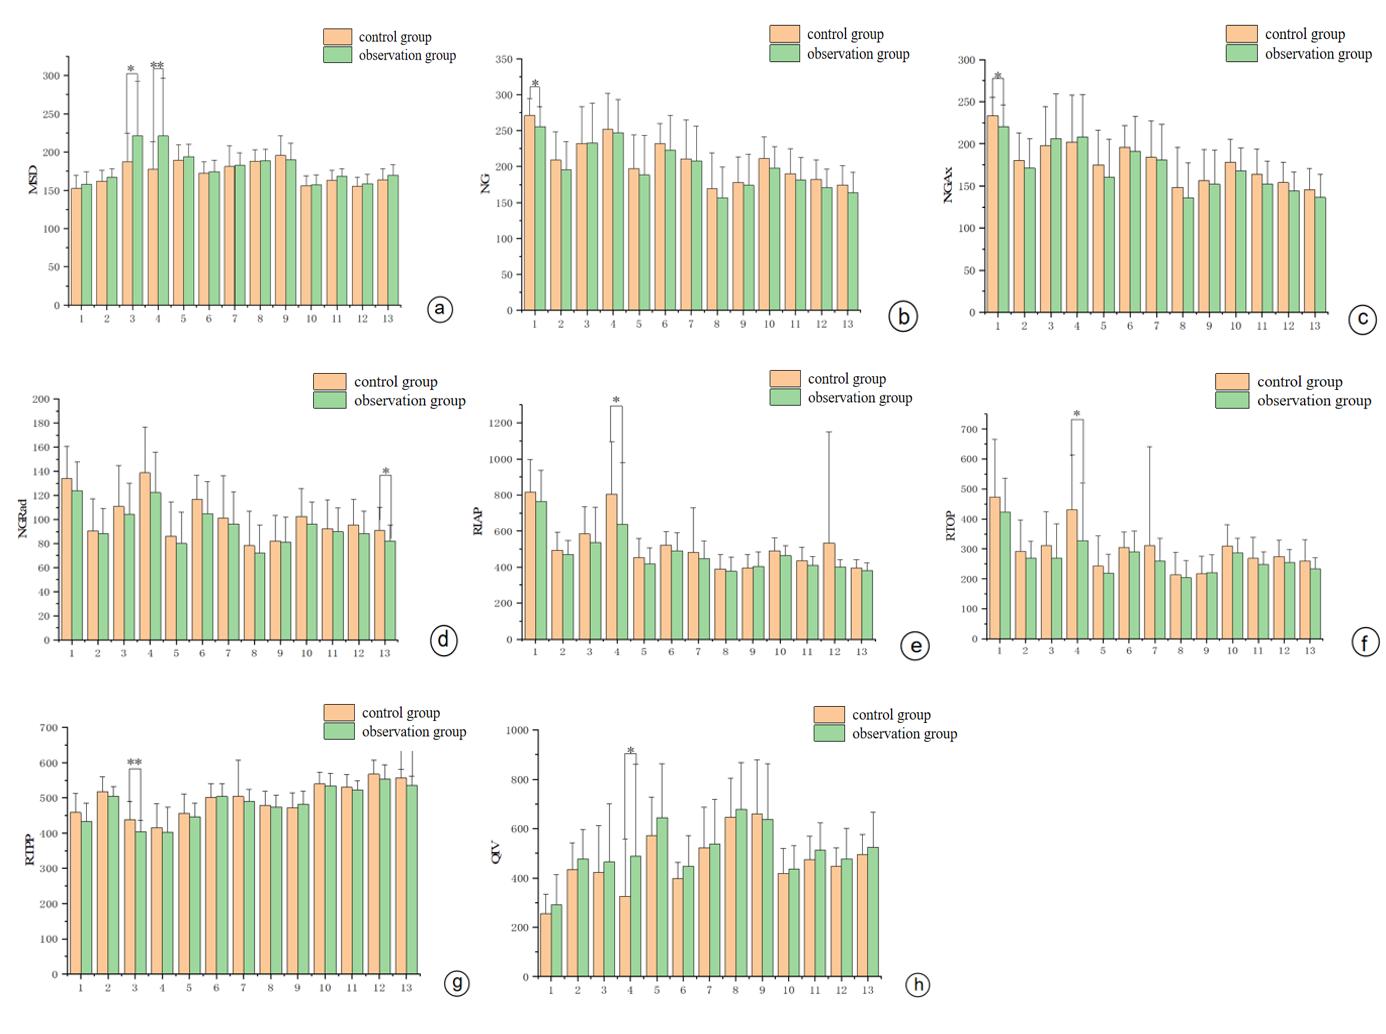
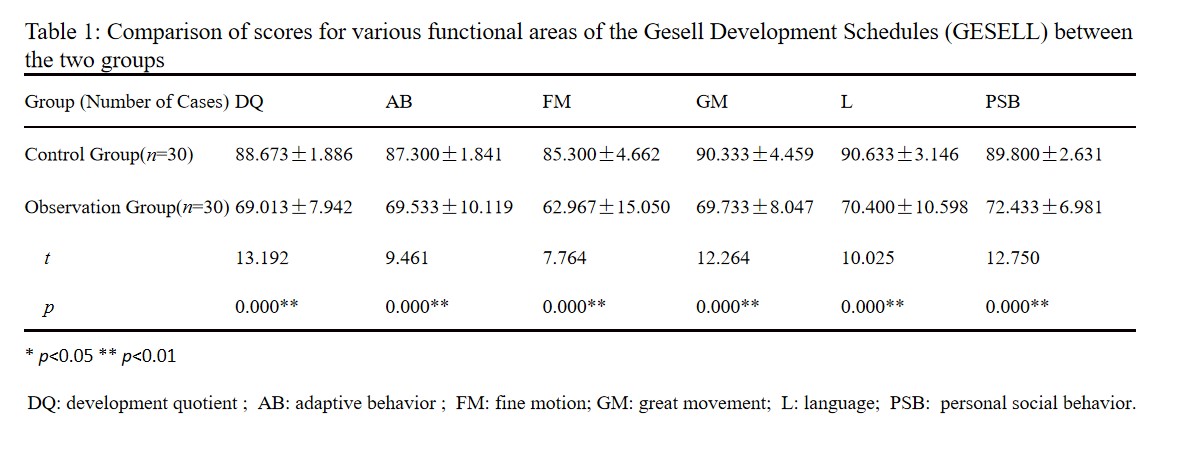
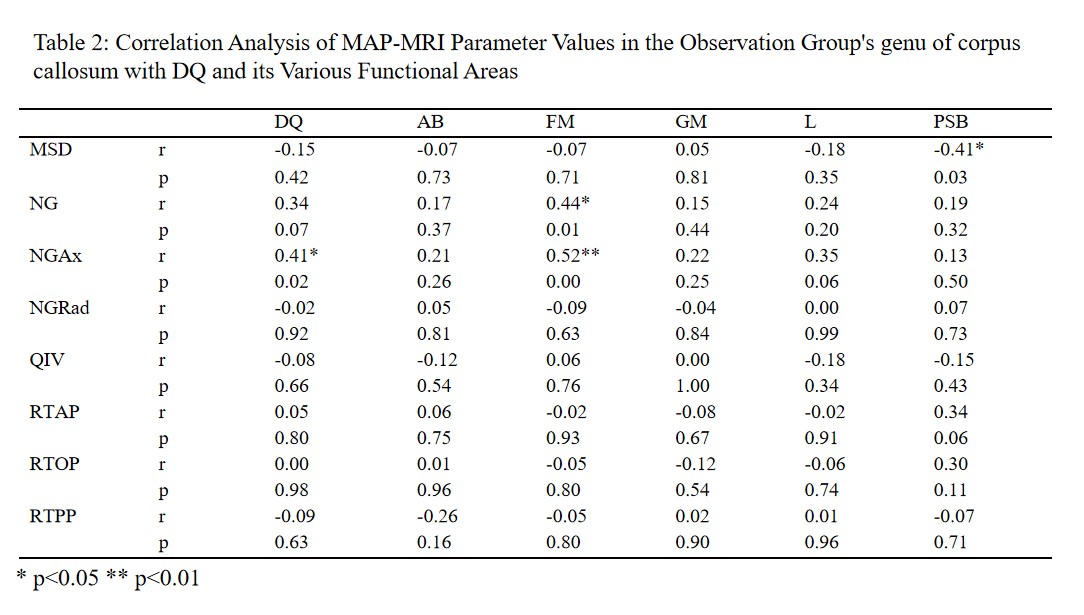
The two groups did not show statistically significant differences in terms of age and gender. In the observation group, the posterior limb of the internal capsule had lower NG and NGAx values compared to the control group. The MSD of genu of corpus callosum was higher in the observation group, while RTPP was lower than the control group. The MSD and QIV of midsection of the corpus callosum were both higher in the observation group, while RTAP and RTOP were lower than the control group. The caudate nucleus had lower NGRad and RTPP values in the observation group compared to the control group, and these differences were statistically significant (P < 0.05) (as shown in Figure 3).Pearson correlation analysis revealed that in the observation group, the GESELL developmental quotients (DQ), AB, FM, GM, L, and PSB were all lower than those in the control group, showing significant differences (P < 0.05) (as shown in Table 1).In the observation group, the MSD in the genu of corpus callosum showed a negative correlation with PSB (r= -0.41, p= 0.03), while NG showed a positive correlation with FM (r= 0.44, p= 0.01), NGAx showed positive correlations with DQ (r= 0.41, p= 0.02) and FM (r= 0.52, p = 0.00) (as shown in Table 2).Discussion
NG is capable of reflecting the complexity of brain tissue structure and can provide a better assessment of anisotropy across white matter fiber tracts. NGAx and NGRad indirectly reflect the degree of NG changes. An increase in MSD values indicates water molecule disruption leading to the loss of anisotropy due to fiber integrity damage. The decrease in RTOP is associated with axonal injury in fiber bundles. When RTAP and RTPP significantly decrease, it implies reduced neuron density, while a decrease in RTAP and an increase in RTPP suggest the presence of crossing fibers. The QIV parameter is more sensitive to slow or restricted diffusion and can also provide insights into changes in tissue composition.In this study, the Gesell scale was applied to assess the neurological development of CHD children preoperatively. The observation group showed correlations between certain MAP-MRI parameter indicators in various brain regions and developmental quotients, indicating predictive value for detecting neurological development abnormalities.Conclusion
The MAP-MRI diffusion model can indicate the presence of abnormal brain microstructure in children with congenital heart disease (CHD) before surgery. Its multiple parameter indicators can provide early predictions of preoperative neurodevelopmental abnormalities in CHD children.Acknowledgements
We would like to thank the whole study team at the Gansu provincial Maternity and Child-care Hospital and the NMR Room of Lanzhou University Second Hospital, for their continued support.References
[1] Bhattacharjee I, Mohamed MA, Nandakumar V, et al. Scoring of brain magnetic resonance imaging and neurodevelopmental outcomes in infants with congenital heart disease. Early Hum Dev. 2022 ;169:105574.
[2] Ehrler M, Brugger P, Greutmann M, et al. White matter microstructure and executive functions in congenital heart disease from childhood to adulthood: A pooled case-control study. Child Neuropsychol.2023;29(7):1064-1087.
[3] Özarslan E, Koay CG, Shepherd TM, et al. Mean apparent propagator (MAP) MRI: a novel diffusion imaging method for mapping tissue microstructure. Neuroimage. 2013 ;78:16-32.
[4] Le H, Zeng W, Zhang H, et al. Mean Apparent Propagator MRI Is Better Than Conventional Diffusion Tensor Imaging for the Evaluation of Parkinson's Disease: A Prospective Pilot Study. Front Aging Neurosci. 2020;24(12):563595.
[5] Chen HJ, Zhan C, Cai LM, et al. White matter microstructural impairments in amyotrophic lateral sclerosis: A mean apparent propagator MRI study. Neuroimage Clin. 2021;32:102863.
Figures