2380
Brain Microstructural Changes in Children with Infantile Tremor Syndrome After Vitamin-B12 Intervention Using Diffusion Tensor Imaging1University of Miami, Miami, FL, United States, 2Postgraduate Institute of Medical Education and Research, Chandigarh, India
Synopsis
Keywords: Neuro, Pediatric, Other Interventional
Motivation: Infantile Tremor syndrome (ITS) is a neurocutaneous syndrome observed in infants breastfed by vegetarian mothers who are deficient in vitamin B12. Its is accompanied by cerebral and white matter atrophy, delayed myelination, and delayed neurodevelopment.
Goal(s): To evaluate the efficacy of B12 treatment in infants with ITS on microstructural development and myelination using DTI.
Approach: In this longitudinal study, changes in DTI metrics are evaluated before and after vitamin B12 treatment using an atlas-based approach.
Results: Results show substantial increases in WM FA and decrease in WM RD, as evidence of the role of B12 in the myelination process.
Impact: Our findings will contribute to understanding the pathophysiological basis of ITS and highlight the efficacy of B12 treatment in rapidly reversing delayed brain development
Introduction
Infantile Tremor syndrome (ITS) is a neurocutaneous syndrome observed in infants breastfed by vegetarian mothers who are deficient in vitamin B12 (B12). It is primarily reported from India, Southeast Asia and Africa.1 Its clinical presentations include lethargy, irritability, developmental delay, hypotonia, sparse hair, hyperpigmentation of hands and feet, and involuntary movements commonly in the form of tremors.2,3 Structural neuroimaging observations include cerebral and white matter (WM) atrophy, and delayed myelination.1 However, to the best of our knowledge, there are no diffusion tensor imaging (DTI) based studies examining brain microstructural changes in ITS. B12 is involved in microstructural development of brain and myelination, and injectable B12 has been used as a treatment for ITS. Therefore, this study aims to evaluate brain microstructural changes in infants with ITS who responded to B12 treatment, and study these changes in relation to clinical and neurodevelopmental outcomes.Methods
Participants: This longitudinal study was performed at the Postgraduate Institute of Medical Education & Research (PGIMER). Informed consent was obtained from the parents/guardians of all participants. Thirty infants between 1 and 30 months of age with symptoms of vitamin B12 deficiency were included and received an arm injection of B12 and other multivitamins till recovery.Clinical and Neurodevelopmental Data: Blood samples were drawn to determine changes in B12, homocysteine, and hemoglobine levels. Changes in neurodevelopmental outcomes were assessed using the CAPUTE scales4 which contains the Clinical Linguistic & Auditory Milestone Scale (CLAMS), the Cognitive Adaptive Test (CAT), and composite developmental quotient (DQ = CLAMS+CAT).
MRI acquisition: Diffusion-weighted (DW) MRI data were acquired on a 3T Philips Ingenia scanner using the following protocol: b = 800 s/mm2, 16 gradient encoding directions, TR/TE= 2814/86 ms, 1.61×1.61×2.5 mm3 voxel dimension, and 48 axial slices.
Data processing and Analysis: DW-MRI data were processed with FSL5 and Dipy6 to obtain fractional anisotropy (FA), mean diffusivity (MD), axial diffusivity (AD), and radial diffusivity (RD) maps. Changes in DTI metrics were evaluated between each baseline and follow-up with an atlas-based analysis using 136 regions of interest (ROI) from the JHU-Pediatric18-SS atlas.7 Demographic and clinical characteristics were assessed using the Kruskal-Wallis or χ2 tests. Analysis of longitudinal DTI data were performed using repeated measure 2-way analysis of variance (ANOVA), with time and sex as independent variables, to find significant changes in DTI metrics-by-ROI between baseline and follow-up and between male and female subjects. Cohen’s D effect sizes were calculated to identify ROIs that had the highest change after B12 treatment. Finally, DTI metrics were correlated with clinical and neurodevelopmental scores. Statistical tests were performed using R (significance at p<0.05, FDR corrected).
Results
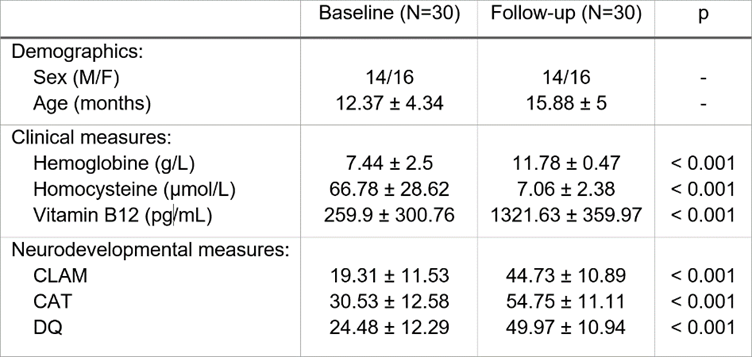
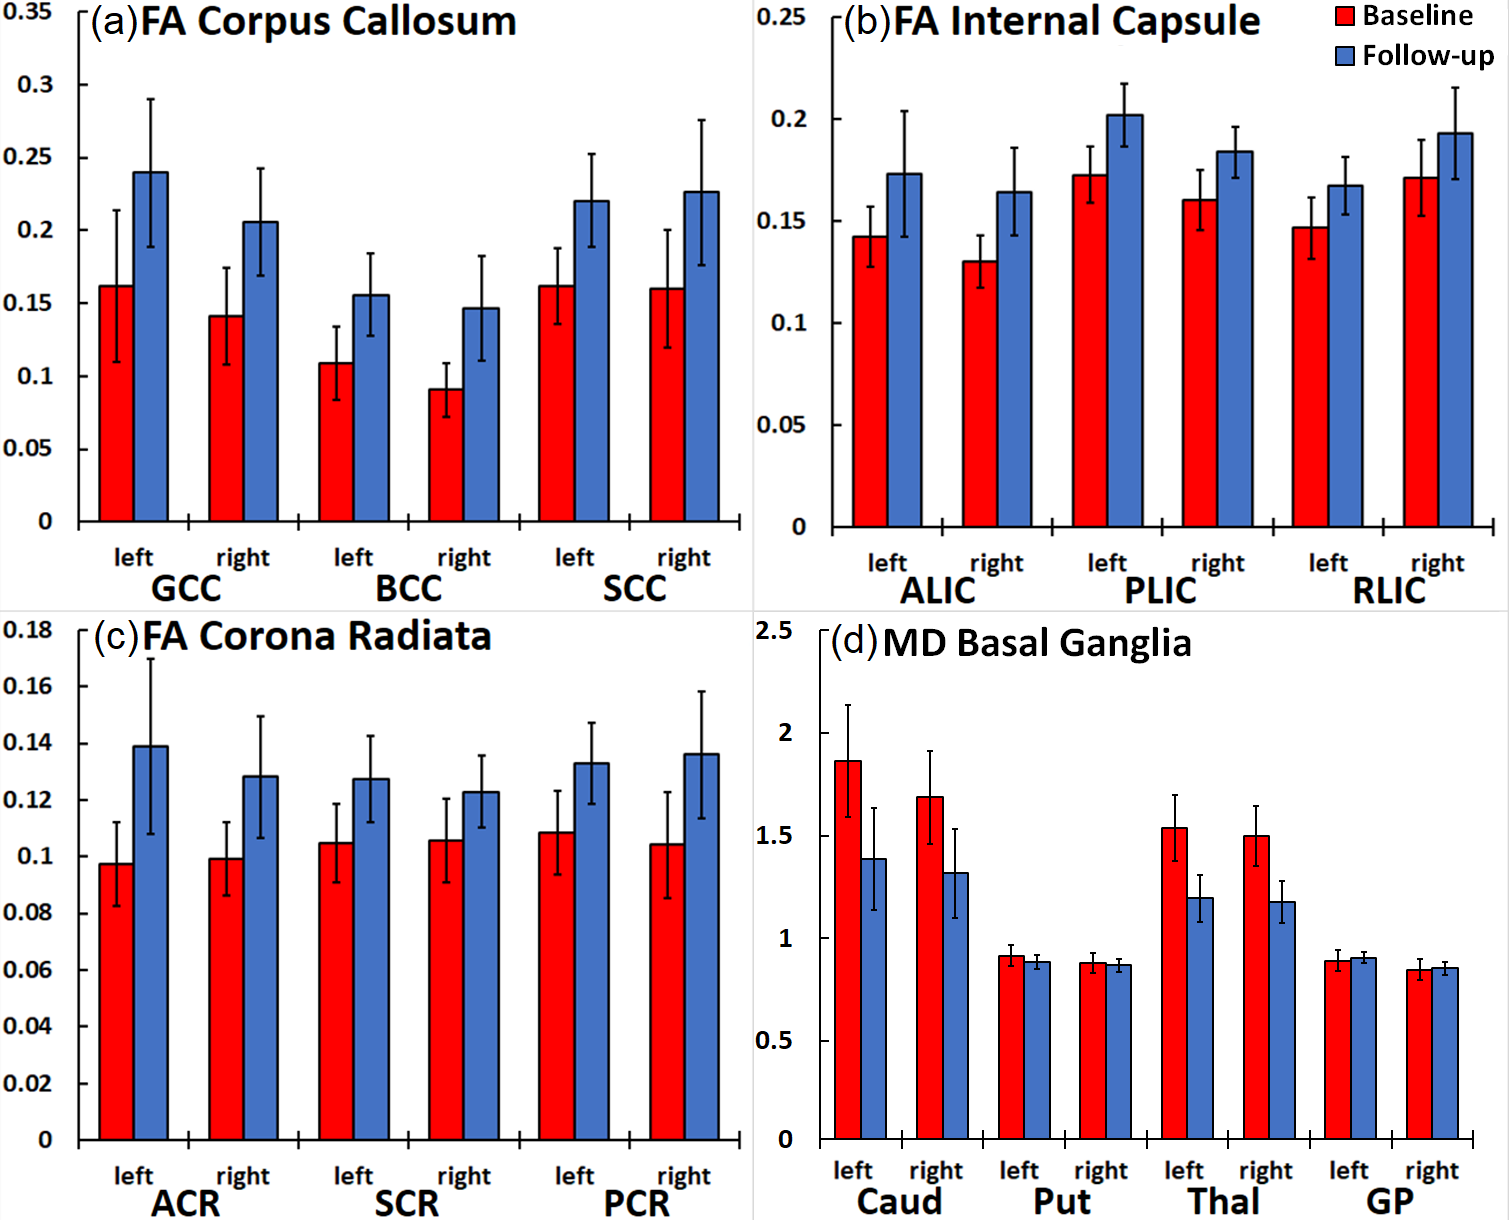
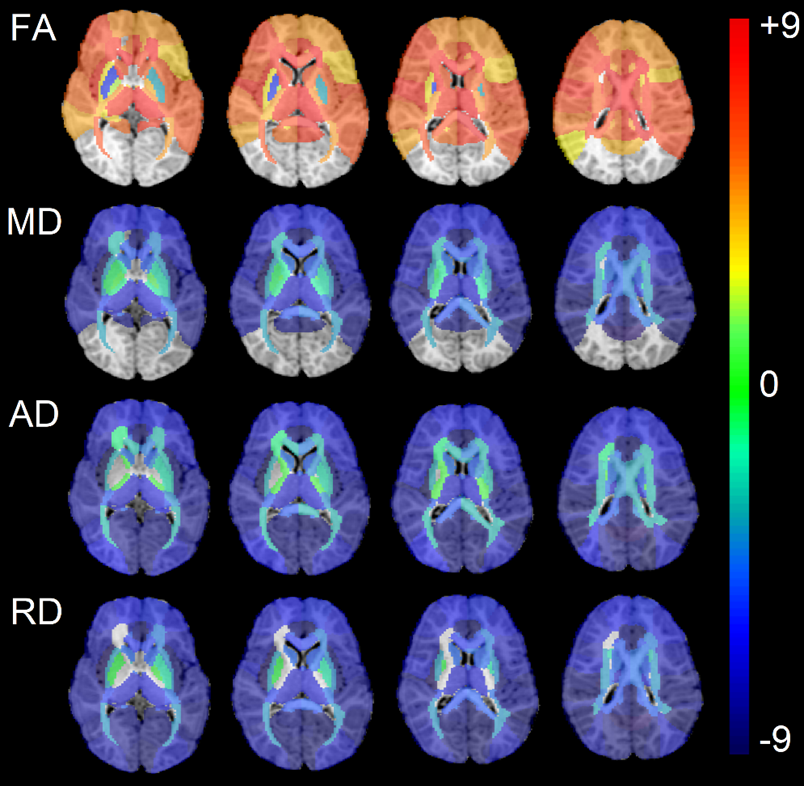
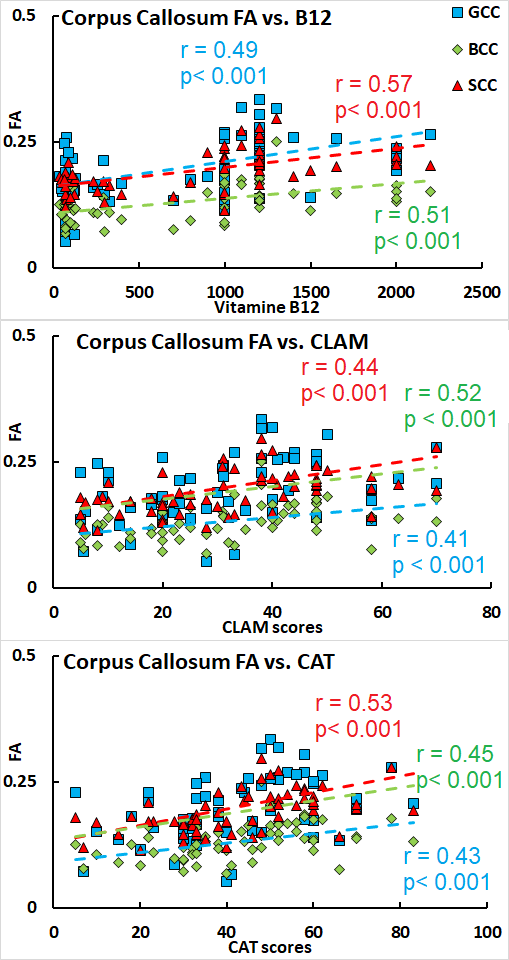
Patient characteristics, clinical, and neurodevelopmental scores are summarized in Figure 1. At baseline, all infants had biochemical evidence of B12 deficiency (<300 pg/ml B12) as hyper-homocysteinemia (>15 µmol/L homocysteine) that reversed to normal levels with B12 therapy. Neurodevelopmental measures showed developmental delays (DQ<70) in all infants, but were significantly improved post-treatment, although average DQ was still sub-optimal. Two-way ANOVA analysis of DTI metrics showed increases in FA and decreases in MD, AD, and RD in nearly all WM ROIs (e.g. corpus callosum, corona radiata, and internal capsule in Figures 2-a, 2-b, and 2-d, respectively), and decrease in MD in most grey matter (GM) ROIs (e.g. basal ganglia in Figure 2-d). No differences were observed by sex. Mapping effect sizes differences by ROI reflects the magnitude of change and identifies which ROIs had the most significant alterations (Figure 3). Increases in FA were found to be highest in the corpus callosum and significantly correlated with increased B12 and with CLAM, CAT, and DQ developmental scores (Figure 4). Cortical GM ROIs saw the most decrease in MD, AD, and RD.Discussion
Our results show that B12 treatment resulted in significant improvements in clinical, developmental, and brain health in children with ITS. These changes were identical between male and female infants. The substantial increase in FA and decrease in RD in WM point to rapid myelination, with the highest changes occurring in the corpus callosum, fornix, cerebellar peduncle, corona radiata, and internal capsule (Figure 3). Decreases in MD in cortical GM ROIs point to a reduction in cortical atrophy, as corroborated by structural MRI findings. Our results are also the first to directly link microstructural tissue changes with B12 levels, emphasizing the role of B12 in the myelination process, and with neurodevelopmental scores revealing an overall improvement in neurological health.Conclusion
Our findings will contribute to understanding the pathophysiological basis of ITS and highlight the efficacy of B12 treatment in rapidly reversing delayed brain development.Acknowledgements
This study was supported by the Postgraduate Institute of Medical Education & Research institutional thesis grant.References
1. Goraya JS, Kaur S. Infantile tremor syndrome: A review and critical appraisal of its etiology. J Pediatr Neurosci. 2016;11(4):298-304.
2. Gupta BD, Maheshwari RK, Miglani N. Infantile tremor syndrome. Indian J Pediatr. 1978;45:221-8.
3. Sharda B, Bhandari B. Infantile tremor syndrome. Indian Pediatr. 1987;24:415–21.
4. Capute AJ, Shapiro BK, Wachtel RC, et al. The clinical linguistic and auditory milestone scale (CLAMS). Identification of cognitive defects in motor-delayed children. Am J Dis Child. 1986;140:694–8.
5. Jenkinson M, Beckmann CF, Behrens TE, et al. Fsl. Neuroimage. 2012;62(2):782-790.
6. Garyfallidis E, Brett M, Amirbekian B, et al. Dipy, a library for the analysis of diffusion MRI data. Front Neuroinform. 2014;8:8.
7. Oishi K, Mori S, Donohue PK, et al. Multi-contrast human neonatal brain atlas: application to normal neonate development analysis. Neuroimage. 2011;56(1):8-20.
Figures