2376
The cumulative impact of clinical risk factors on structural brain networks and executive functions in adolescents with congenital heart disease1Child Development Center, University Children's Hospital Zurich, Zurich, Switzerland, 2University Research Priority Program (URPP), Adaptive Brain Circuits in Development and Learning (AdaBD), University of Zurich, Zurich, Switzerland, 3Center for MR Research, University Children's Hospital Zurich, Zurich, Switzerland, 4Pediatric Cardiology, Pediatric Heart Center, Department of Surgery, University Children's Hospital Zurich, Zurich, Switzerland
Synopsis
Keywords: Neuro, Diffusion/other diffusion imaging techniques
Motivation: Congenital heart disease (CHD) negatively impacts brain development and cognition.
Goal(s): We aim to elucidate the role of clinical and environmental factors on brain development and cognition.
Approach: A cumulative clinical risk (CCR) score derived from neonatal, cardiac, and neurological variables, brain connectivity metrics using diffusion-MRI, and cognitive outcomes were obtained in 53 CHD adolescents and 75 controls.
Results: Higher CCR scores correlated with weaker brain network strength in a fronto-parietal-thalamic network, lower network segregation and poorer cognitive function, independent of family-environmental factors. These findings underscore the need for early risk assessment to predict brain development and aid vulnerable adolescents with CHD.
Impact: Adolescents with congenital heart disease demonstrate altered brain networks, particularly those who face a cumulative exposure to multiple risk factors over time. Early assessment of risk load could help predict brain development and support the most vulnerable patients early on.
Methods: Adolescents with CHD who underwent infant open-heart surgery, and healthy controls between 10 and 15 years of age were eligible for this study8. Diffusion MRI (dMRI) data was acquired on a GE MR750 MRI scanner (GE HealthCare, Milwaukee, WI, USA), with TR/TE=7500/89 ms; matrix=96x96; FOV=280 mm, slice thickness=3.6mm. A total of 35 diffusion-weighted gradient directions were acquired with b=1000 s/mm2 and four non-diffusion weighted images. 3D T1-weighted cerebral MRI data were collected with an inversion-recovery prepared, spoiled gradient echo volume (IR-SPGR) with TI/TE/TR= 600/5/11 ms and a voxel resolution of 1x1x1mm3. For dMRI data, denoising using patch2self9, Gibbs ringing correction10,11, motion and eddy current correction12, and B1 bias field correction10,11 was conducted. To reconstruct structural brain networks, single-shell three-tissue constrained spherical deconvolution (SS3T-CSD) was conducted with MRtrix3Tissue13,14. Probabilistic anatomically constrained tractography was performed to model the white matter fiber orientation distribution with the iFOD2 algorithm and 10 million streamlines were estimated (SIFT2). Dynamic seeding was used and a stopping criteria of streamline estimation was implemented based on the five-tissue-type image (white matter, subcortical and cortical grey matter, cerebrospinal fluid, and pathological tissue), which was generated by segmenting the 3D T1 images with FreeSurfer 5.3. Biologically accurate weights were generated for each subject and were used to normalize for inter-subject connection density. Weighted, undirected structural connectivity networks were formed in 162x162 matrices where edges correspond to the sum of weighted streamlines and nodes correspond to the grey matter regions derived from the AAL3v1 atlas. Structural network metrics were estimated with network-based statistics (NBS) and graph theory using Brain Connectivity Toolbox (BCT). A cumulative clinical risk (CCR) score was built by summing up binary risk factors (neonatal, cardiac, neurologic) based on clinically relevant thresholds. Family-environmental factors (parental education, parental mental health, and family function) were assessed with standardized parent-reported questionnaires. Cognitive data on executive functioning was acquired with a standardized neuropsychological test battery and an age-adjusted executive function summary score (z-score) was built. All analyses were corrected for age and sex.
Results: A total of 53 patients (10% with single-ventricle CHD, mean age 13.6±1.1 years, 64% male sex) and 75 healthy controls (mean age 12.9±11.4 years, 49% male sex) were included in the analyses. Patients demonstrated significantly poorer executive function performance relative to controls (Patients: mean=-1.0±1.1, Controls: mean=-0.1±1.0, p<0.001). Graph theory analysis identified that patients had similar network integration, estimated by global efficiency (β=0.13, p=0.141), but lower network segregation, estimated by mean local efficiency (β=0.20, p=0.027), in comparison to controls. Network-based statistics identified a dense network which had lower network strength in patients compared to controls (p<0.001; Figure 1). In patients, a higher CCR score was associated with lower network segregation (β=-0.40, p=0.004; Figure 2), lower edge strength of a subnetwork including inter-frontal and fronto-parietal-thalamic connections (p<0.001; Figure 3), and with poorer executive functioning. There was no association between any network connectivity measure and family-environmental factors (all p>0.05). Poorer executive functioning was associated with lower network integration (β=0.34, p=0.015) and network segregation (β=0.34, p=0.013.
Discussion and Conclusion: We provided important evidence that structural brain network alterations, which have been described in neonates with CHD, persist into adolescence. Importantly, we demonstrated that patients with CHD, who face a cumulative exposure to multiple clinical risk factors over time, are particularly vulnerable to alterations in structural brain networks and poorer executive functioning. Quantifying the cumulative load of risk early in life may improve the prediction of long-term brain development of the individual patient. This can help to identify and support the most vulnerable patients as early as possible and to guide clinical and surgical decision making.
Acknowledgements
This project was supported by the Swiss National Science Foundation (SNF 32003B_172914) and the University Research Priority Program (URPP) ‘Adaptive Brain Circuits in Development and Learning (AdaBD)’ of the University of Zurich.References
1. Latal B. Neurodevelopmental Outcomes of the Child with Congenital Heart Disease. Clin Perinatol. 2016;43(1):173-185. doi:10.1016/j.clp.2015.11.012
2. Ehrler M, Bellinger DC, Cassidy AR, Newburger JW, Calderon J. Social cognition and behavioral outcomes in congenital heart disease: profiles and neuropsychiatric comorbidities. Child Neuropsychology. Published online 2023. doi:10.1080/09297049.2023.2196398
3. Sanz JH, Wang J, Berl MM, Armour AC, Cheng YI, Donofrio MT. Executive Function and Psychosocial Quality of Life in School Age Children with Congenital Heart Disease. Journal of Pediatrics. 2018;202:63-69. doi:10.1016/j.jpeds.2018.07.018
4. Feldmann M, Guo T, Miller SP, et al. Delayed maturation of the structural brain connectome in neonates with congenital heart disease. Brain Commun. 2020;2(2). doi:10.1093/braincomms/fcaa209
5. Bhroin MN, Seada SA, Bonthrone AF, et al. Reduced structural connectivity in cortico-striatal-thalamic network in neonates with congenital heart disease. Neuroimage Clin. 2020;28. doi:10.1016/j.nicl.2020.102423
6. Schmithorst VJ, Votava-Smith JK, Tran N, et al. Structural network topology correlates of microstructural brain dysmaturation in term infants with congenital heart disease. Hum Brain Mapp. 2018;39(11):4593-4610. doi:10.1002/hbm.24308
7. Panigrahy A, Schmithorst VJ, Wisnowski JL, et al. Relationship of white matter network topology and cognitive outcome in adolescents with d-transposition of the great arteries. Neuroimage Clin. 2015;7:438-448. doi:10.1016/j.nicl.2015.01.013
8. Ehrler M, Naef N, Tuura ROG, Latal B. Executive function and brain development in adolescents with severe congenital heart disease (Teen Heart Study): protocol of a prospective cohort study. BMJ Open. 2019;9(10). doi:10.1136/bmjopen-2019-032363
9. Fadnavis S, Batson J, Garyfallidis E. Patch2Self: Denoising Diffusion MRI with Self-Supervised Learning.
10. Tournier JD, Smith R, Raffelt D, et al. MRtrix3: A fast, flexible and open software framework for medical image processing and visualisation. Neuroimage. 2019;202. doi:10.1016/j.neuroimage.2019.116137
11. Kellner E, Dhital B, Kiselev VG, Reisert M. Gibbs-ringing artifact removal based on local subvoxel-shifts. Magn Reson Med. 2016;76(5):1574-1581. doi:10.1002/mrm.26054
12. Smith SM. Fast robust automated brain extraction. Hum Brain Mapp. 2002;17(3):143-155. doi:10.1002/hbm.10062
13. Dhollander T, Connelly A. A Novel Iterative Approach to Reap the Benefits of Multi-Tissue CSD from Just Single-Shell (+b=0) Diffusion MRI Data. Vol 24.; 2016.
14. Dhollander T, Mito R, Raffelt D, Connelly A. Improved white matter response function estimation for 3-tissue constrained spherical deconvolution. Proc Intl Soc Mag Reson Med. Published online 2019. https://cds.ismrm.org/protected/19MProceedings/PDFfiles/0555.html
Figures
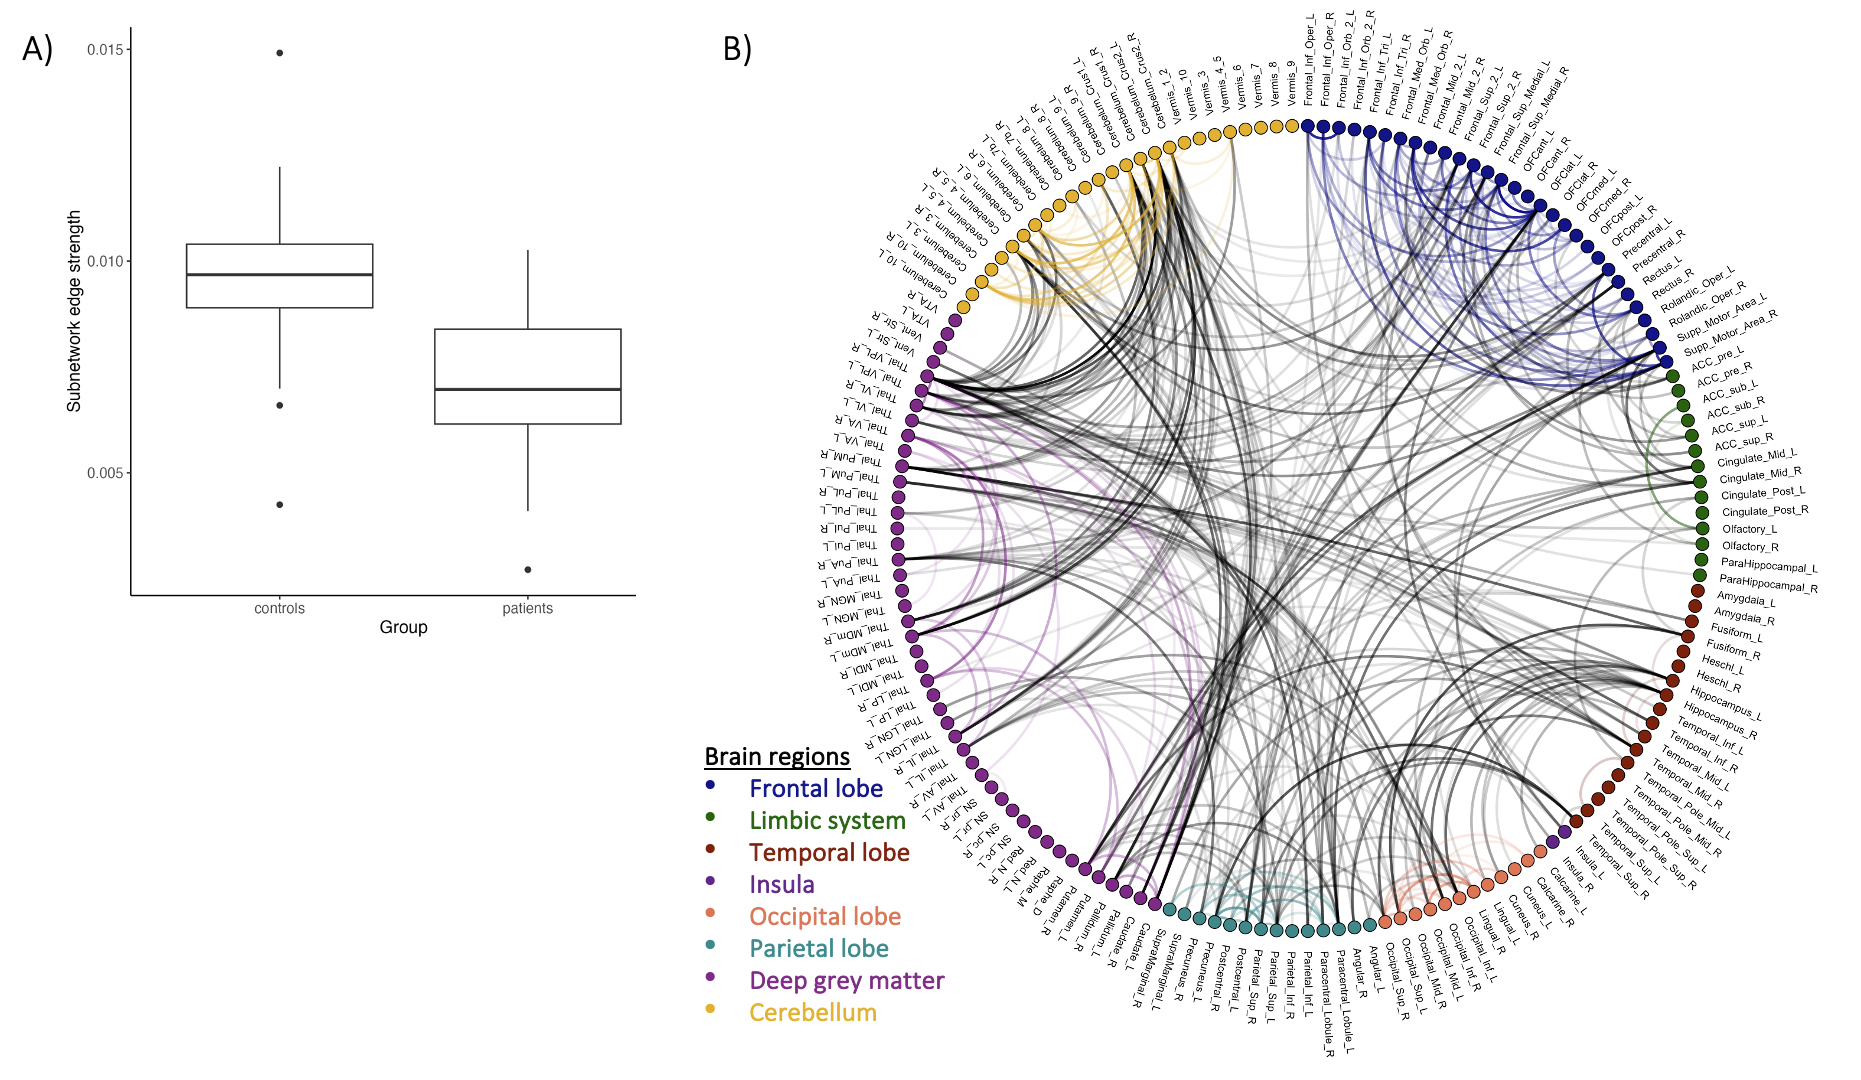
NBS-derived subnetwork with lower network connectivity strength in patients compared to controls
Note. Network contains 421 edges connecting 130 nodes. A) Box plots representing group comparison of mean subnetwork edge strength. The lower/upper box border=the first/third quartile. Thick line=median. Dots=outliers. B) Circular graph. _L=left hemisphere, _R=right hemisphere. Lines represent significant edges, the darker the stronger the effect. Colored edges connect nodes of the same brain region. Grey edges connect nodes of different brain regions.
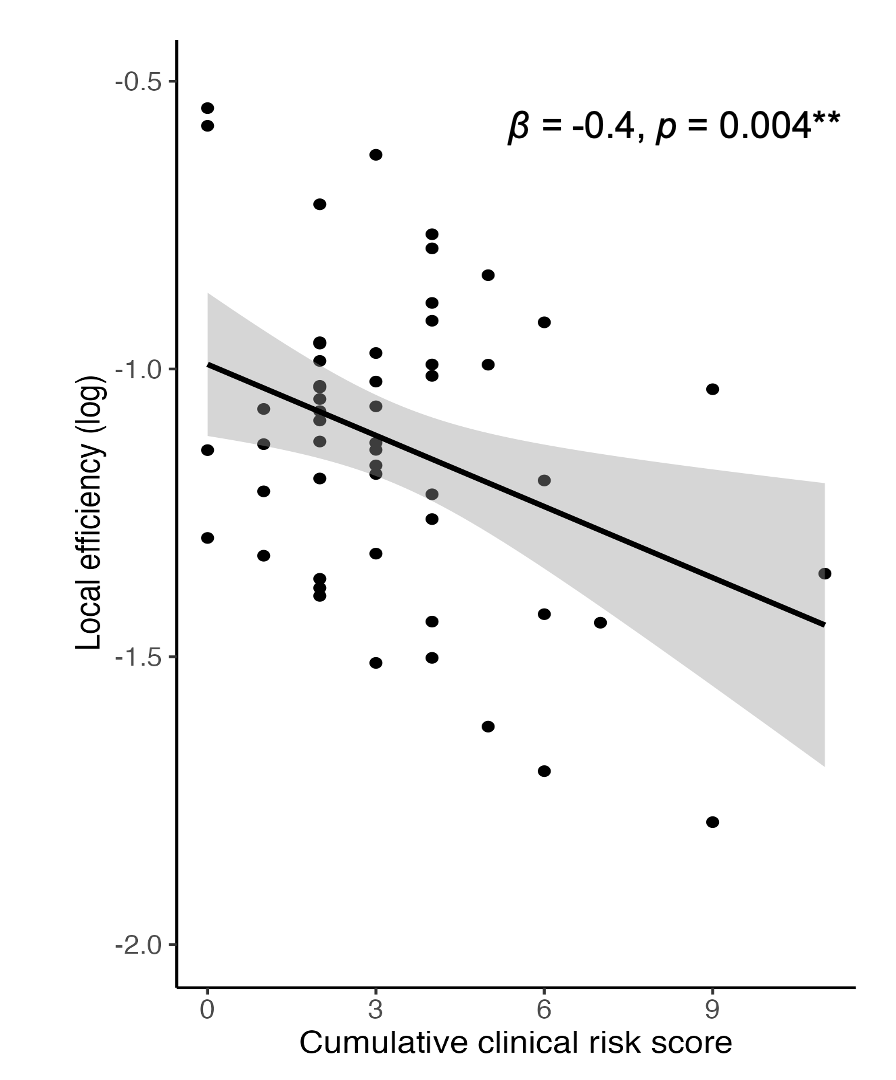
Association between network segregation, estimated by local efficiency, and cumulative clinical risk score
Note. Local efficiency was log transformed to reach normal distribution of residuals. The model was corrected for sex and age. ß=standardized regression coefficient. p=p-value. * p<0.05, ** p<0.01, *** p<0.001. Line=regression line. Dots=individuals. Grey area=standard error.
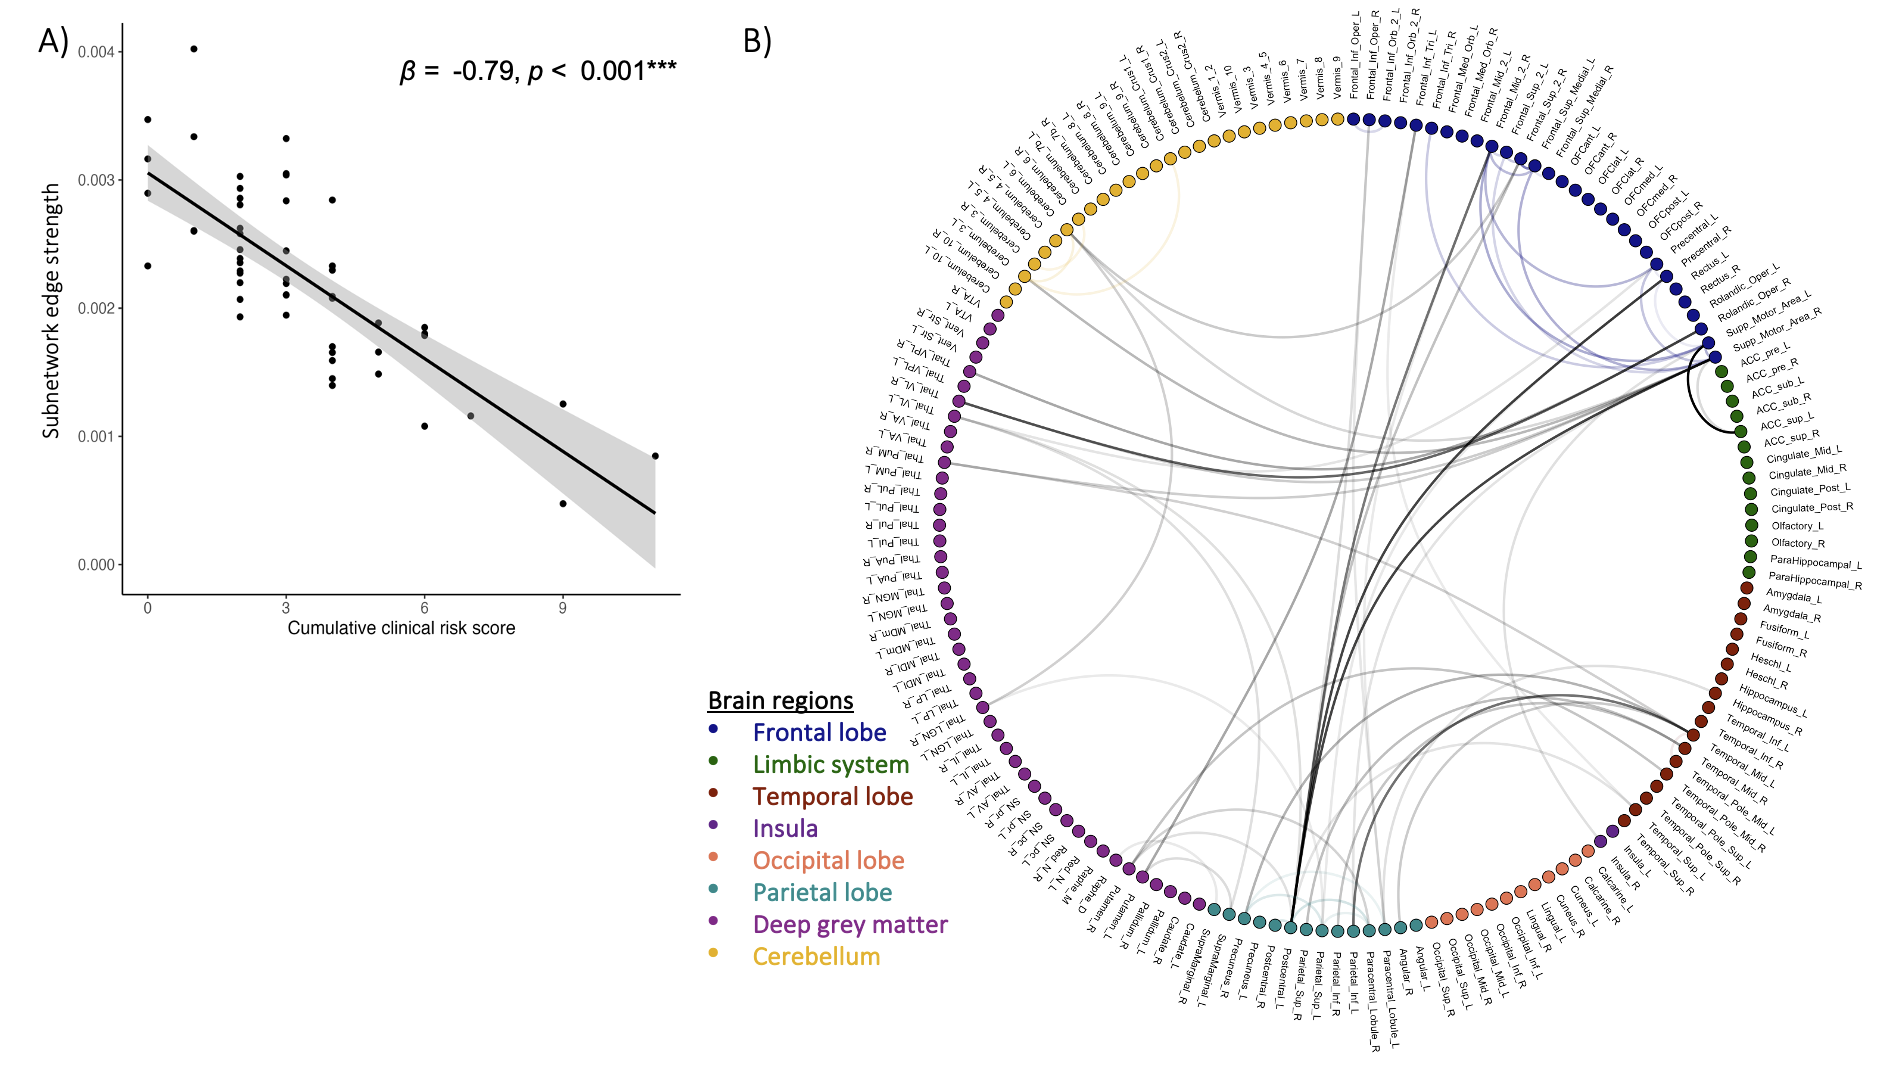
NBS-derived subnetwork where lower network connectivity strength is associated with more cumulative clinical risk
Note: Network contains 57 edges connecting 39 nodes. A) ß=standardized regression coefficient. p=p-value. *** p<0.001. Line=regression line. Dots=individuals. Grey area=standard error. B) Circular graph. _L=left hemisphere, _R=right hemisphere. Lines represent significant edges, the darker the stronger the effect. Colored edges are connecting nodes of the same brain region. Grey edges connect nodes of different brain regions.