2370
Motion Detection in Neonatal MR Fingerprinting: Enhancing Reliability in T1 and T2 values1Diagnostic Radiology, Yokohama City University, Yokohama, Japan, 2Radiology, Kanagawa Children's Medical Center, Yokohama, Japan, 3Siemens Healthcare K.K., Tokyo, Japan, 4Siemens Healthcare GmbH, Erlangen, Germany, 5Siemens Medical Solutions, New York, NY, United States
Synopsis
Keywords: MR Fingerprinting, MR Fingerprinting, Neonatal
Motivation: Motion artifact of MR Fingerprinting (MRF) cannot be recognized visually, but it affects quantitative values severely.
Goal(s): We aimed to assess the impact of motion in MRF and propose an objective motion-detection method.
Approach: We utilized Spatiotemporal Residuals (STR) from MRF-acquired signals and compared them with motion assessments in neonatal clinical practice.
Results: Our results revealed that motion significantly affects the accuracy of both T1 and T2 values. By applying an appropriate threshold to the standard deviation of STR, we achieved highly accurate motion detection equivalent to expert visual judgment, which leads to robust accuracy of quantitative values.
Impact: Our method to detect motion from MRF signals enables an objective assessment of the presence or absence of motion in MRF data. Consequently, this method facilitates the evaluation of the reliability of quantitative MRF images in clinical settings.
Introduction
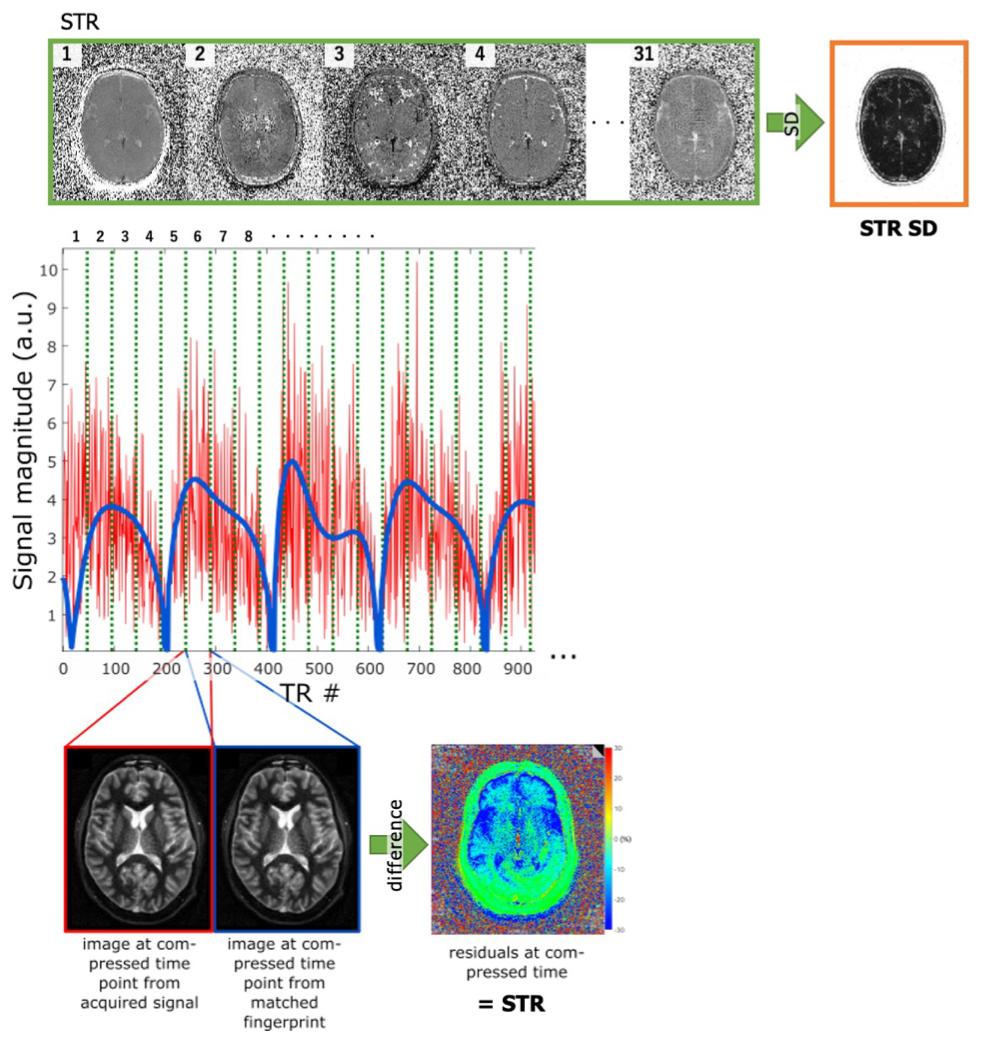
In neonates, quantitative MR, such as MR fingerprinting (MRF) is useful and promising for the assessment of pathological conditions presenting diffuse pathology, e.g., myelination abnormalities, hypoxic ischemic encephalopathy, and metabolic diseases. While 2D MRF is less susceptible to motion than conventional imaging, motion can still compromise values in the parametric maps without apparent visual cues1. Detecting motion in MRF images remains a challenging task2. Spatiotemporal Residuals (STR) is the difference between acquired signal evolution and the best matched signal evolution in the dictionary which are averaged in every 48 time points. STR has been proposed as a method to detect motion without external motion tracking devices or additional navigator signal acquisition3. An evaluation method employing STR SD, which shows the standard deviation across all STR images (Figure 1), has been suggested4. Our goal is to assess the relationship of motion artifacts and MRF quantification values and identify a quantitative measure, i.e., cut-off value of STR SD for detecting motion, by which reliability of MRF measurements can be judged clinically.Methods
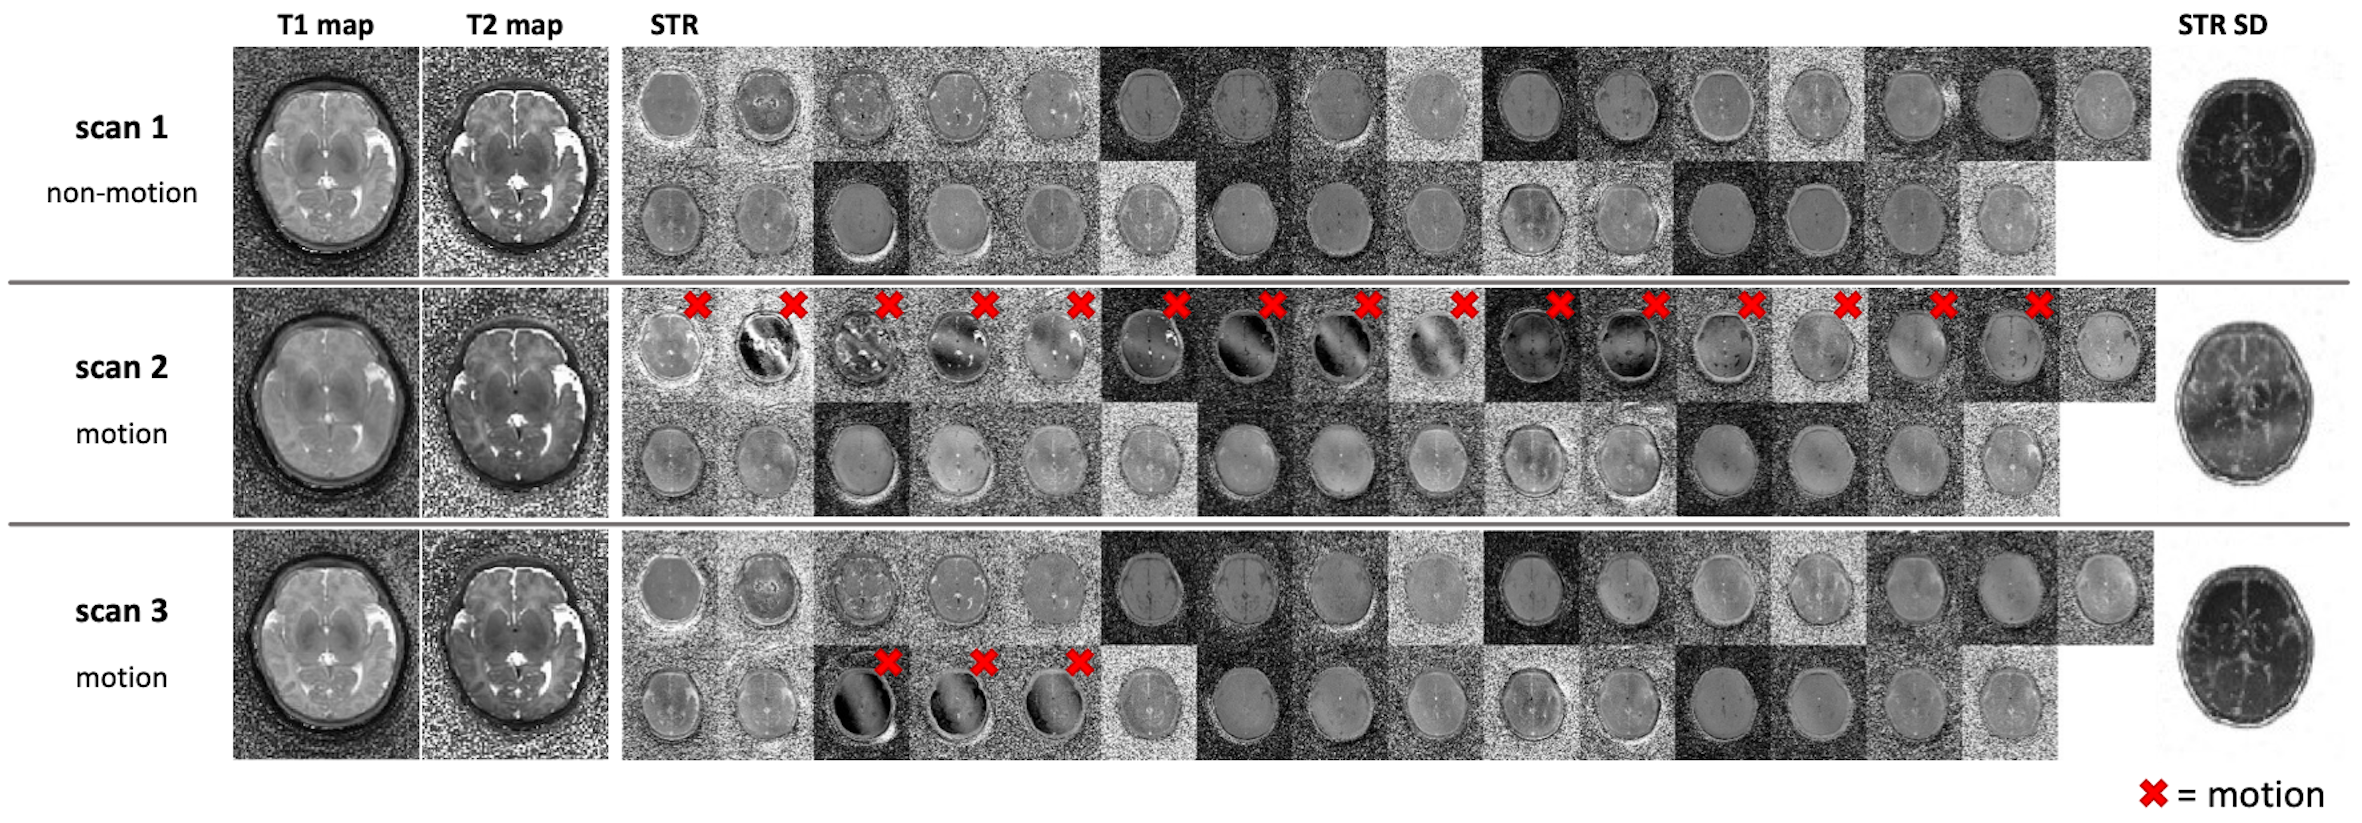
This study included 180 neonates in Kanagawa Children’s Medical Center (KCMC). All infants were recruited under the institutional review board approved in KCMC and had written consent obtained from their parents or guardians. 2D slice-selective (at level of Basal Ganglia) MRF (prototype sequence) was acquired for all infants on MAGNETOM Skyra Fit 3T (Siemens Healthcare, Erlangen, Germany), five scans at the same position were performed in each subject. MRF was acquired as an additional procedure following the routine examination. The routine examination was performed with intravenous sedation, and no further sedation was administered for MRF. 2D MRF data were acquired using FISP MRF sequence with a prescan-based B1+ correction and spiral sampling (FoV 256 mm, resolution 1 mm, slice thickness 5mm). STR SD was calculated from 31 STR images for each scan. For each individual scan, the presence or absence of motion was visually judged from the STR by the consensus of an experienced pediatric neuroradiologist and an experienced MRI developer (Method A) (Figure 2).We analyzed the relationship between motion and STR SD. T1, T2, and STR SD values were calculated as the mean intensity of the whole brain in the T1 map, T2 map, and STR SD, after applying intracranial masks. The subjects were assessed using Method A, with a criterion that required more than 2 out of 5 scans to be categorized as "non-motion" group. The mean of data in "non-motion" group was used as a reference to calculate the relative change in T1 and T2 values in individual subjects. We employed STR SD as the threshold to determine the presence or absence of motion (Method B). The threshold was established using receive operating characteristic (ROC) curves.
Results
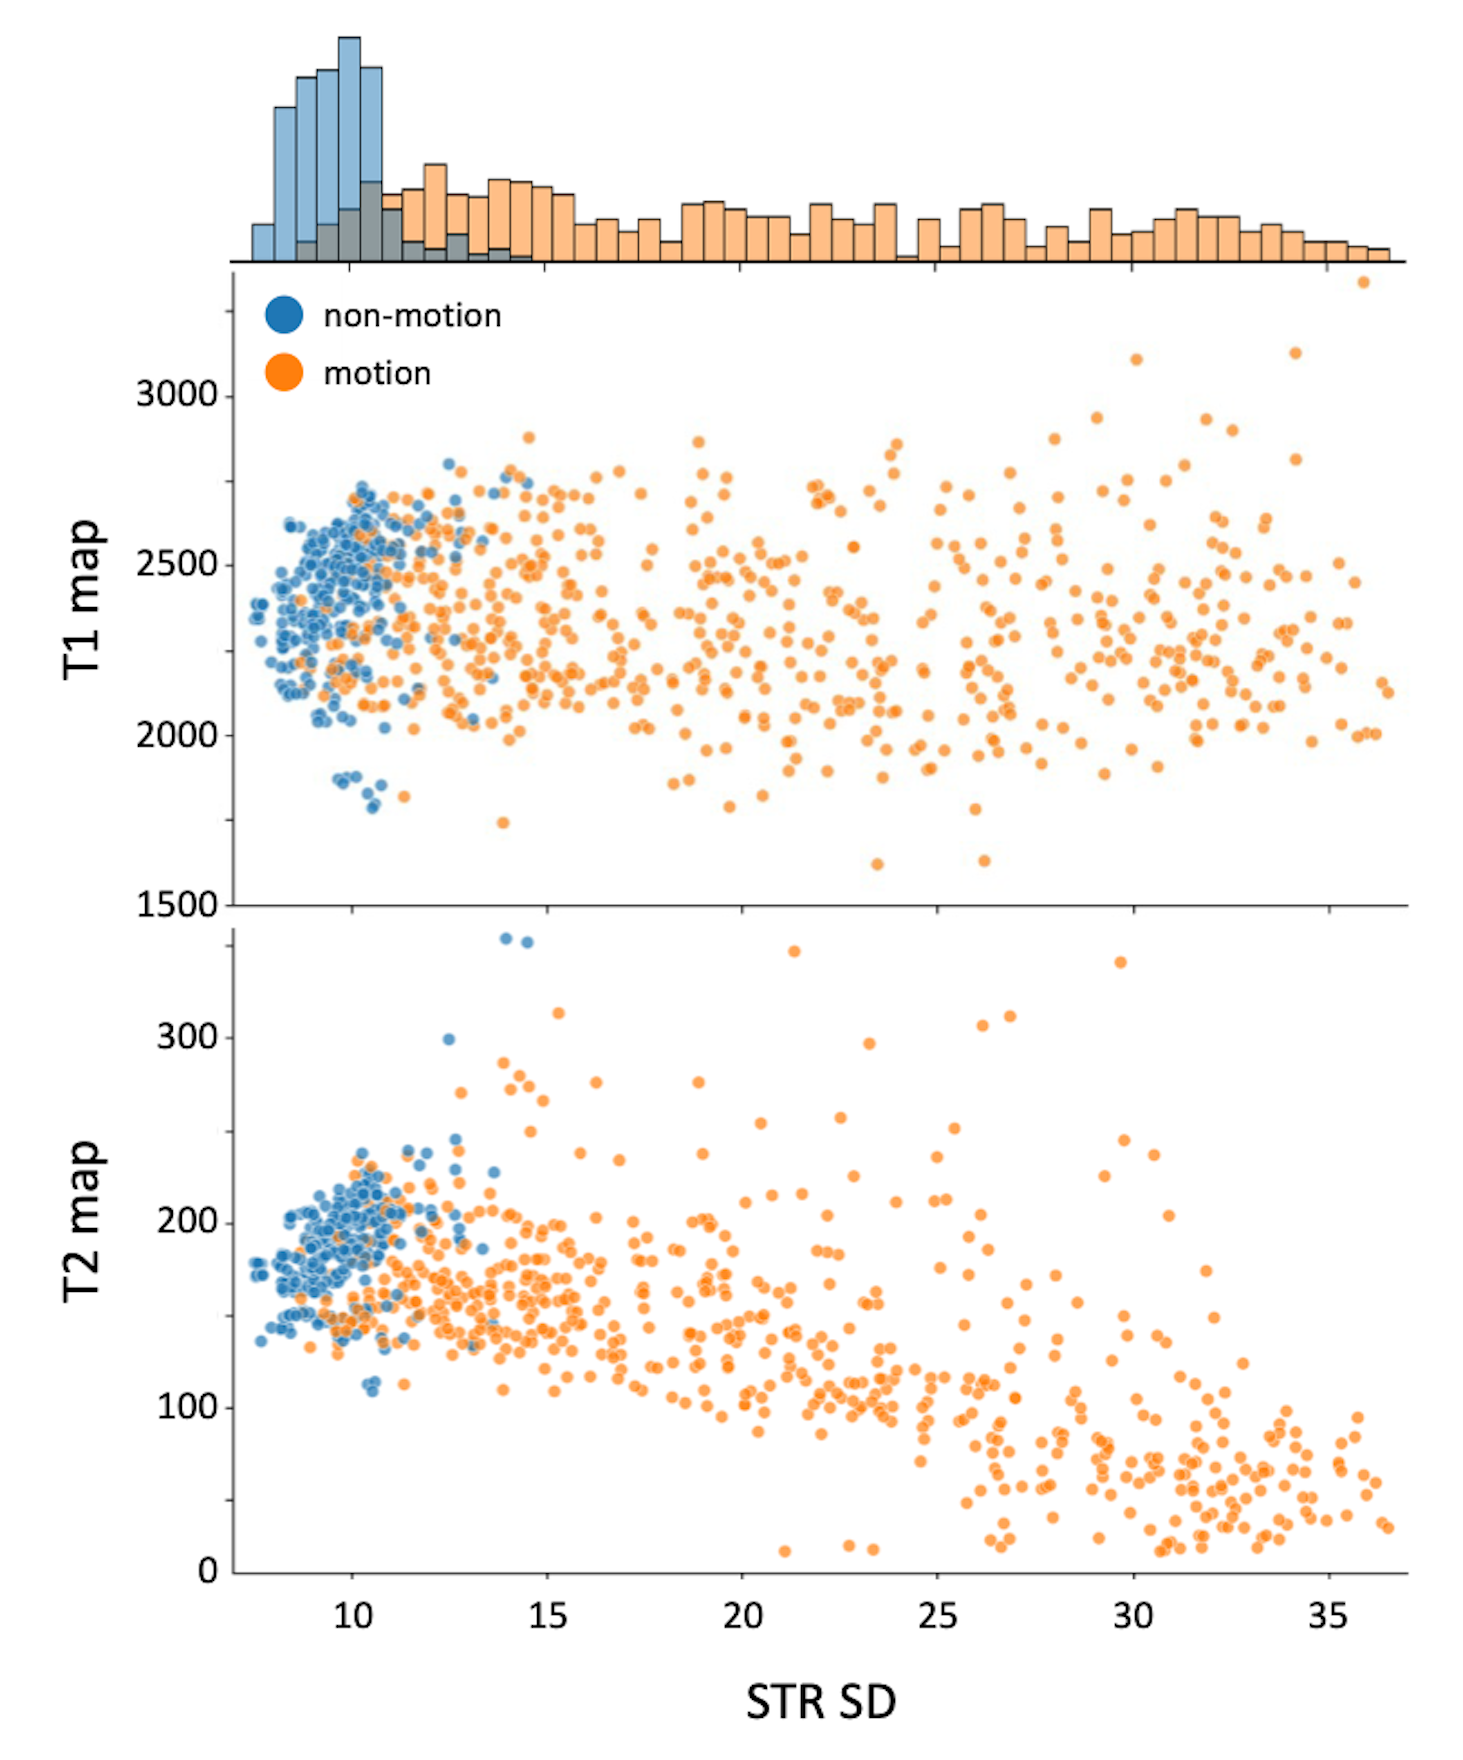
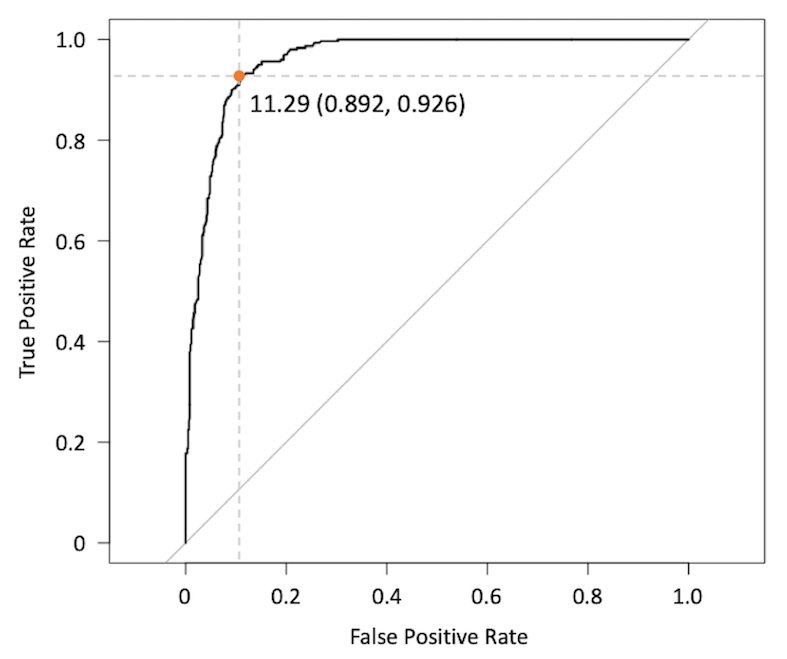
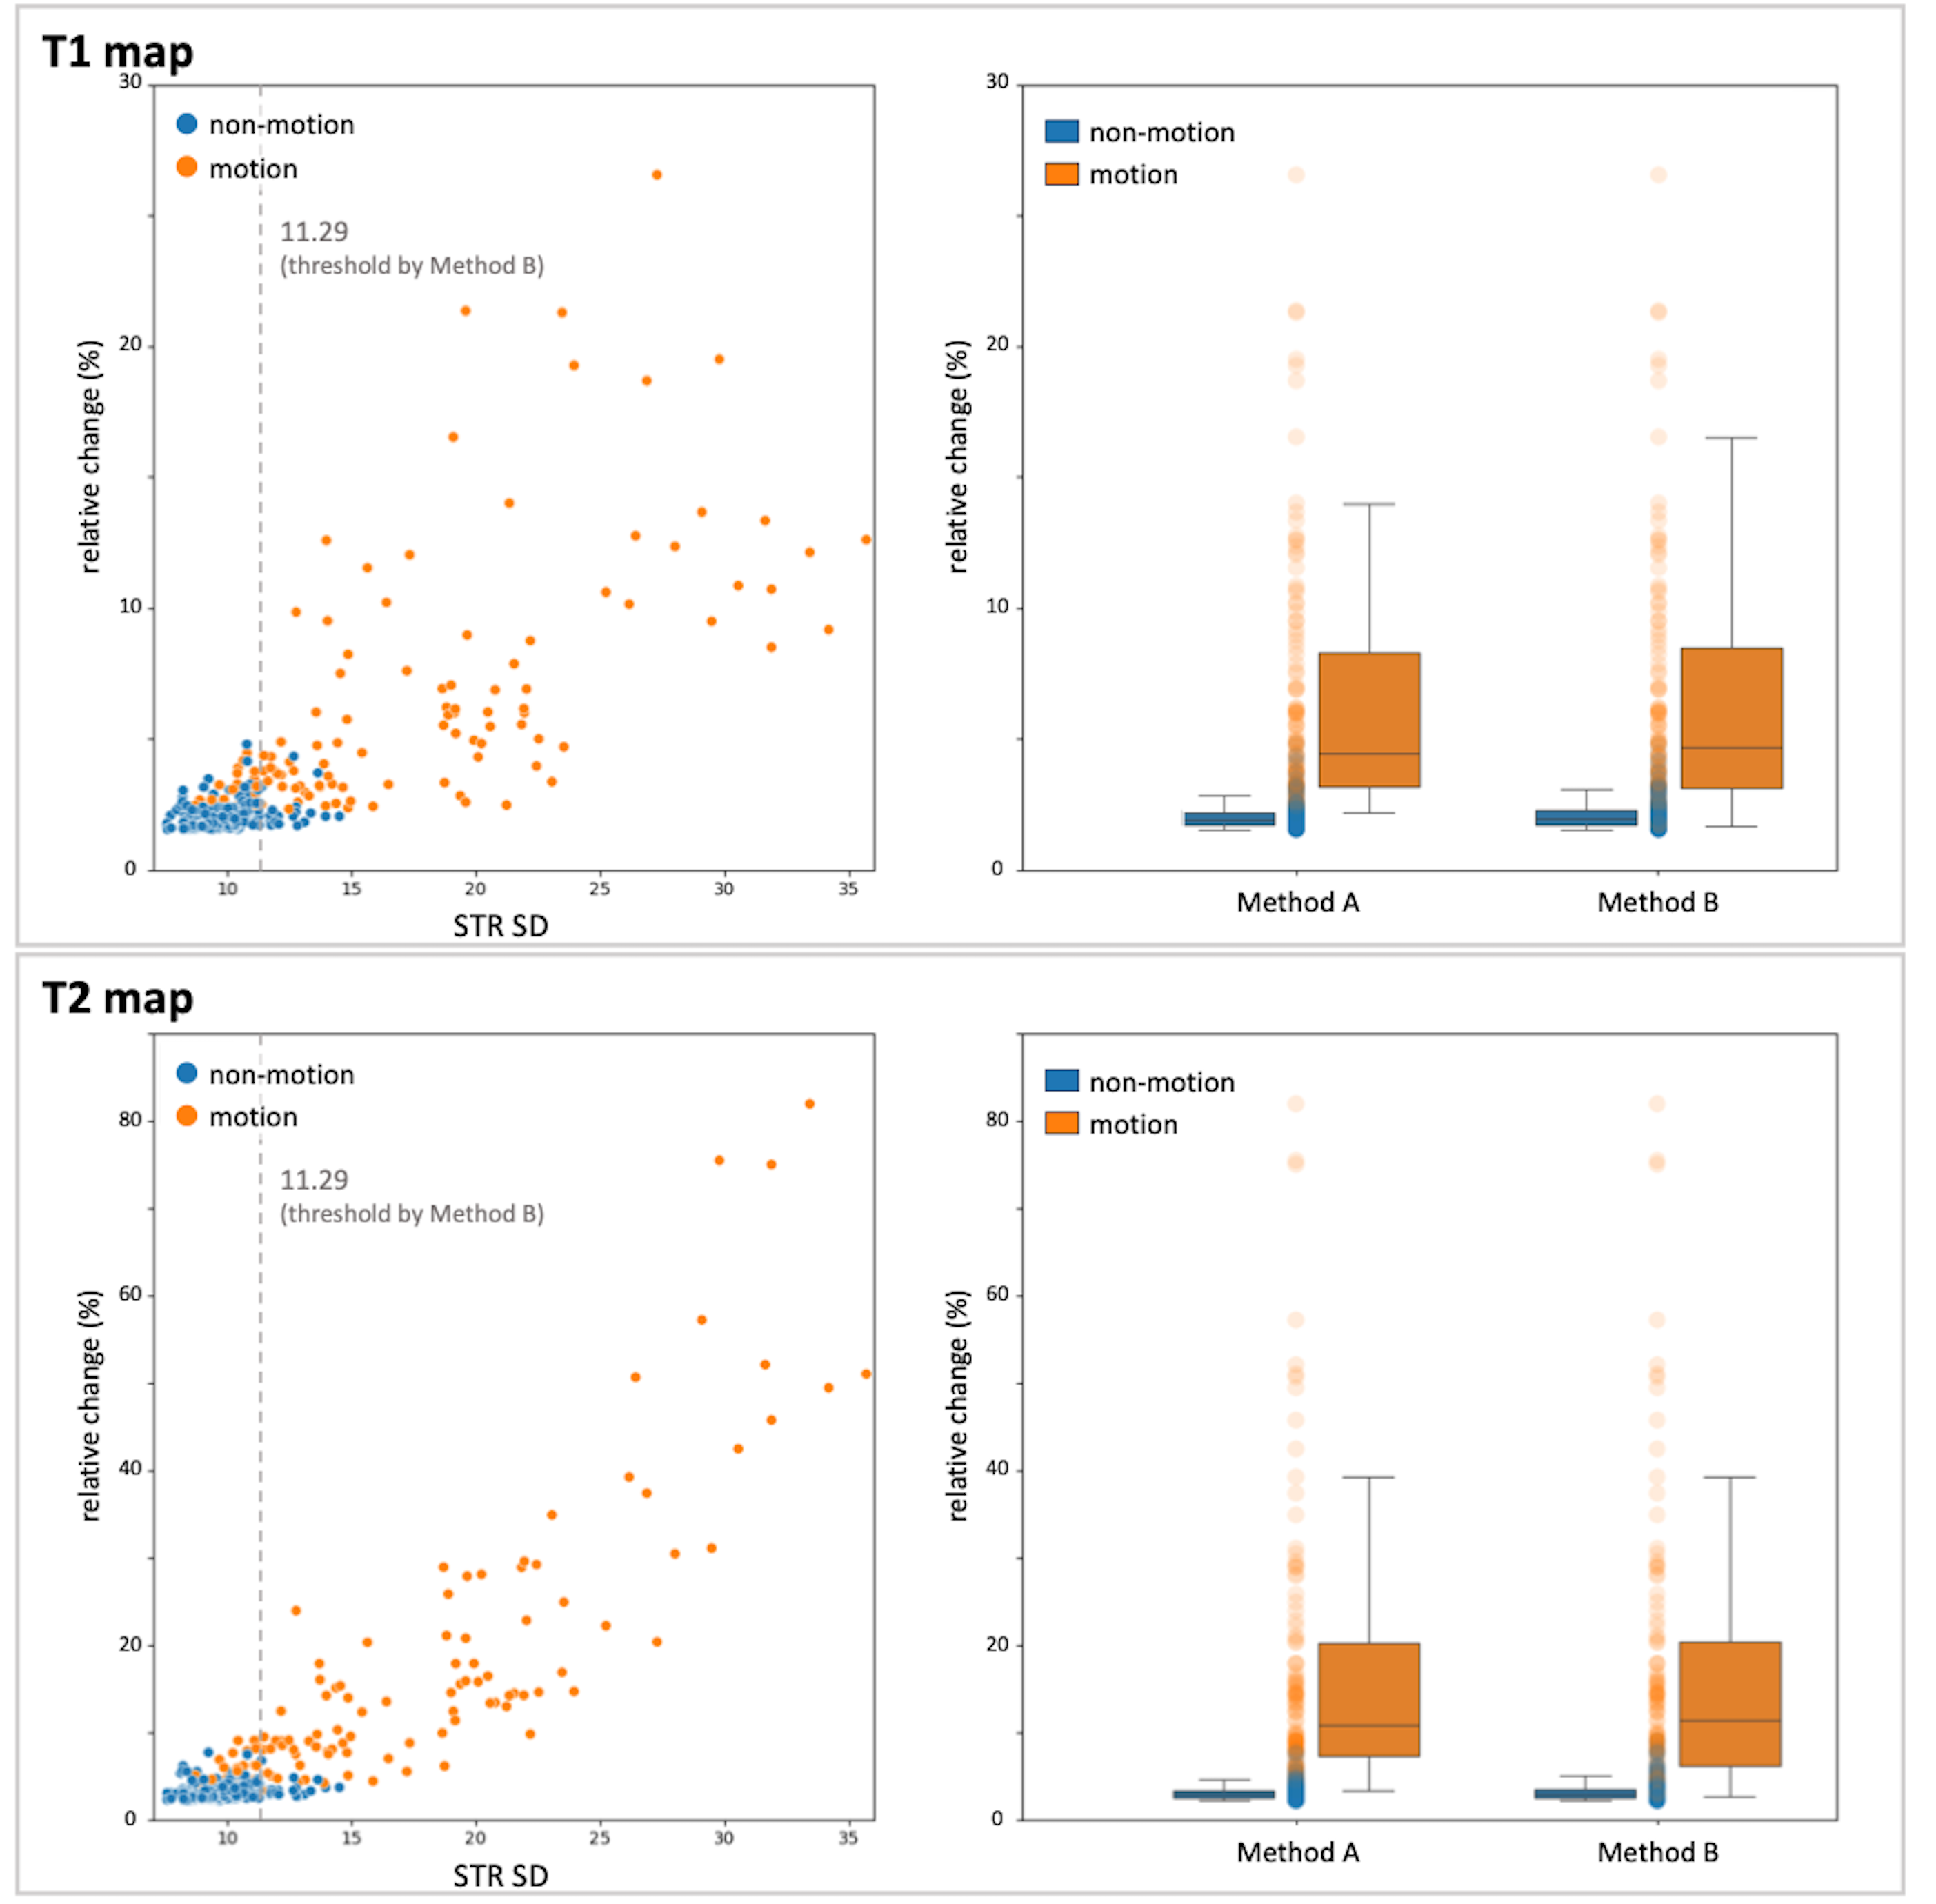
From 180 infants, 899 scans were acquired. Of these, 298 scans were categorized as "non-motion" and 601 scans as "motion" using Method A. The presence or absence of motion was shown to be associated with STR SD (Figure 3). The ROC analysis was used to detect predicting STR SD for motion. ROC curve revealed an area under the curve of 0.960. The threshold of STR SD (11.29) determined through ROC analysis demonstrated high accuracy in discerning the presence or absence of motion (Figure 4).The relative change in T1 and T2 values was calculated for 76 subjects 380 scans that were judged to be "non-motion" by Method A. In method A, within the "non-motion" group, the T1 and T2 maps exhibited minor variations of 2.01% ± 0.45% and 3.12% ± 0.84%, respectively (Figure 5). Conversely, in the "motion" group, the variations in T1 and T2 were higher at 6.42% ± 4.78% and 16.67% ± 15.54%, respectively. This suggests that motion can potentially compromise the reliability of T1 and T2 maps. The results obtained using Method B were consistent with those of method A. There was no statistically significant difference between the judgement results between the two methods.
Discussion
The accuracy of T1 and T2 values is significantly impacted by motion, thus detecting motion is crucial for predicting the precision of MRF. STR-based motion detection by the experts (Method A) was highly reliable, with small variation in T1 and T2 values in the “non-motion” group. Using appropriate threshold for STR SD (Method B), the same level of confidence as Method A can be obtained and is clinically applicable.Conclusion
Motion detection is a critical concern as it significantly impacts the reliability of T1 and T2 values. STR SD is useful for motion detection, and this method provides clinically reliable MRF measurements.Acknowledgements
No acknowledgement found.References
- Callaghan MF, Josephs O, Herbst M, et al. An evaluation of prospective motion correction (PMC) for high resolution quantitative MRI. Front Neurosci. 2015;9:97.
- Yu Z, Zhao T, Assländer J, et al. Exploring the sensitivity of magnetic resonance fingerprinting to motion. Magn Reson Imaging. 2018;54:241-248.
- Körzdörfer G, et al. Data-driven Motion Detection for MR Fingerprinting. #1013, Annual Meeting of the International Society for Magnetic Resonance in Medicine, 2020.
- Murata K, et al. An analysis technique using spatiotemporal residuals for motion detection in MR Fingerprinting. #O-037, Annual Meeting of the Japanese Society for Magnetic Resonance in Medicine, 2020.
Figures