2369
Synthetic MRI in Evaluating Neonatal Hyperbilirubinemia: a Feasibility Study1Nanjing Women and Children's Healthcare Hospital, Nanjing, China, 2GE Healthcare,MR Research China, Beijing, China
Synopsis
Keywords: Neuro, MR Value
Motivation: Brain injury induced by neonatal hyperbilirubinemia is an important cause of abnormal development of infant nervous system. The traditional use of serum total bilirubin as a diagnostic marker is inconsistent and imprecise.
Goal(s): This study aims to investigate the relationship between different levels of bilirubin and quantitative parameters of SyMRI with hyperbilirubinemia.
Approach: A total of 107 NHB and 22 healthy infants were recruited in the study. Obtain T1, T2, and PD values by scanning SyMRI sequences.
Results: There were significant difference in T1 values of globus pallidus and cerebral peduncle at different levels of TSB, and there were negative correlation.
Impact: The assessment of neonatal bilirubin encephalopathy with increased signals from the pallidus has a high degree of subjectivity. SyMRI can reflect biological information through quantitative parameters, providing objective basis for the early diagnosis of NHB.
Introduction
Neonatal hyperbilirubinemia (NHB) is caused by excessive production of bilirubin and insufficient ability of hemoglobin in the blood to decompose bilirubin. Approximately 60%-80% of newborns develop jaundice in the first week after birth[1]. Although most have a good prognosis, severe hyperbilirubinemia can develop into acute bilirubin encephalopathy, characterized by myasthenia or hypertonia, convulsions, fever, and apnea[2]. These will seriously affect the quality of life of children, and cause an inevitable psychological and economic burden to the family and society.Synthetic MR (syMRI) is an emerging and rapidly developing quantitative magnetic resonance technology, which can obtain a variety of contrast images and quantitative maps, thereby quantitatively measuring the relaxometry metric values (T1, T2 and proton density [PD] values)[3]. SyMRI was initially used in the central nervous system. Compared to traditional MRI, SyMRI can detect more plaques and provide multiple parameters for quantitative assessment of plaque damage in patients with multiple sclerosis[4]. Based on the current literature, the feasibility of generating T1, T2, and PD maps from SyMRI for quantitative analysis of neonatal NHB has not yet been reported.
Therefore, this study aimed to investigate the relationship between different levels of bilirubin in NHB and quantitative parameters of SyMRI in term infants.
Materials and Methods
SubjectsA total of 129 participants (aged 2-28 days), comprising 68 boys and 61 girls, were enrolled in this study. According to the peak level of total serum bilirubin (TSB), they were divided into two group: mild/moderate increase (group B, n=40), severe/extremely severe increase (group C, n=67). 22 healthy full-term infants were selected as the normal control group (group A).
MRI Imaging
A 3 Tesla MRI scanner (GE Medical Systems, Signa Architect) with a 19-channel head coil was used for all subjects. SyMRI adopts the multidynamic and multiecho (MDME) principle and uses alternating 120° saturated pulse degrees and multiecho collection (TR/TE1/TE2=4000/21.1/105.7ms, FOV=220×220mm, and scanning time of 4min 40s).
Data analysis
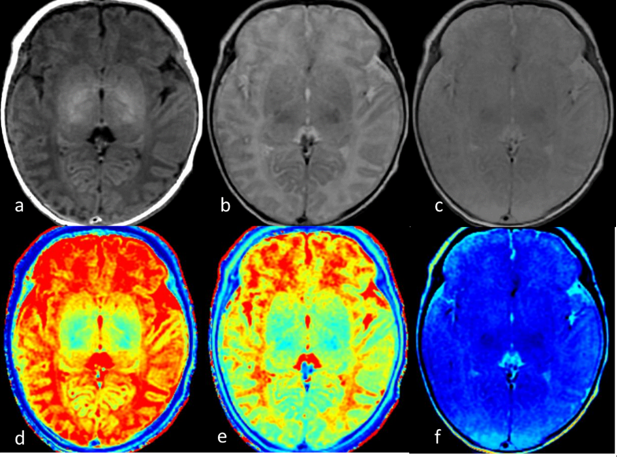
The SyMRI was postprocessed on a SyMRI 8.0 postprocessing workstation, and T1, T2 and PD maps were automatically generated(Figure 1). The final evaluation based on the average of the two radiologists was used for the final statistical analysis. The globus pallidus, cerebral peduncle were selected as the study sites. The position and size of the ROI of each participant should be as consistent as possible.
Statistical analysis
SPSS 23.0 statistic software was used. The interobserver consistency between the two readers was assessed by the intraclass correlation coefficient (ICC). One-way ANOVA was used to compare the quantitative parameters of different groups, and LSD test was used for further comparison. Using Pearson correlation analysis for variables with related trends. P<0.05 indicated statistical significance.
Results
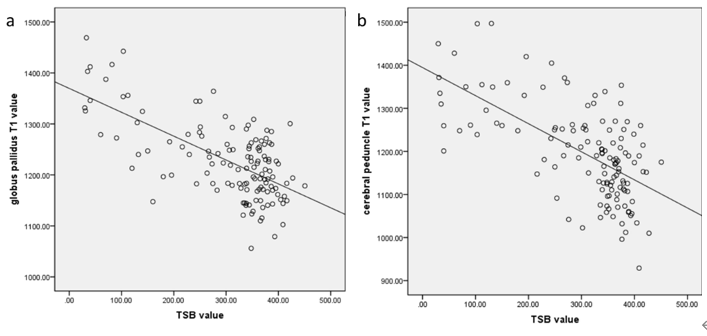
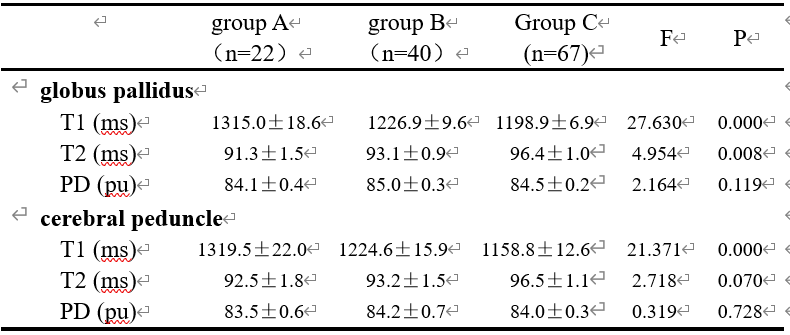
The T1 values of globus pallidus and cerebral peduncle were statistically different among the three groups (F=27.630, P<0.001) and (F=21.371, P<0.001). The T2 values of globus pallidus were statistically different between group A and group B, between group B and group C(P<0.05). However, The T2 values of cerebral peduncle were no statistically significant among the three groups (p>0.05). There were no significant differences in the PD values of globus pallidus and cerebral peduncle among the three groups (p>0.05) (Table 1). The T1 values of globus pallidus (r=-0.649, P<0.001) and cerebral peduncle (r=-0.625, P<0.001) were negatively correlated with TSB level(Figure 2).Discussion and Conclusions
In this study, The T1 values of globus pallidus and cerebral peduncle decreased with the increase of bilirubin. Indicating the damage of bilirubin to brain regions and the possibility of causing corresponding neurological changes.In conclusion, The quantitative values of SyMRI can be used for brain injury assessment of NHB.
Acknowledgements
No acknowledgement found.References
1. Rathore S, Kumar Vk C, R S. A critical review on neonatal hyperbilirubinemia-an Ayurvedic perspective. J Ayurveda Integr Med. 2020;11(2):190-196.
2. Kumar V, Kumar P, Sundaram V, et al. Childhood neurodevelopmental outcomes of survivors of acute bilirubin encephalopathy: A retrospective cohort study. Early Hum Dev. 2021 Jul;158:105380.
3. Hwang KP, Fujita S. Synthetic MR: physical principles, clinical implementation, and new development. Med Phys 2022,49(7): 4861-4874.
4. Hagiwara A, Hori M, Yokoyama K, et al. Utility of a Multiparametric Quantitative MRI Model That Assesses Myelin and Edema for Evaluating Plaques, Periplaque White Matter, and Normal-Appearing White Matter in Patients with Multiple Sclerosis: A Feasibility Study. AJNR Am J Neuroradiol. 2017,38(2):237-242.
Figures