2366
Spatiotemporal development of structure-function coupling during the perinatal period1College of Biomedical Engineering & Instrument Science, Zhejiang University, Hangzhou, China
Synopsis
Keywords: Neonatal, Brain Connectivity, structure-function coupling
Motivation: Structure-function coupling (SFC) has been proposed to decode the relationship between anatomical structure and neural activity, but how SFC develops in the perinatal period remains largely unknown.
Goal(s): To establish typical SFC map at birth and portray its development during the perinatal period.
Approach: SFC of neonatal brains from 26 to 45 postmenstrual weeks were characterized using the dHCP data, and compared to that of adults. The developmental trajectories were depicted by GLM.
Results: SFC at birth already demonstrated a sensorimotor-to-association pattern but were immature in somatomotor and frontoparietal networks compared to adults. SFC increased extensively and fastest in visual and limbic networks.
Impact: This study fills a gap in the SFC research during early development. Our findings characterized the brain connectome in term- and preterm-born neonates, revealing that visual regions developed earlier than somatomotor regions.
Introduction
The relation between anatomical structure and neural activity of human brain is a fundamental question in neuroscience. Structure-function coupling (SFC) has been proposed based on brain connectome to decode this relationship 1. SFC is calculated as the rank correlation between nodal structural connectivity (SC) and functional connectivity (FC), which reflects the covariance between fibre connection and neuronal co-activation of brain regions. The change of SFC during human brain development have been depicted in toddlerhood, childhood, and adolescence 1-3. However, in the perinatal period, a critical time for rapid maturation of white matter 4 and cortical functional activity 5, typical SFC configurations have not been characterized. Here, we utilized neonatal MRI data from the developing human connetome project (dHCP) to establish the spatial pattern of SFC at birth and portray the development trajectories of SFC during the perinatal period.Methods
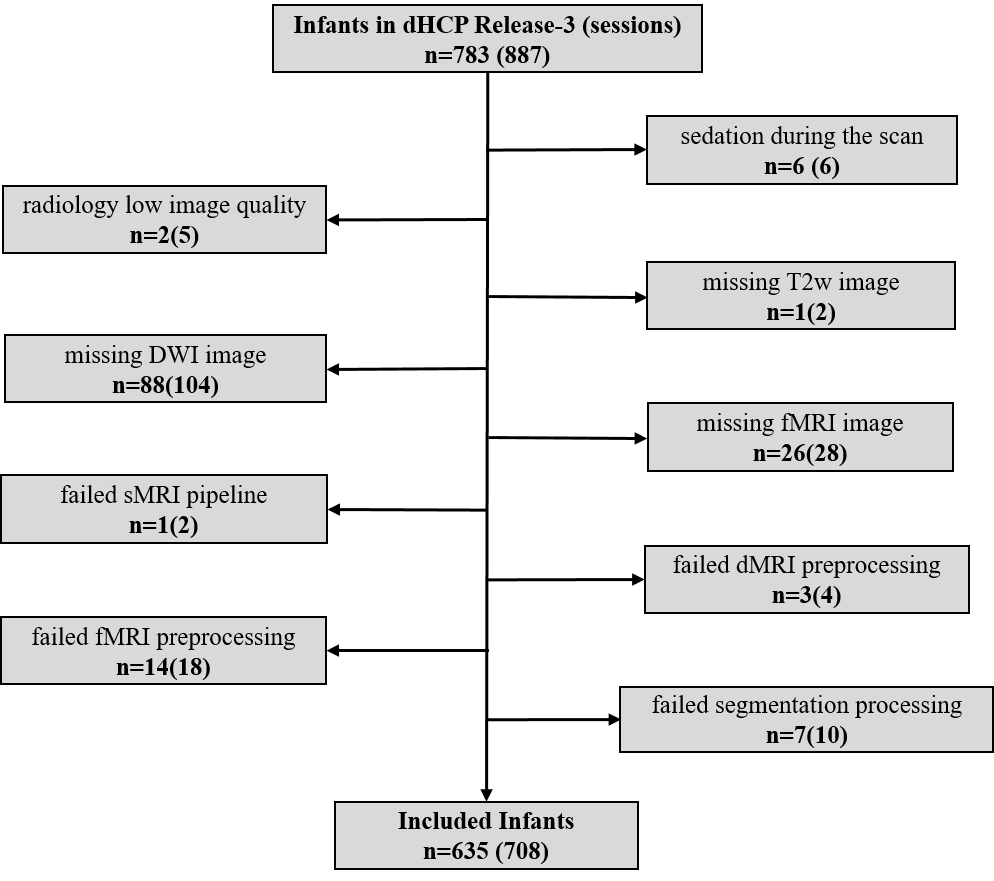
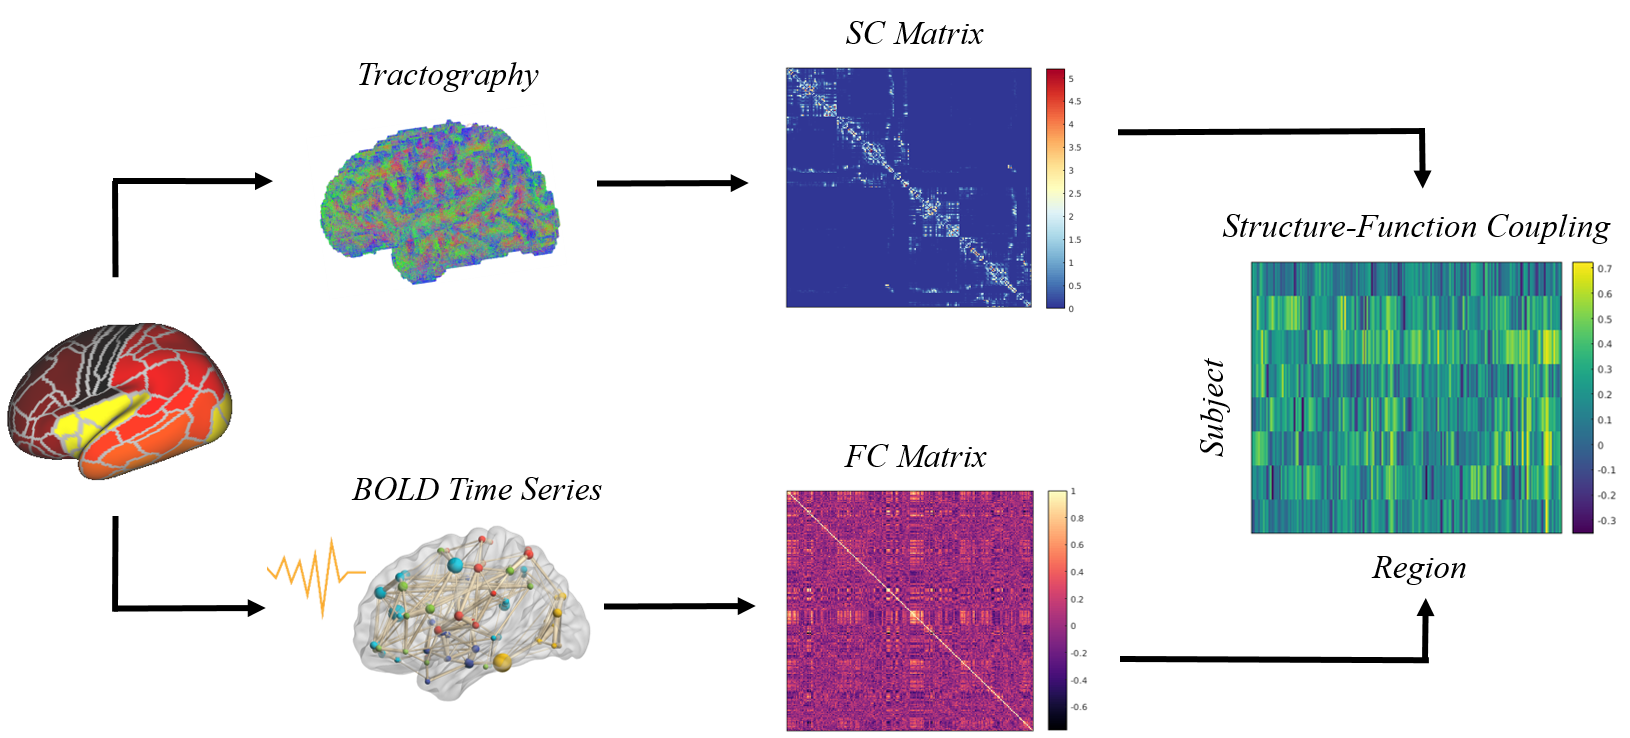
Exclusion criteria of this study were: 1) sedation during the scan; 2) radiology low image quality; 3) missing T2w, DTI or fMRI images; 4) failed preprocessing or segmentation pipelines. 708 sessions from 635 subjects were finally included (Fig. 1). The minimal preprocessed 6-8 results were further processed. Specifically, diffusion MRI data was rigidly realigned, denoised and removed gibbs artifacts, followed by a probabilistic tractography using iFOD2 algorithm 9 with 1000k streamlines in the whole brain. For fMRI data, a continuous subset with the lowest head motion was first selected 10, followed by rigid realignment, linear detrending and regression of nuisance covariates.The cortex was divided into 210 regions according to our previously proposed parcellation 11. SC was constructed by counting the number of streamlines between regions after scaled by volume. FC was constructed by calculating the Pearson correlation of time series between regions. Then, SFC was calculated by the Spearman correlation between the corresponding row of SC and FC matrix (excluding self-connection and any zero elements) (Fig. 2).
To address how SFC established at birth differ from those seen in adults, we included 98 participants from the Human Connectome Project Young Adult. PMA-effect was evaluated by general linear model (GLM) with the covariance of GA, sex, FD (frame-wise displacement), the interaction between PMA and FD.
Results
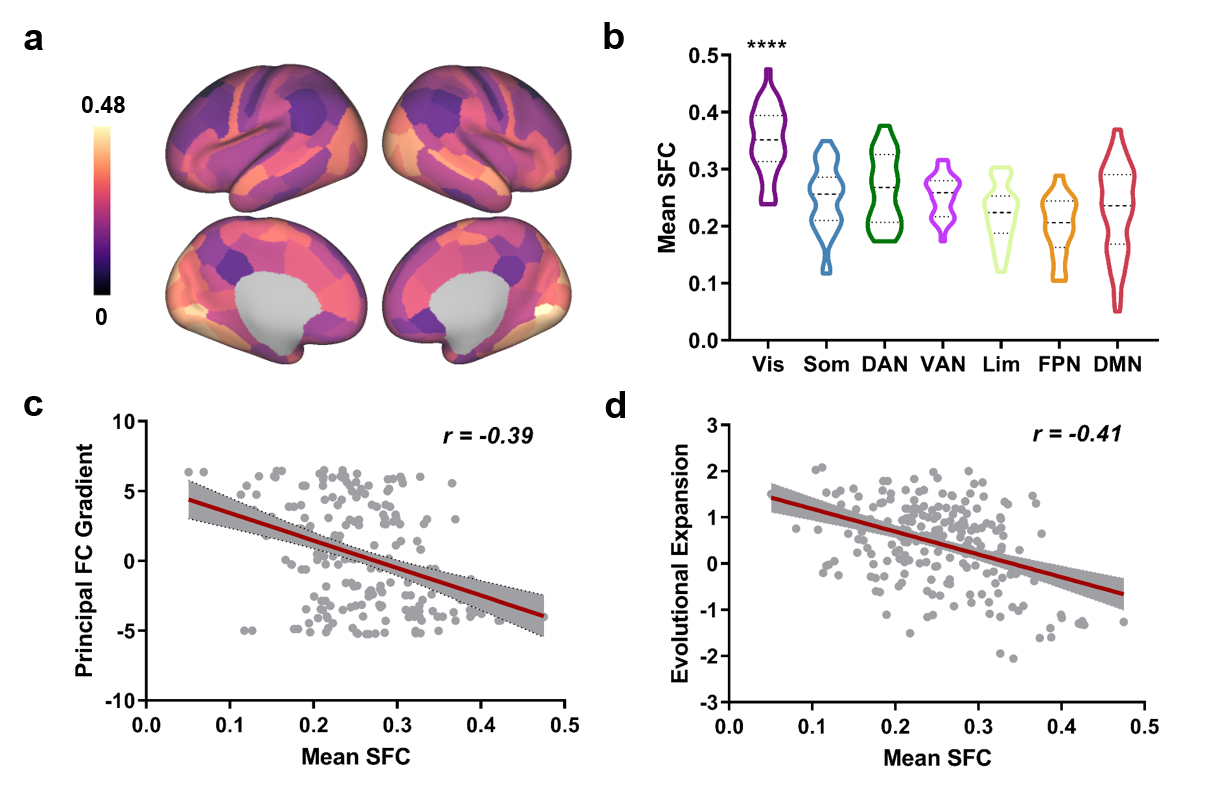
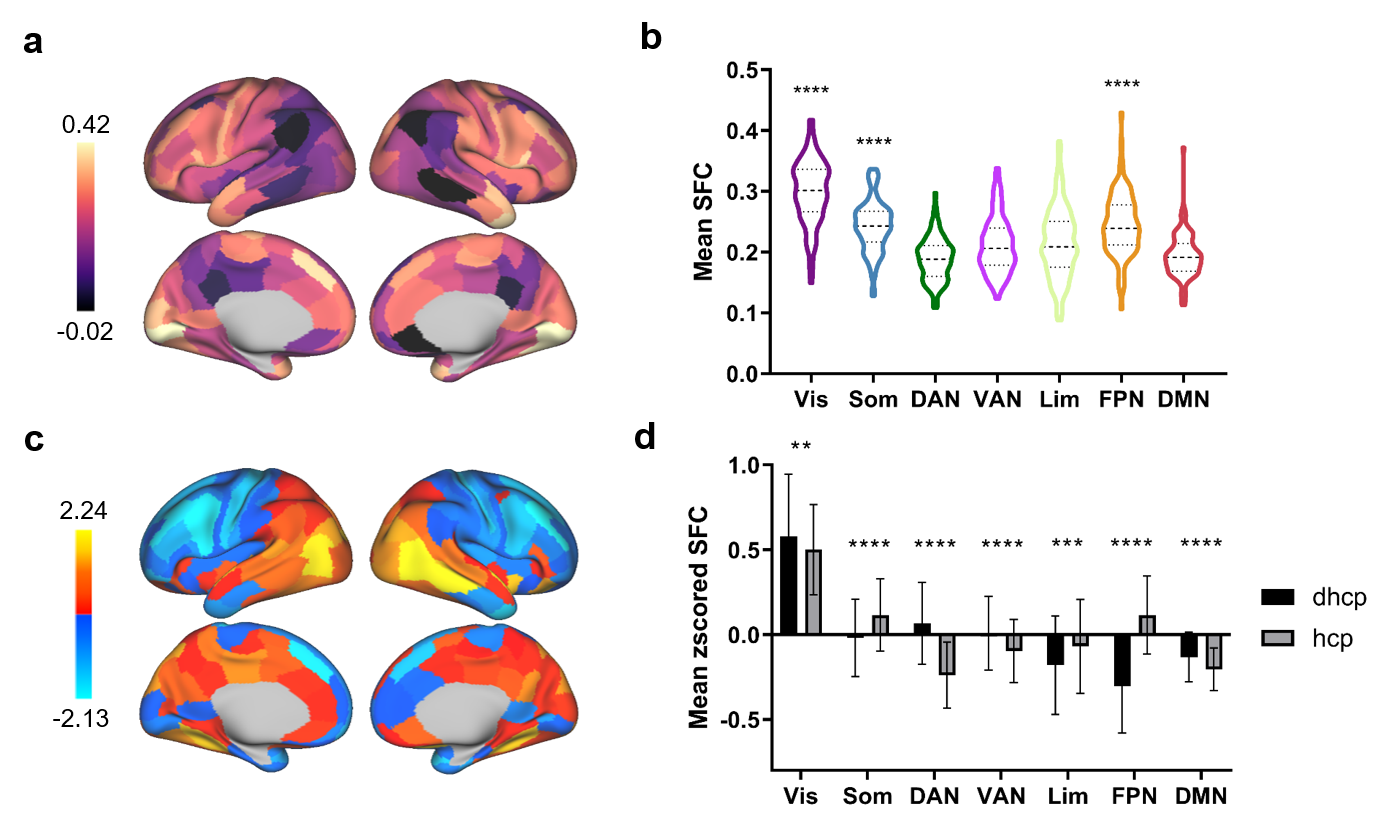
We first established a typical SFC map at birth by averaging SFC maps in the 453 term-born (39.90±1.27w) neonates scanned shortly after birth (41.14±1.71w), which showed positive across the brain (Fig. 3A). By assigning regions to functional networks 12, we found that the visual network had significantly higher SFC than other networks while the frontoparietal network had the lowest SFC (Fig. 3b). Further, SFC showed negative correlation with principal functional gradient which captured a continuous dimension from unimodal to transmodal cortex 13 (Fig. 3c), and negative correlation with surface expansion which reflected human cortical evolution 14 (Fig. 3d).We observed a prominent difference between SFC maps in neonatal and adult brains. The visual, somatomotor and frontoparietal network showed higher SFC than other networks in adult brains (Fig. 4a and b). The difference in mean z-scored SFC indicated neonatal SFC was relatively higher in the posterior area and lower in the anterior area than those of adults (Fig. 4c). The pairwise comparison suggested an enhanced SFC in the somatomotor and frontoparietal networks during complex development from birth through adulthood (Fig. 4d).
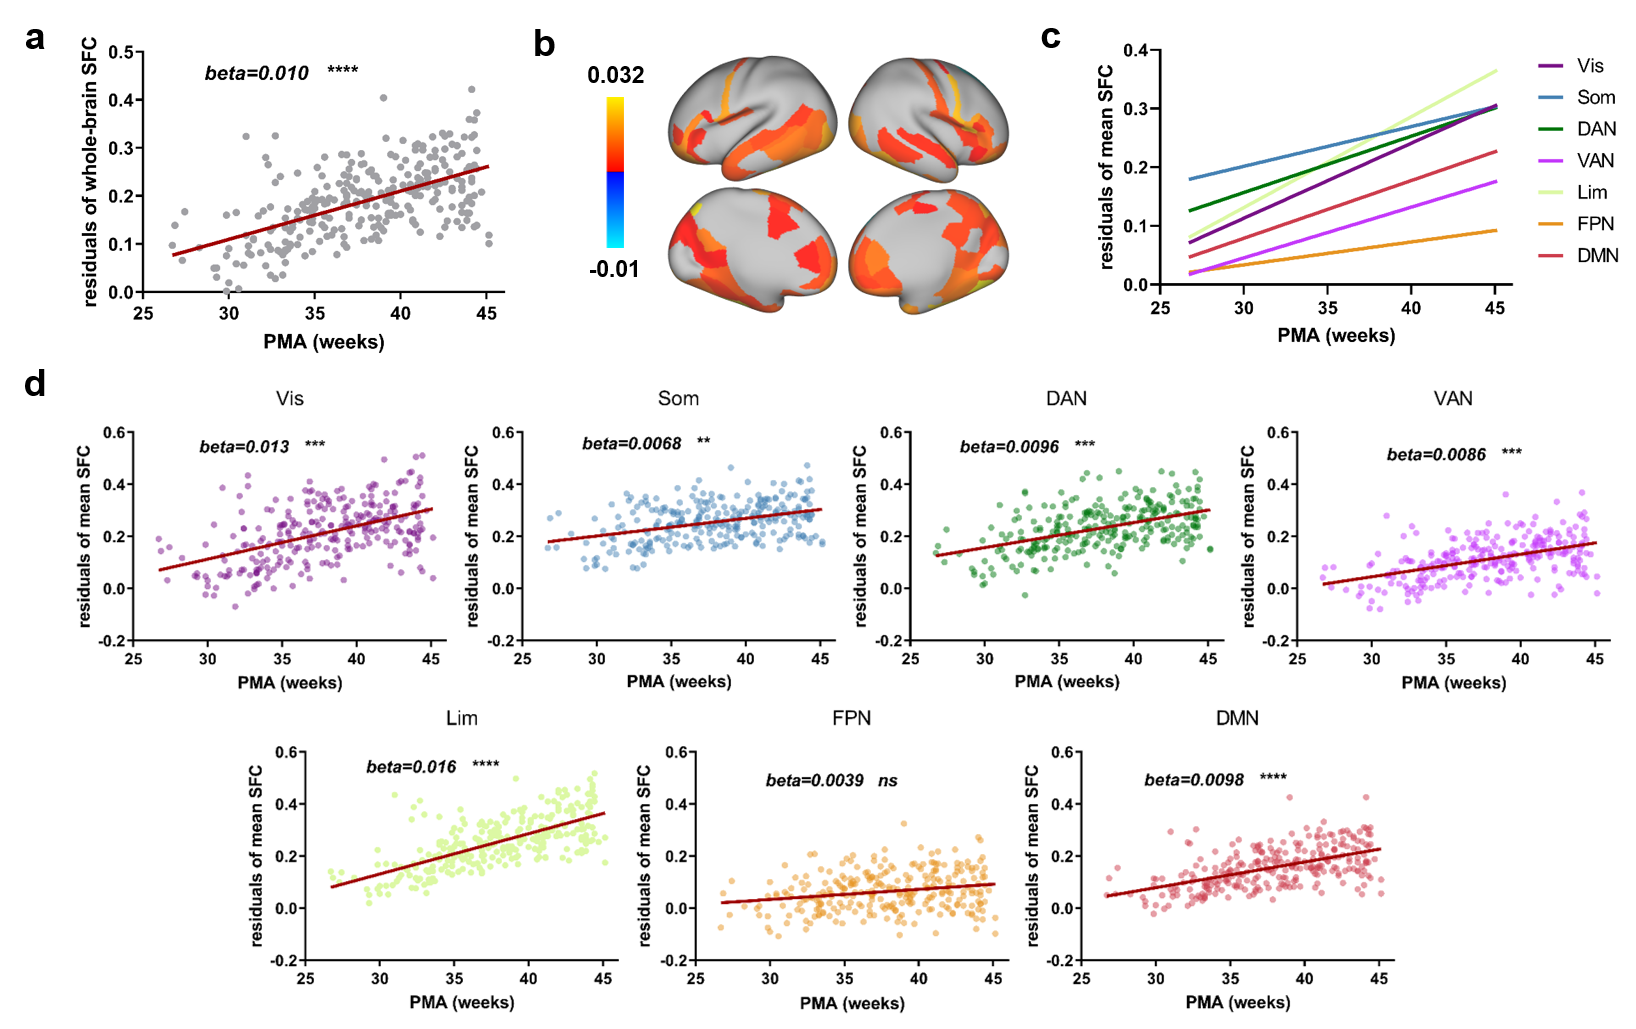
To track the SFC development during the perinatal period, we used 280 scans obtained from both term- and preterm-born neonates scanned at 26.71-45.14w. PMA-effect was tested using GLM at global, node and network level (Fig. 4). The results showed that mean SFC of the whole brain increased significantly (Fig. 5a). Regions with significant PMA-effect were located in the orbital and medial frontal cortex, precentral cortex, rolandic operculum, posterior temporal cortex, and medial occipital cortex (Fig. 5b). All networks except the frontoparietal network have significantly increased SFC, with most rapidly in the visual and limbic networks (Fig. 5c and d). Additionally, we examined preterm-effect using GLM with scan age, sex, FD as covariants by including term-born neonates and scans at term-equivalent age of preterm-born neonates. The result indicated no preterm effect in nearly all regions.
DISSCUSION
We found that the spatial pattern of SFC at birth aligned with known cortical hierarchies, consistent with the findings in adult and adolescent brain 1, 15, 16, reflecting the existence of the sensory-to-association axis 17 on SFC at birth. Nevertheless, compared with the adult brains, the somatomotor and high-order cortex (frontoparietal) appeared to be less developed 16, 18. The prominent changes in the somatomotor and frontoparietal network at the later developmental stage 2, may explained the difference between neonatal and adult brains.Acknowledgements
This work is supported by the National Natural Science Foundation of China (81971606, 82122032), and Science and Technology Department of Zhejiang Province (2022C03057, 202006140). Data were provided by the developing Human Connectome Project, KCL-Imperial-Oxford Consortium funded by the European Research Council under the European Union Seventh Framework Programme (FP/2007-2013) / ERC Grant Agreement no. 319456. We are grateful to the families who generously supported this trial.References
1 Baum G L, Cui Z, Roalf D R, et al. Development of structure–function coupling in human brain networks during youth. Proceedings of the National Academy of Sciences, 2020; 117(1):771-8.
2 Feng G, Wang Y, Huang W, et al. Spatial and temporal pattern of structure-function coupling of human brain connectome with development. bioRxiv, 2023:2023.09.11.557107.
3 Hong Y, Cornea E, Girault J B, et al. Structural and functional connectome relationships in early childhood. Developmental Cognitive Neuroscience, 2023:101314.
4 Ouyang M, Jeon T, Sotiras A, et al. Differential cortical microstructural maturation in the preterm human brain with diffusion kurtosis and tensor imaging. Proceedings of the National Academy of Sciences, 2019; 116(10):4681-8.
5 Cao M, He Y, Dai Z, et al. Early Development of Functional Network Segregation Revealed by Connectomic Analysis of the Preterm Human Brain. Cerebral Cortex, 2017; 27(3):1949-63.
6 Makropoulos A, Robinson E C, Schuh A, et al. The developing human connectome project: A minimal processing pipeline for neonatal cortical surface reconstruction. NeuroImage, 2018; 173:88-112.
7 Bastiani M, Andersson J L R, Cordero-Grande L, et al. Automated processing pipeline for neonatal diffusion MRI in the developing Human Connectome Project. NeuroImage, 2019; 185:750-63.
8 Fitzgibbon S P, Harrison S J, Jenkinson M, et al. The developing Human Connectome Project (dHCP) automated resting-state functional processing framework for newborn infants. NeuroImage, 2020; 223:117303.
9 Tournier J D, Calamante F, Connelly A. Improved probabilistic streamlines tractography by 2nd order integration over fibre orientation distributions; proceedings of the Proceedings of the international society for magnetic resonance in medicine, F, 2010 [C]. John Wiley & Sons, Inc, New Jersey.
10 Eyre M, Fitzgibbon S P, Ciarrusta J, et al. The Developing Human Connectome Project: typical and disrupted perinatal functional connectivity. Brain, 2021; 144(7):2199-213.
11 Li M, Xu X, Cao Z, et al. Multi-modal multi-resolution atlas of the human neonatal cerebral cortex based on microstructural similarity. NeuroImage, 2023; 272:120071.
12 Yeo B T T, Krienen F M, Sepulcre J, et al. The organization of the human cerebral cortex estimated by intrinsic functional connectivity. Journal of Neurophysiology, 2011; 106(3):1125-65.
13 Margulies D S, Ghosh S S, Goulas A, et al. Situating the default-mode network along a principal gradient of macroscale cortical organization. Proceedings of the National Academy of Sciences, 2016; 113(44):12574-9.
14 Hill J, Inder T, Neil J, et al. Similar patterns of cortical expansion during human development and evolution. Proceedings of the National Academy of Sciences, 2010; 107(29):13135-40.
15 Valk S L, Xu T, Paquola C, et al. Genetic and phylogenetic uncoupling of structure and function in human transmodal cortex. Nature Communications, 2022; 13(1):2341.
16 Fotiadis P, Cieslak M, He X, et al. Myelination and excitation-inhibition balance synergistically shape structure-function coupling across the human cortex. Nature Communications, 2023; 14(1):6115.
17 Sydnor V J, Larsen B, Bassett D S, et al. Neurodevelopment of the association cortices: Patterns, mechanisms, and implications for psychopathology. Neuron, 2021; 109(18):2820-46.
18 Gu Z, Jamison K W, Sabuncu M R, et al. Heritability and interindividual variability of regional structure-function coupling. Nature Communications, 2021; 12(1):4894.
Figures