2363
Assessing High-Risk Pregnancy Impact on Premature Infant Brain Development Using Synthetic MRI and Doppler Ultrasound1Radiology, the third affiliated hospital of zhengzhou university, zhengzhou, China
Synopsis
Keywords: Neonatal, Neonatal
Motivation: To explore high-risk pregnancy effects on premature infant brain development. Conditions like preeclampsia, gestational diabetes, and thyroid dysfunction can profoundly impact fetal brain development.
Goal(s): To evaluate the correlation between synthetic MRI and Doppler ultrasound in assessing brain development in high-risk pregnancies.
Approach: 54 infants from high-risk pregnancies and 50 from low-risk pregnancies were studied, analyzing various brain regions and blood flow parameters.
Results: Findings indicate moderate correlations between synthetic MRI and Doppler ultrasound data, providing a comprehensive assessment of premature infant brain development in high-risk pregnancies, with specific MRI and blood flow correlations.
Impact: This study's findings expand our understanding of high-risk pregnancy effects on infant brain development. They offer clinicians a valuable tool for early intervention, potentially improving outcomes for premature infants born to high-risk mothers.
Introduction
High-risk pregnancies, such as those complicated by preeclampsia, gestational diabetes, and maternal thyroid dysfunction, can significantly impact fetal brain development. This study aims to evaluate the influence of high-risk pregnancies on the brain development of premature infants by combining synthetic MRI and Doppler ultrasound blood flow spectra.Methods
We selected 54 premature infants born to mothers with high-risk pregnancies as the observation group, and 50 premature infants born to mothers without high-risk perinatal factors as the control group. Our methodology involved comparative analysis of T1 and T2 values for specific brain regions, including the corpus callosum, internal capsule, white matter in different lobes, and various nuclei. We also examined fetal umbilical artery (UA) and middle cerebral artery (MCA) blood flow spectral parameters, such as UA systolic/diastolic (UA-S/D) and UA pulsatility index (UA-PI), along with MCA systolic/diastolic (MCA-S/D) and MCA pulsatility index (MCA-PI). Correlation analysis was conducted with quantitative parameters.Results
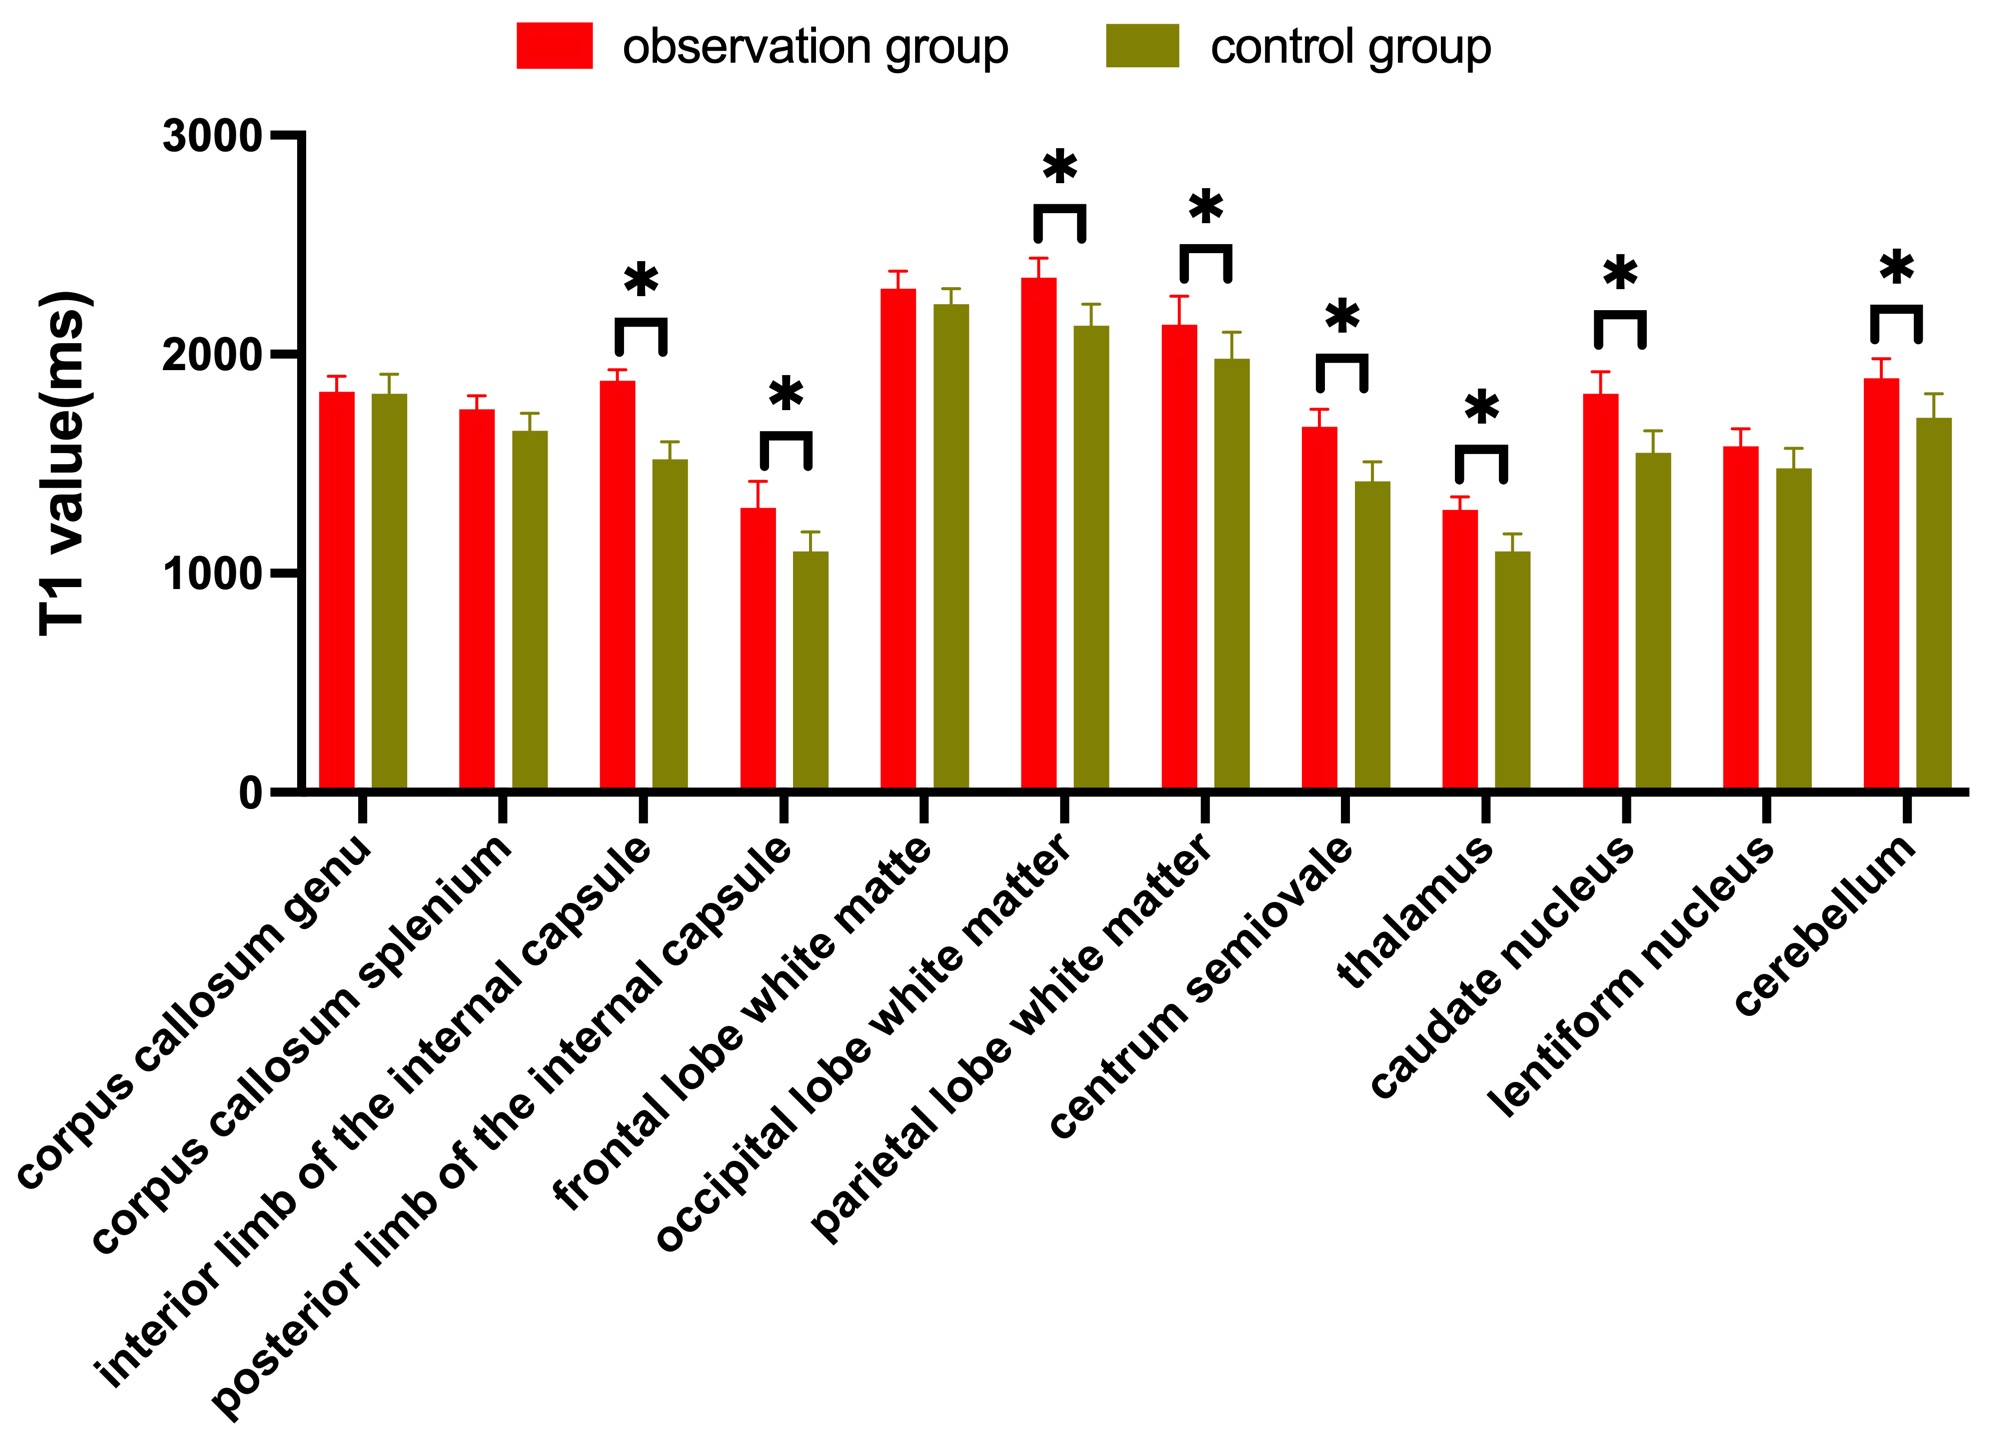
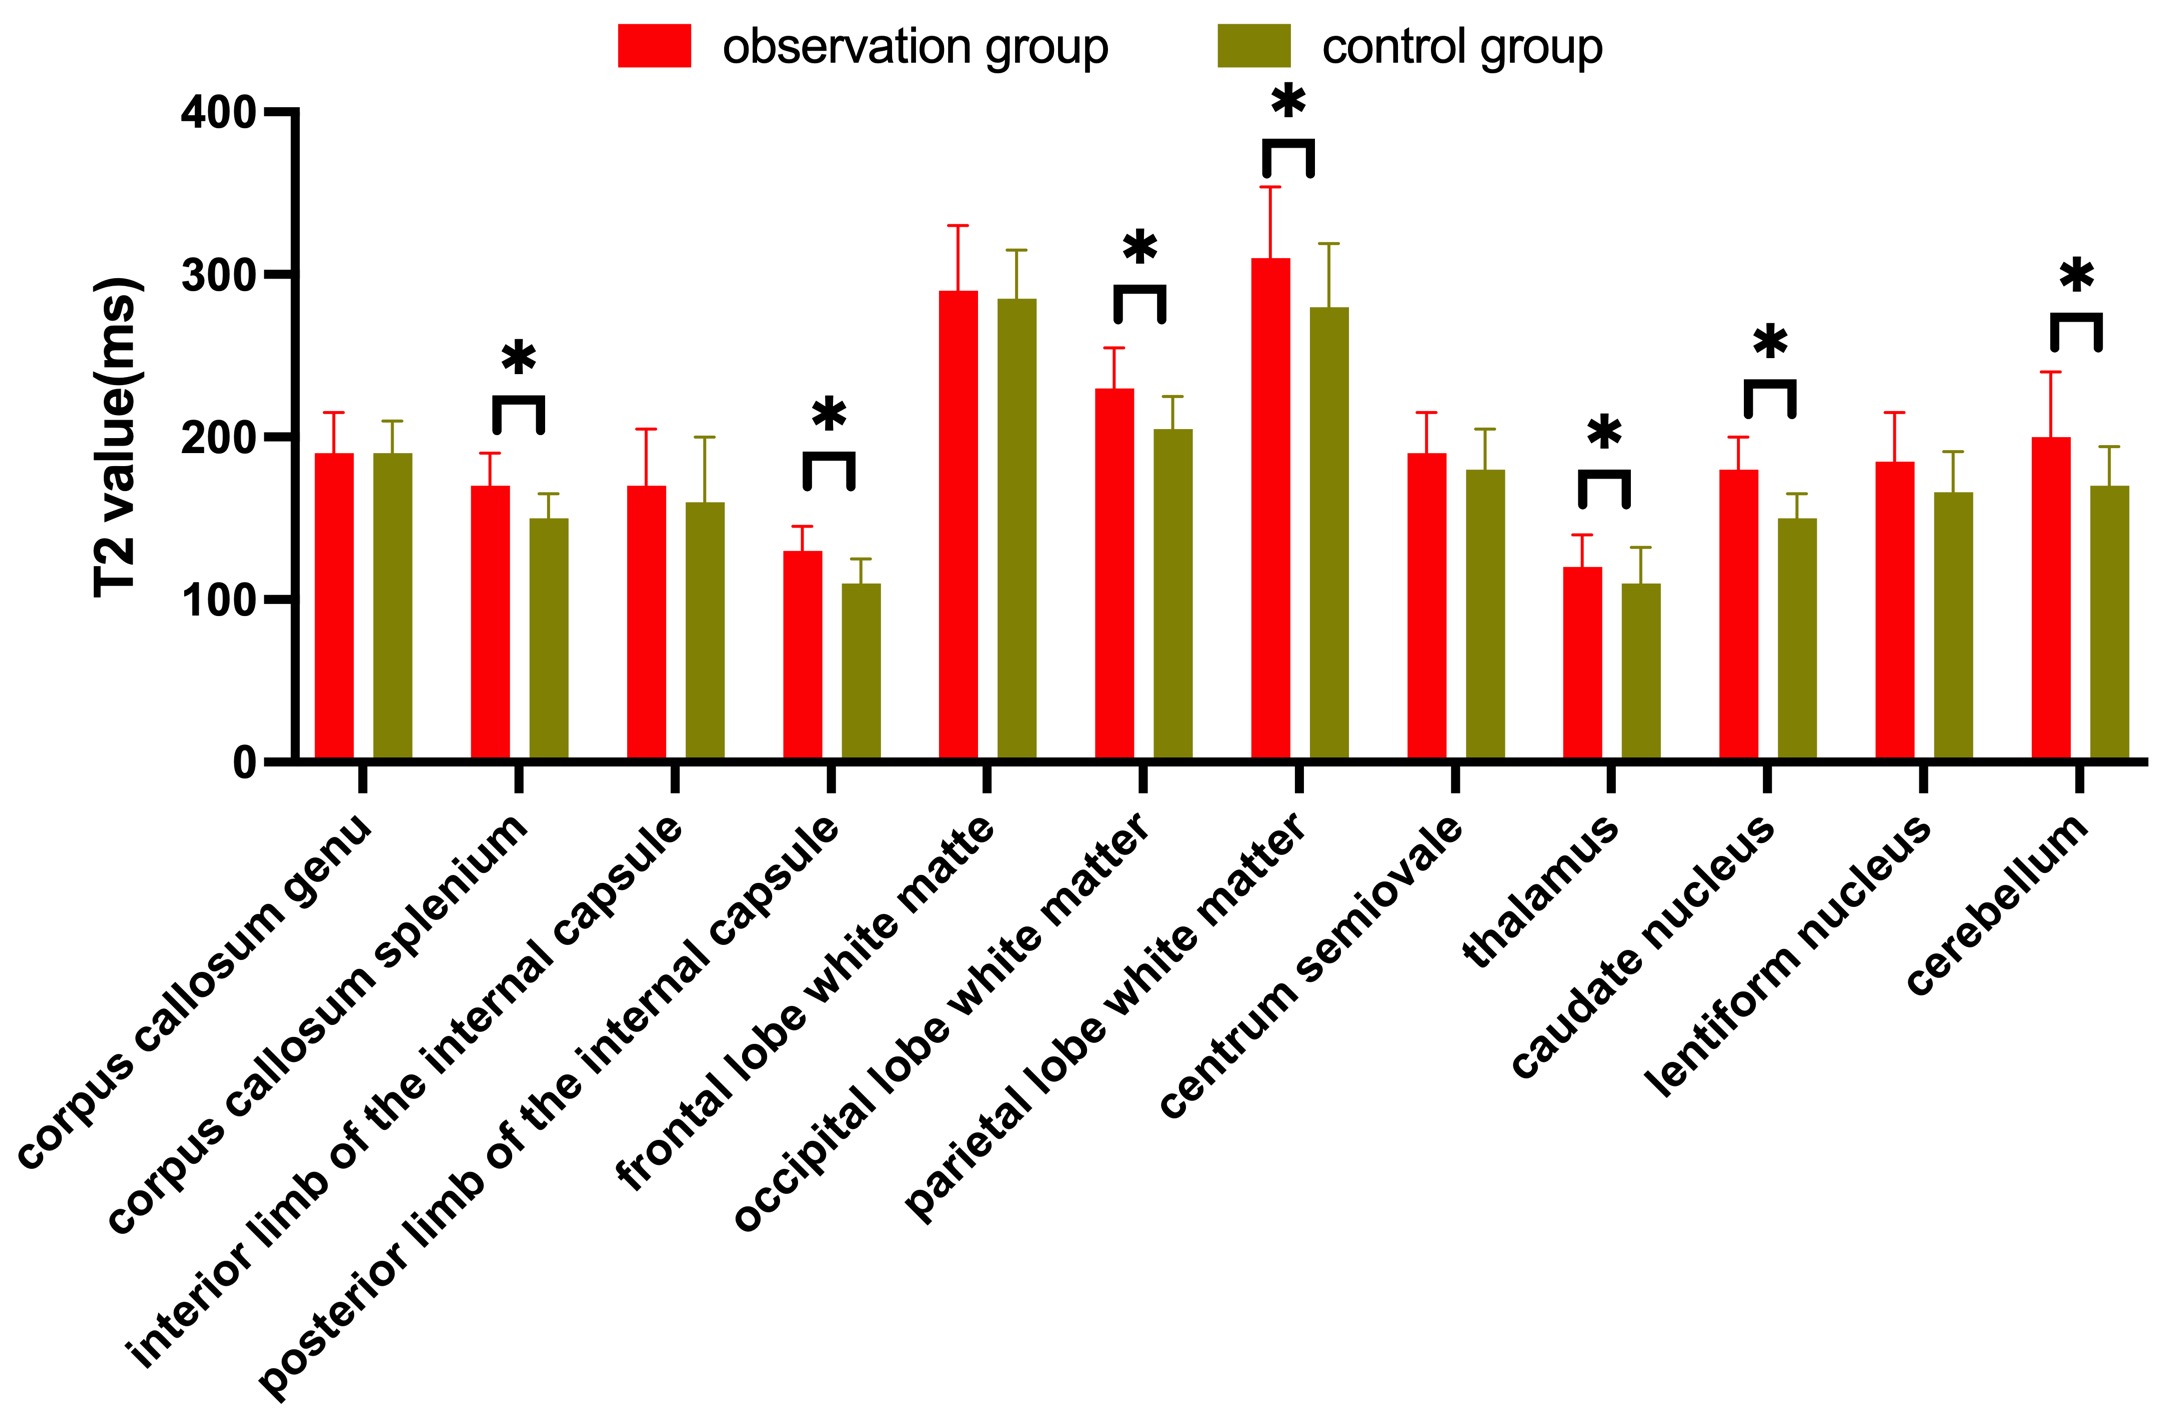
Within the observation group, T1 values were notably higher in specific brain regions, including the internal capsule, white matter in different lobes, thalamus, caudate nucleus, and cerebellum (all P<0.05). T2 values in the observation group were also higher in various regions, including the corpus callosum, internal capsule, white matter in different lobes, and specific nuclei (all P<0.05). The observation group displayed higher UA-S/D and UA-PI values but lower MCA-PI and MCA-S/D values compared to the control group (all P<0.05). Furthermore, T1 and T2 mean values showed a positive correlation with UA-S/D and MCA-S/D (all P<0.0001).Discussion
The findings from this study reveal significant differences in MRI parameters and blood flow measurements between the observation and control groups. These differences suggest a correlation between high-risk pregnancies and brain development in premature infants, which has clinical implications for neonatal care.Conclusion
This research demonstrates that synthetic MRI and fetal UA and MCA blood flow spectral parameters are moderately correlated and can be effectively combined to assess the brain development of premature infants born to mothers with high-risk pregnancies. This insight could lead to improved early interventions and outcomes for high-risk pregnancies in neonatal care.Acknowledgements
The authors are grateful to the infants and their mothers for their participating in our study, to the department of neonatology and radiology MRI team of the Third Affiliated Hospital of ZhengzhouUniversity for their assistance with our study.References
1. Chandra T, Chavhan GB, Sze RW, et al. Practical considerations for establishing and maintaining a magnetic resonance imaging safety program in a pediatric practice. Pediatr Radiol. 2019;49:458–468.
2. Kwon SH, Vasung L, Ment LR, et al. The role of neuroimaging in predicting neurodevelopmental outcomes of preterm neonates. Clin Perinatol. 2014;41:257–283.
3. Nie J, Li J, Cheng L, et al. Prenatal polycyclic aromatic hydrocarbons metabolites, cord blood telomere length, and neonatal neurobehavioral development. Environ Res. 2019;174:105–113.
4. Stoll BJ, Hansen NI, Bell EF, et al. Trends in care practices, morbidity, and mortality of extremely preterm neonates, 1993-2012. JAMA, 2015, 314(10): 1039-1051
5.Barton SK, Tolcos M, Miller SL, et al. Unraveling the links between the initiation of ventilation and brain injury in preterm infants. Front Pediatr, 2015, 3: 97.
6.Wagenaar N, Chau V, Groenendaal F, et al. Clinical risk factors for punctate white matter lesions on early magnetic resonance imaging in preterm newborns. J Pediatr, 2017, 182: 34-40.
7.Merhar SL, Gozdas E, Tkach JA, et al. Neonatal functional and structural connectivity are associated with cerebral palsy at two years of age. Am J Perinatol, 2020, 37(2): 137-145.
8.Duerden EG, Foong J, Chau V, et al. Tract-based spatial statistics in preterm-born neonates predicts cognitive and motor outcomes at 18 months. AJNR Am J Neuroradiol, 2015, 36(8): 1565-1571.
9.Liu J, Gao D, Chen Y, et al. Lead exposure at each stage of pregnancy and neurobehavioral development of neonates. Neurotoxicology. 2014;44:1–7.
10.Li Y, Xu X, Wu K, et al. Monitoring of lead load and its effect on neonatal behavioral neurological assessment scores in Guiyu, an electronic waste recycling town in China. J Environ Monit. 2008;10:1233–1238.
11.Wakana S, Jiang H, Nagae-Poetscher LM, et al. Fiber tract-based atlas of human white matter anatomy. Radiology. 2004;230:77–87.12.Maurya VK, Ravikumar R, Bhatia M, et al. Hypoxic-ischemic brain injury in an adult: magnetic resonance imaging findings. Med J Armed Forces India, 2016, 72(1): 75-77.
Figures