2362
Dose-Dependent Effects of Preterm Birth and Brain Injury on Superficial White Matter Microstructure and Development1Radiology, Shandong Provincial Hospital Affiliated to Shandong First Medical University, Jinan, China
Synopsis
Keywords: Neonatal, White Matter
Motivation: As the last myelinated structure, SWM is most affected by prematurity. Early exposure to the environment might injure the organization of SWM and lead to psychiatric disorders later in life.
Goal(s): To detect the impact of both preterm birth and “abnormal” brain injury on SWM microstructure.
Approach: TBSS method was used to track SWM in preterm infants of different degrees. The study aimed to detect changes in diffusion indices over time and identify distinct manifestations within the brain injury group.
Results: We were surprised to find that different degrees of preterm birth have different effects on the microstructure of superficial white matter.
Impact: The dose-dependent effect of preterm birth on SWM microstructure/developmental pattern. Further study the dynamic developmental association between SWM structure and neurodevelopmental outcomes in elderly children to gain a deeper understanding of the role of SWM in brain functional development.
Introduction
Superficial white matter(SWM) plays an important role in brain function as early as newborn and is vulnerable to preterm. Understanding the injury of preterm SWM may benefit to better understand abnormalities of preterm brain.Materials and Methods
In this reterospective study, diffusion MR scans in preterm at term-equivalent time from the Developing Human Connectome Project(dHCP) were used for defining SWM regions and the skeleton of SWM was extracted for further analyses. Diffusion indices differences between full term neonates and moderately-late preterm or very preterm infants and diffusion indices changes with age were detected by both voxel-wise level and lobe level. In addition, the diffusion indices differences were detected between radiological score 1-3 and radiological score 4-5 group.Results
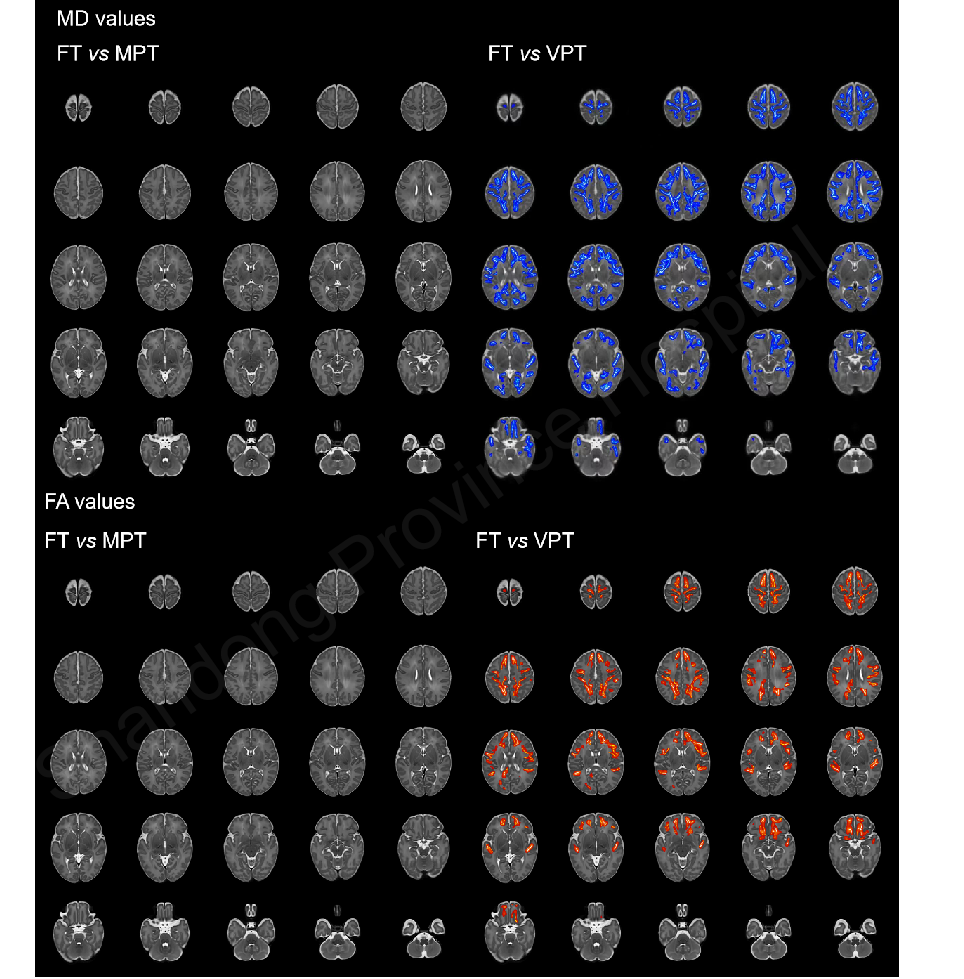
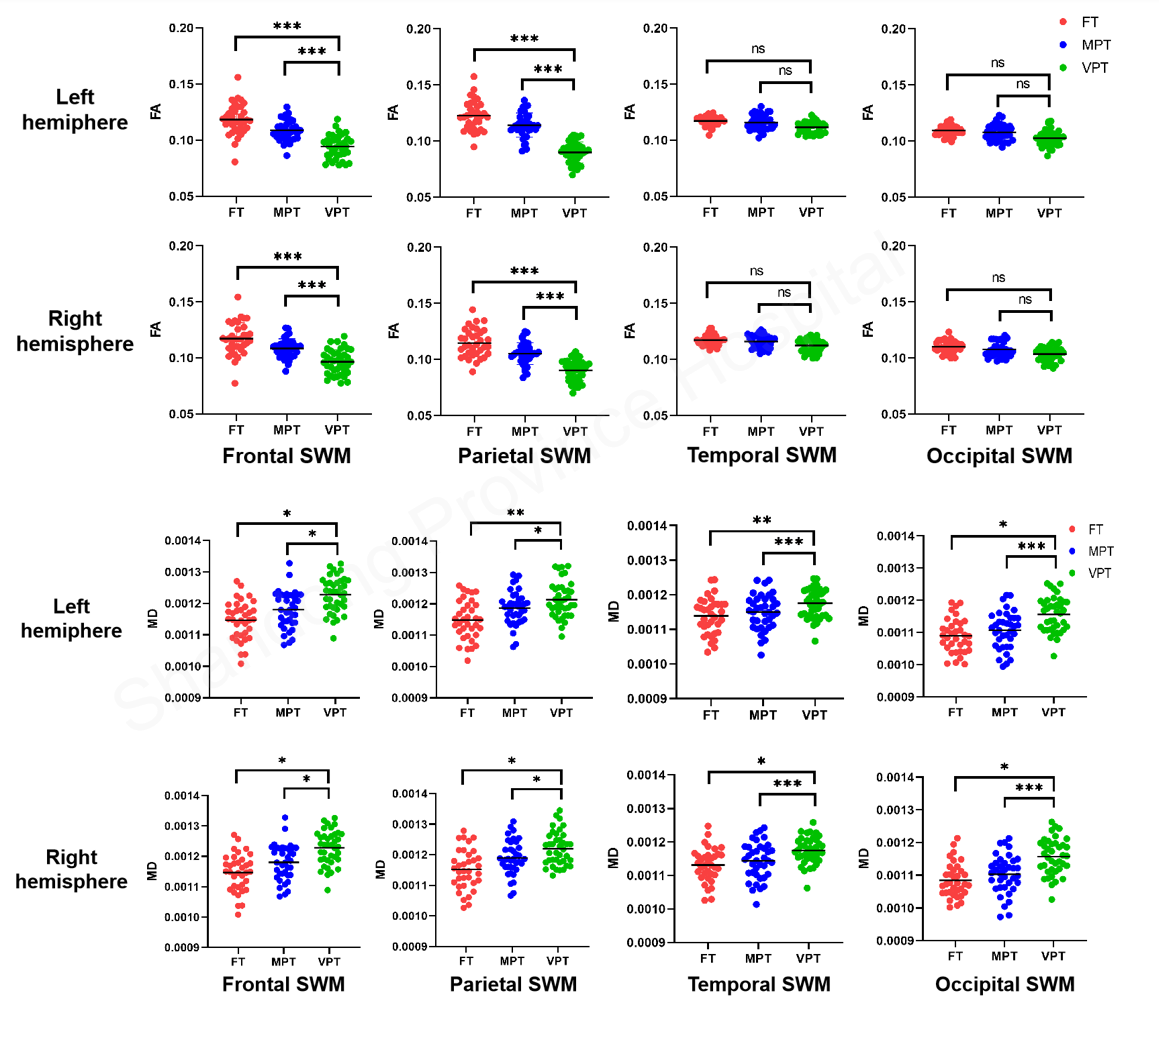
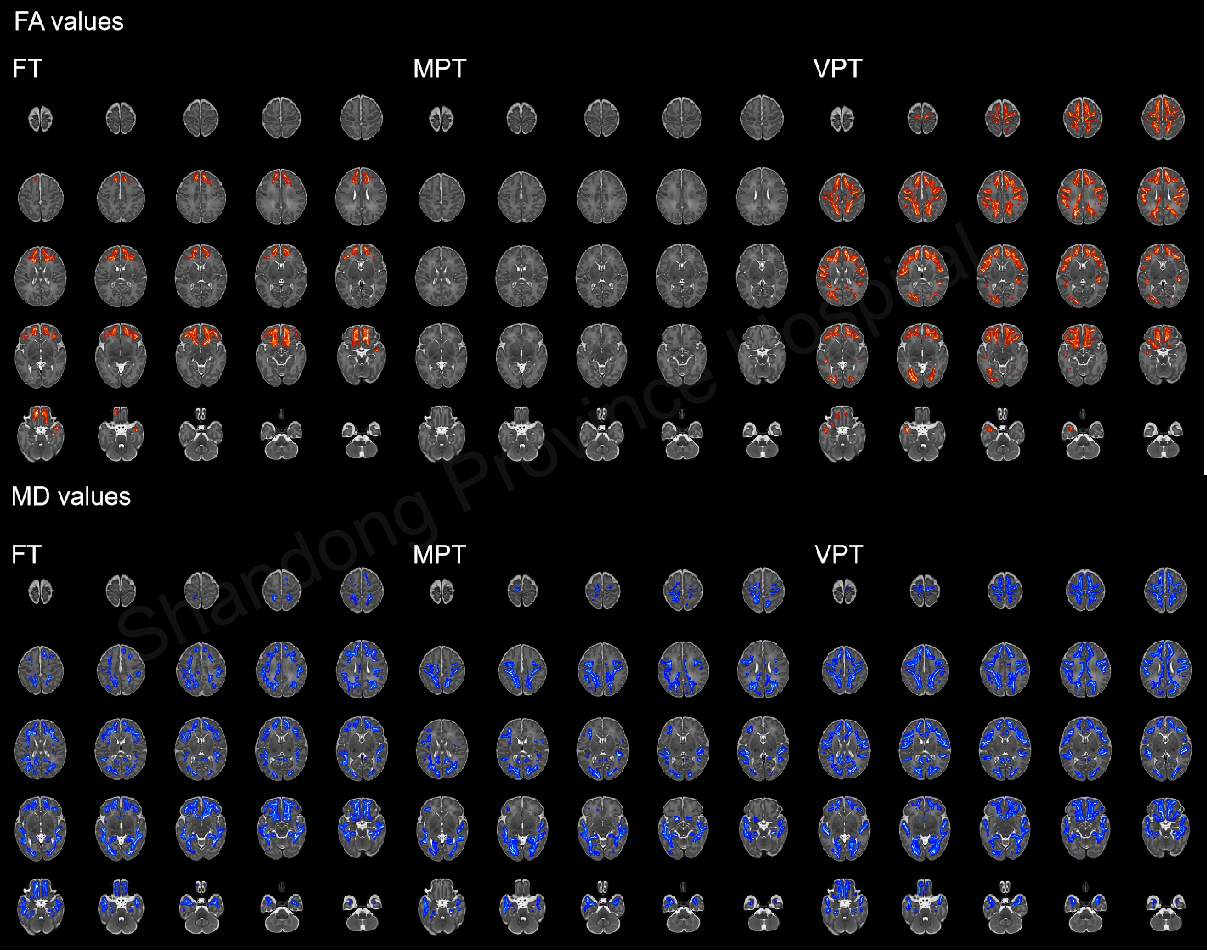
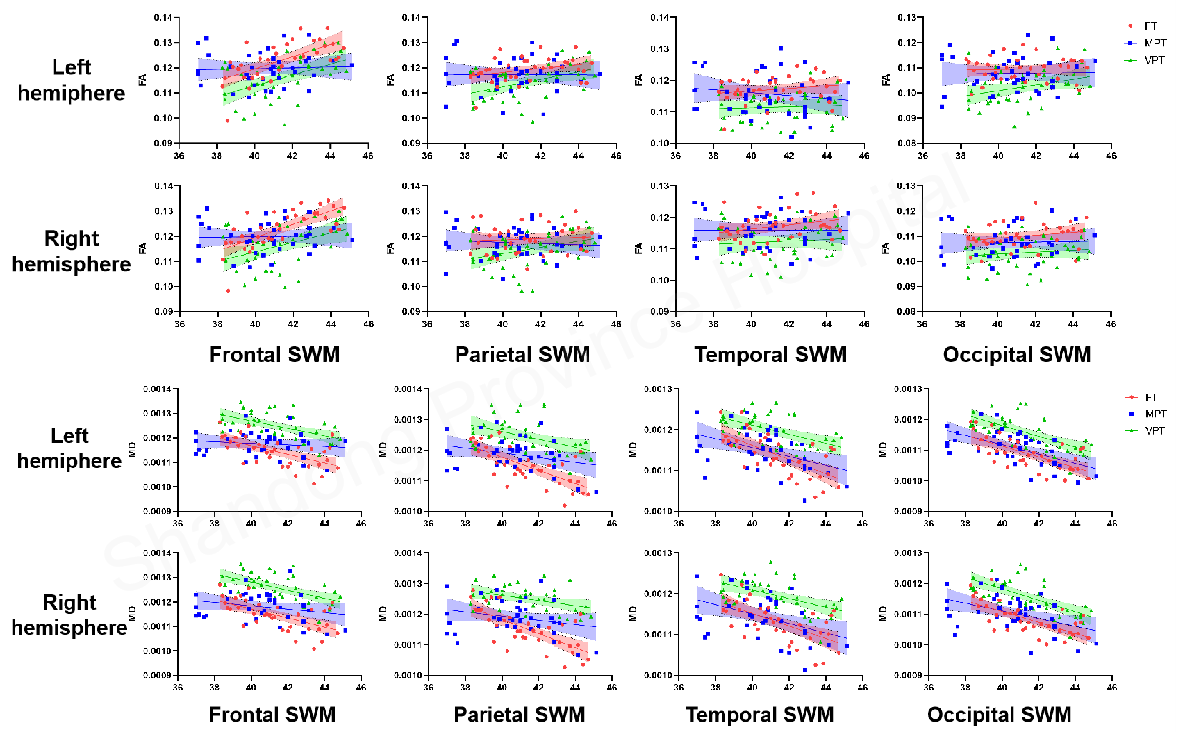
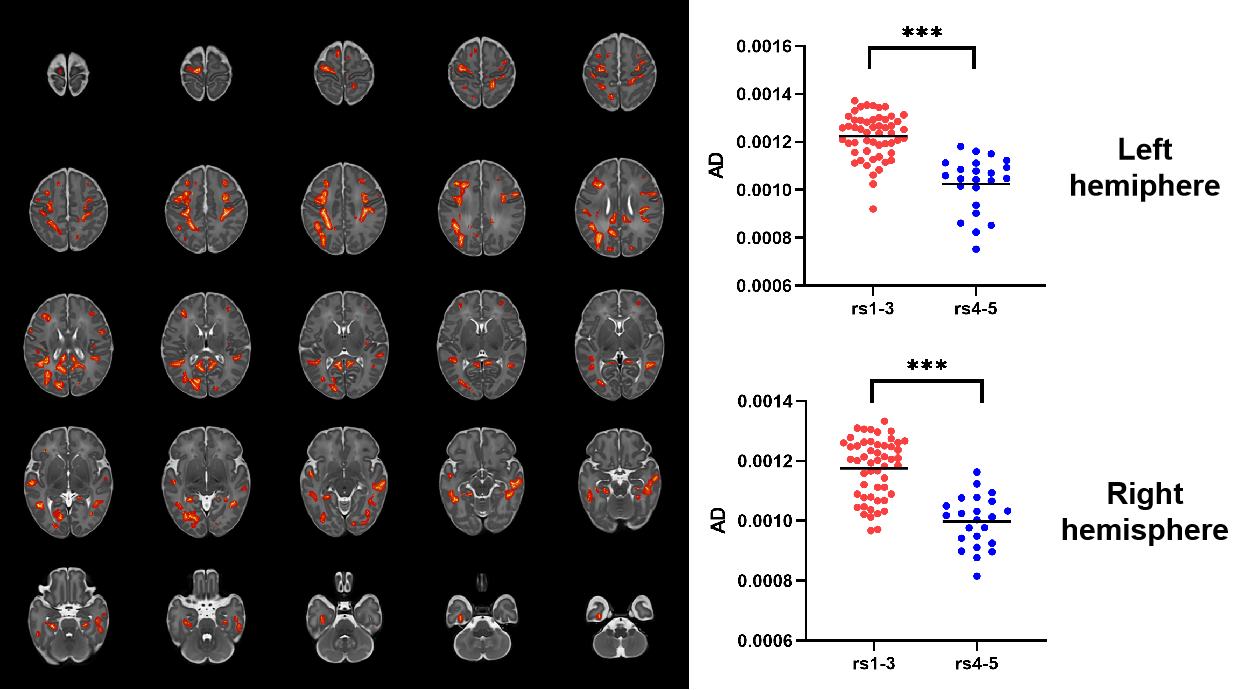
75 preterm infants were enrolled and 35 full term neonates as control group. Compared to moderately-term preterm infants and full term neonates, very preterm infants have lower FA values in frontal and parietal lobes (p<0.001), and whole-brain spread MD values increase, NDI and ODI values decrease (p<0.05). For developmental pattern, frontal SWM of moderately-late preterm infants showed no age-related changes of diffusion indices, meanwhile parietal and occipital lobes of preterm infants showed increasing numbers of voxels showing age-related MD, RD and NDI values change, even extended to frontal lobe of very preterm. In addition, AD values in some regions of radiological score 4-5 group preterm were lower than radiological score 1-3 group(p<0.001).Discussion
We found preterm birth impact on SWM by injuring very preterm infants SWM microstructures and delaying frontal SWM development of moderately-late preterm infants. Compensatory development of preterm infants was found mainly in parietal and occipital lobes for adaptive growth. Axonal injury of SWM in preterm infants may indicate more clinically significance.Summary
Preterm birth both injures the SWM microstructure of very preterm infants and alters the developmental pattern of preterm infants; axonal injury of SWM may be more clinically significant.Key result
1.Dose-dependent effects of preterm birth on superficial white matter are reflected by microstructural changes of very preterm infants and delayed frontal development of moderately late preterm infants at term-equivalent age.2. Compensatory development of superficial white matter is indicated by growing number of voxels of preterm infants showing age-related diffusion index changes.
3. The group of preterm infants with radiological score 4-5 showed lower AD values than the group with radiological score 1-3, which indicate axonal injury.
Acknowledgements
We are grateful to the families who generously supported this trial. Thank my teacher, thank myself.References
[1] Akazawa K, Chang L, Yamakawa R, et al. Probabilistic maps of the white matter tracts with known associated functions on the neonatal brain atlas: Application to evaluate longitudinal developmental trajectories in term-born and preterm-born infants. Neuroimage. 2016;128:167-179.
[2] Nazeri A, Chakravarty MM, Rajji TK, et al. Superficial white matter as a novel substrate of age-related cognitive decline. Neurobiol Aging. 2015;36(6):2094-106.
[3] Suárez-Solá ML, González-Delgado FJ, Pueyo-Morlans M, et al. Neurons in the white matter of the adult human neocortex. Front Neuroanat. 2009 Jun 9;3:7.
[4] Zhao T, Xu Y, He Y. Graph theoretical modeling of baby brain networks. Neuroimage. 2019;185:711-727.
[5] Nazeri A, Krsnik Ž, Kostović I, et al. Neurodevelopmental patterns of early postnatal white matter maturation represent distinct underlying microstructure and histology. Neuron. 2022;110(23):4015-4030.e4.
[6] Kirilina E, Helbling S, Morawski M, et al. Superficial white matter imaging: Contrast mechanisms and whole-brain in vivo mapping. Sci Adv. 2020 Oct 7;6(41):eaaz9281.
[7] Pittet MP, Vasung L, Huppi PS, et al. Newborns and preterm infants at term equivalent age: A semi-quantitative assessment of cerebral maturity. Neuroimage Clin. 2019;24:102014.
[8] Yuan S, Liu M, Kim S, et al. Cyto/myeloarchitecture of cortical gray matter and superficial white matter in early neurodevelopment: multimodal MRI study in preterm neonates. Cereb Cortex. 2022;33(2):357-373.
[9] Schilling KG, Archer D, Rheault F, et al. Superficial white matter across development, young adulthood, and aging: volume, thickness, and relationship with cortical features. Brain Struct Funct. 2023 May;228(3-4):1019-1031.
[10] Feng L, Li H, Oishi K, et al. Age-specific gray and white matter DTI atlas for human brain at 33, 36 and 39 postmenstrual weeks. Neuroimage. 2019;185:685-698.
[11] Oishi K, Zilles K, Amunts K, et al. Human brain white matter atlas: identification and assignment of common anatomical structures in superficial white matter. Neuroimage. 2008;43(3):447-57.
[12] Oyefiade AA, Ameis S, Lerch JP, et al. Development of short-range white matter in healthy children and adolescents. Hum Brain Mapp. 2018;39(1):204-217.
[13] Nazeri A, Chakravarty MM, Rajji TK, et al. Superficial white matter as a novel substrate of age-related cognitive decline. Neurobiol Aging. 2015;36(6):2094-106.
[14] Wang W, Yu Q, Liang W, et al. Altered cortical microstructure in preterm infants at term-equivalent age relative to term-born neonates. Cereb Cortex. 2023;33(3):651-662.
[15] Jeon T, Mishra V, Ouyang M, et al. Synchronous Changes of Cortical Thickness and Corresponding White Matter Microstructure During Brain Development Accessed by Diffusion MRI Tractography from Parcellated Cortex. Front Neuroanat. 2015;9:158.
Figures