2360
Longitudinal metabolic assessment for neonatal ischemic stroke in rat brain using CEST-MRI1Center for Biomedical Imaging Research, Department of Biomedical Engineering, Tsinghua University, Beijing, China, 2Pediatric Department, Peking University First Hospital, Beijing, China, 3Department of Information Science and Technology, Northwest University, Xi'an, China, 4Nonhuman Primate Research Center, Tsinghua University, Beijing, China
Synopsis
Keywords: Neonatal, CEST & MT
Motivation: Chemical exchange saturation transfer (CEST) has been employed for studying pH changes in acute phase of neonatal arterial ischemic stroke (NAIS), but not for long-term effects.
Goal(s): This study aimed to achieve longitudinal monitoring of NAIS evolution.
Approach: We constructed a 7-day-old NAIS rat model and explored the changes of brain metabolites by CEST-MRI. Contrast maps for contributing metabolites were calculated using Lorentzian Difference (LD) methods.
Results: All LD-quantified CEST contrast maps exhibit significant increase as age growth, in both sham group and the contralateral brain in NAIS group; Whereas the ischemic hemisphere displayed lower signals than the contralateral sides in NAIS group .
Impact: CEST signals displayed significant elevation over from 3h to 5w after surgery for both sham group and the contralateral brain tissue in NAIS group. This suggests the potential of CEST in sensitive and comprehensive assessment in NAIS diagnosis and management.
Introduction
Neonatal arterial ischemic stroke (NAIS) is a focal nerve injury occurring in the early stage of brain development, which often clinically manifested as intellectual and behavioral disorders in children [1]. The evolution of NAIS is complex and dynamic because the disease is accompanied by fast neuronal development. CEST-MRI is a ‘label-free’ metabolic imaging tool that could sensitively detect metabolites according their ‘featured’ frequency offsets, including amide and guanidium amine (G-Amine) protons on proteins and peptides, phosphocreatine (Pcr), as well as the NOE signals from aliphatic protons on macromolecules. CEST has been employed for studying pH changes in acute phase of NAIS, but not for long-term effects [2]. This study aimed to investigate the possibility of CEST-MRI and its multi-metabolite analysis, for aiding longitudinal monitoring of NAIS evolution in rat model.Methods
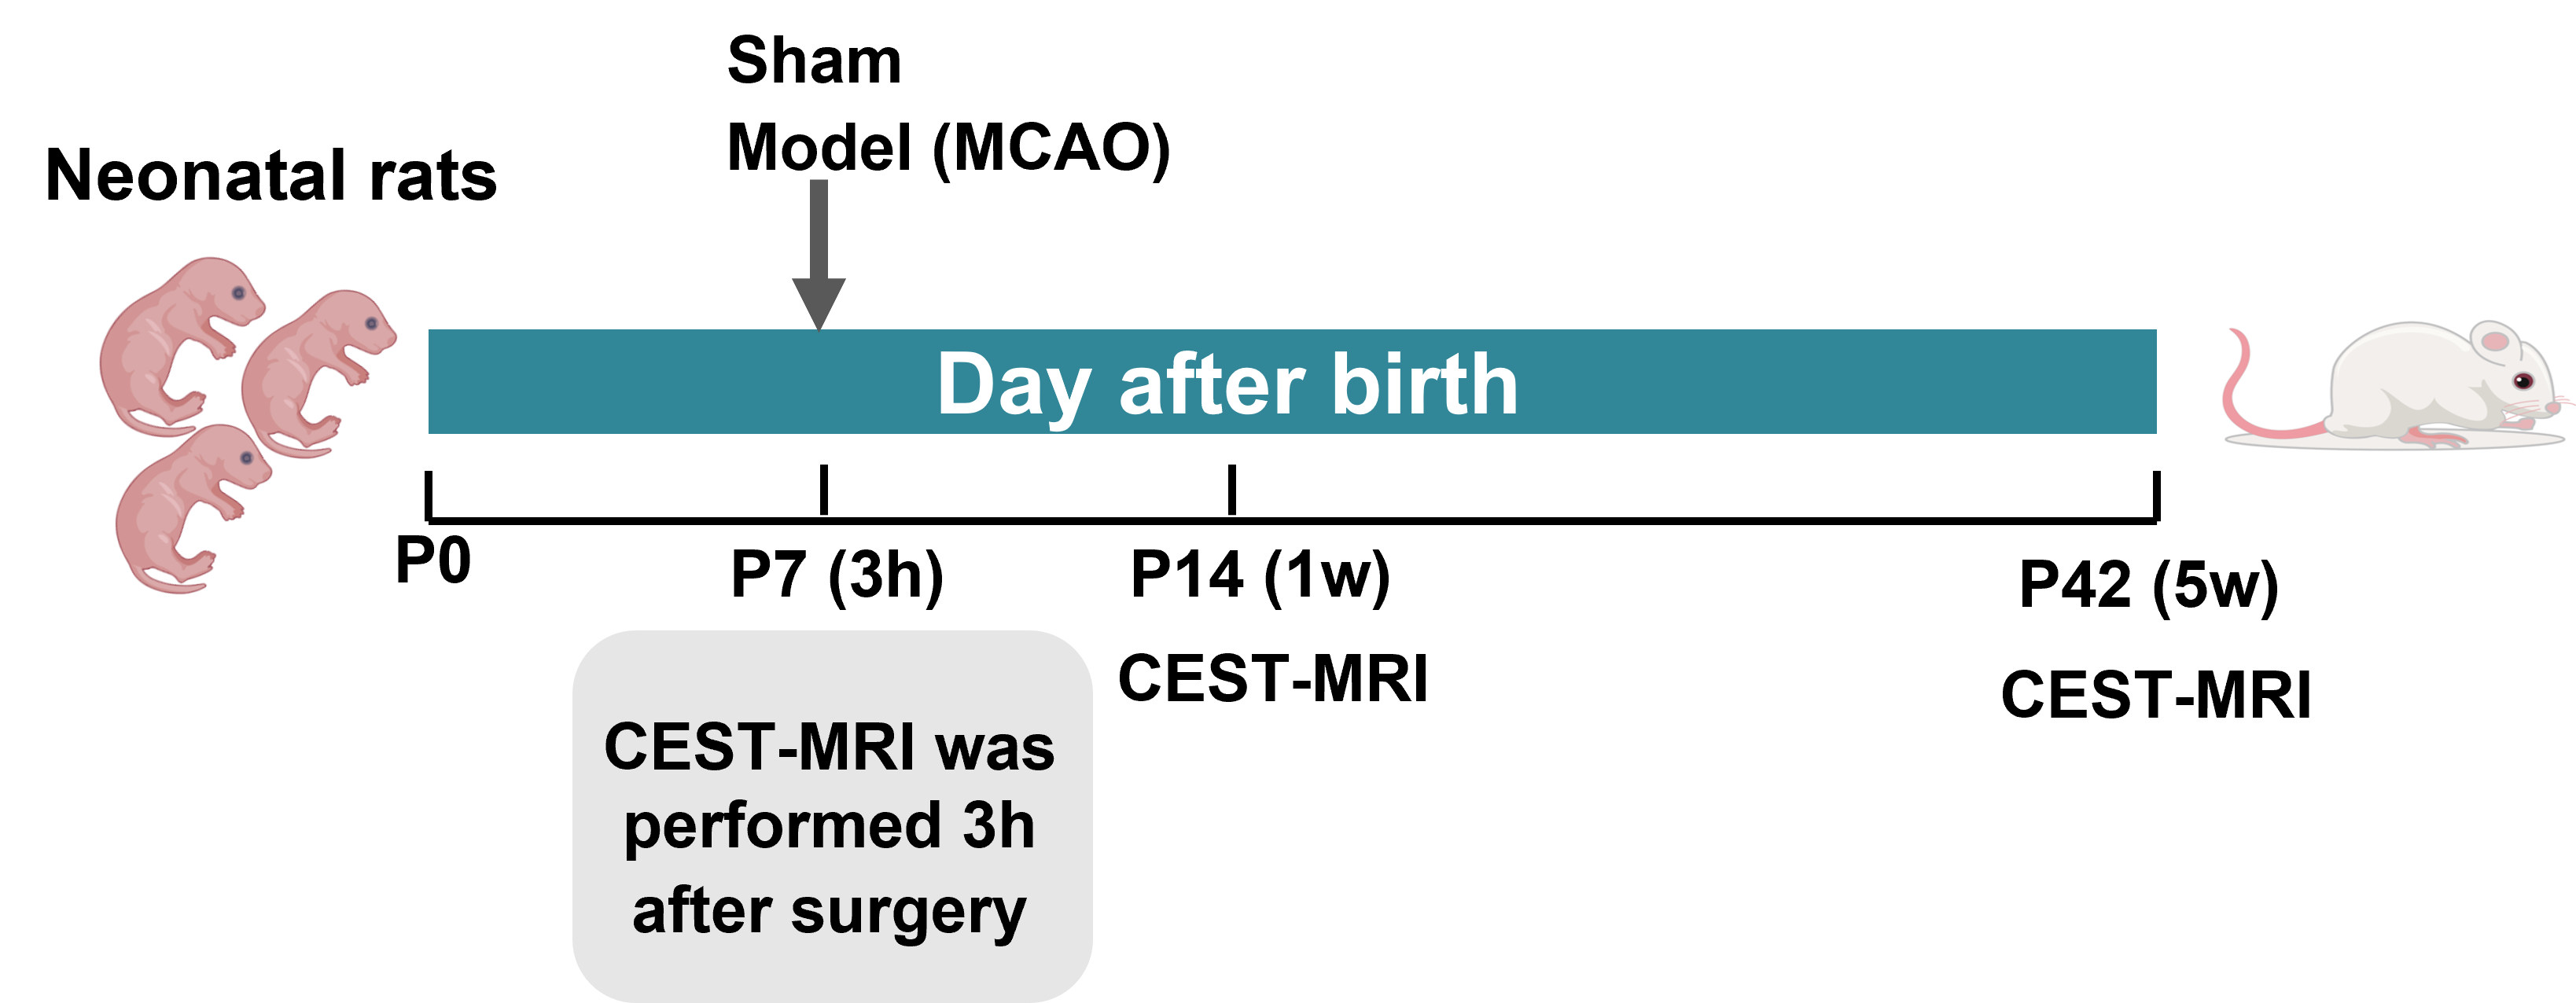
Animal Stroke ModelThe animal experiments have been approved by the Institutional Animal Care and Use Committee. When Pregnant Wistar rat (Vital River Laboratory, Beijing) delivered, the diary was P0. The number of neonatal rats was recorded within 12 hours after delivery and sexed to ensure 50% of each sex per group (sham or NAIS group) as much as possible. On the seven days of life (P7), neonatal ischemia stroke rats (NAIS group, n=6) following the standard intraluminal MCAO surgery as reported [3]. In the sham group (n=3), the right common carotid artery was isolated but no middle cerebral artery infarction was formed. CEST-MRI and 1H-MRS were performed 3 hours after surgery. The experimental schedule is presented in Figure 1.
In vivo CEST imaging
Neonatal rats were scanned 3 times at P7, P14 and P42 (i.e., 3 h,1 w and 5 w post MCAO surgery). All MR images were acquired on an 9.4 T (Bruker 94/30 USR) scanner with 86 mm quadrature resonator was utilized for transmitting and 16 mm lab-made signal enhancer (3 h), 1×3 phased array coil (1 w), 2×2 phased array coil (5 w) for reception. Rats were anesthetized with isoflurane (3%-4% induction, 1%-2% maintenance). CEST images were acquired using a CW saturation pulse of 2.5 seconds in length with B1 = 0.7 uT, followed by a single-slice steady-state RARE sequence (TR/TE=5500 ms / 3.5 ms). In total 32 saturation offsets were collected, unevenly distributed from -10 ppm to 10 ppm. Other scan parameters are: FOV=16 ×16 mm, 1.5 mm slice thickness.
Post-Processing
All CEST image processing were performed using MATLABR2023a (Mathworks, Natick, MA, USA). The ROI included up-cortex, corpus striatum and subcortex. Lorentzian Difference (LD) was computed to evaluate the CEST effect by subtracting the Z-spectra from the fitted Lorentzian function.
Results
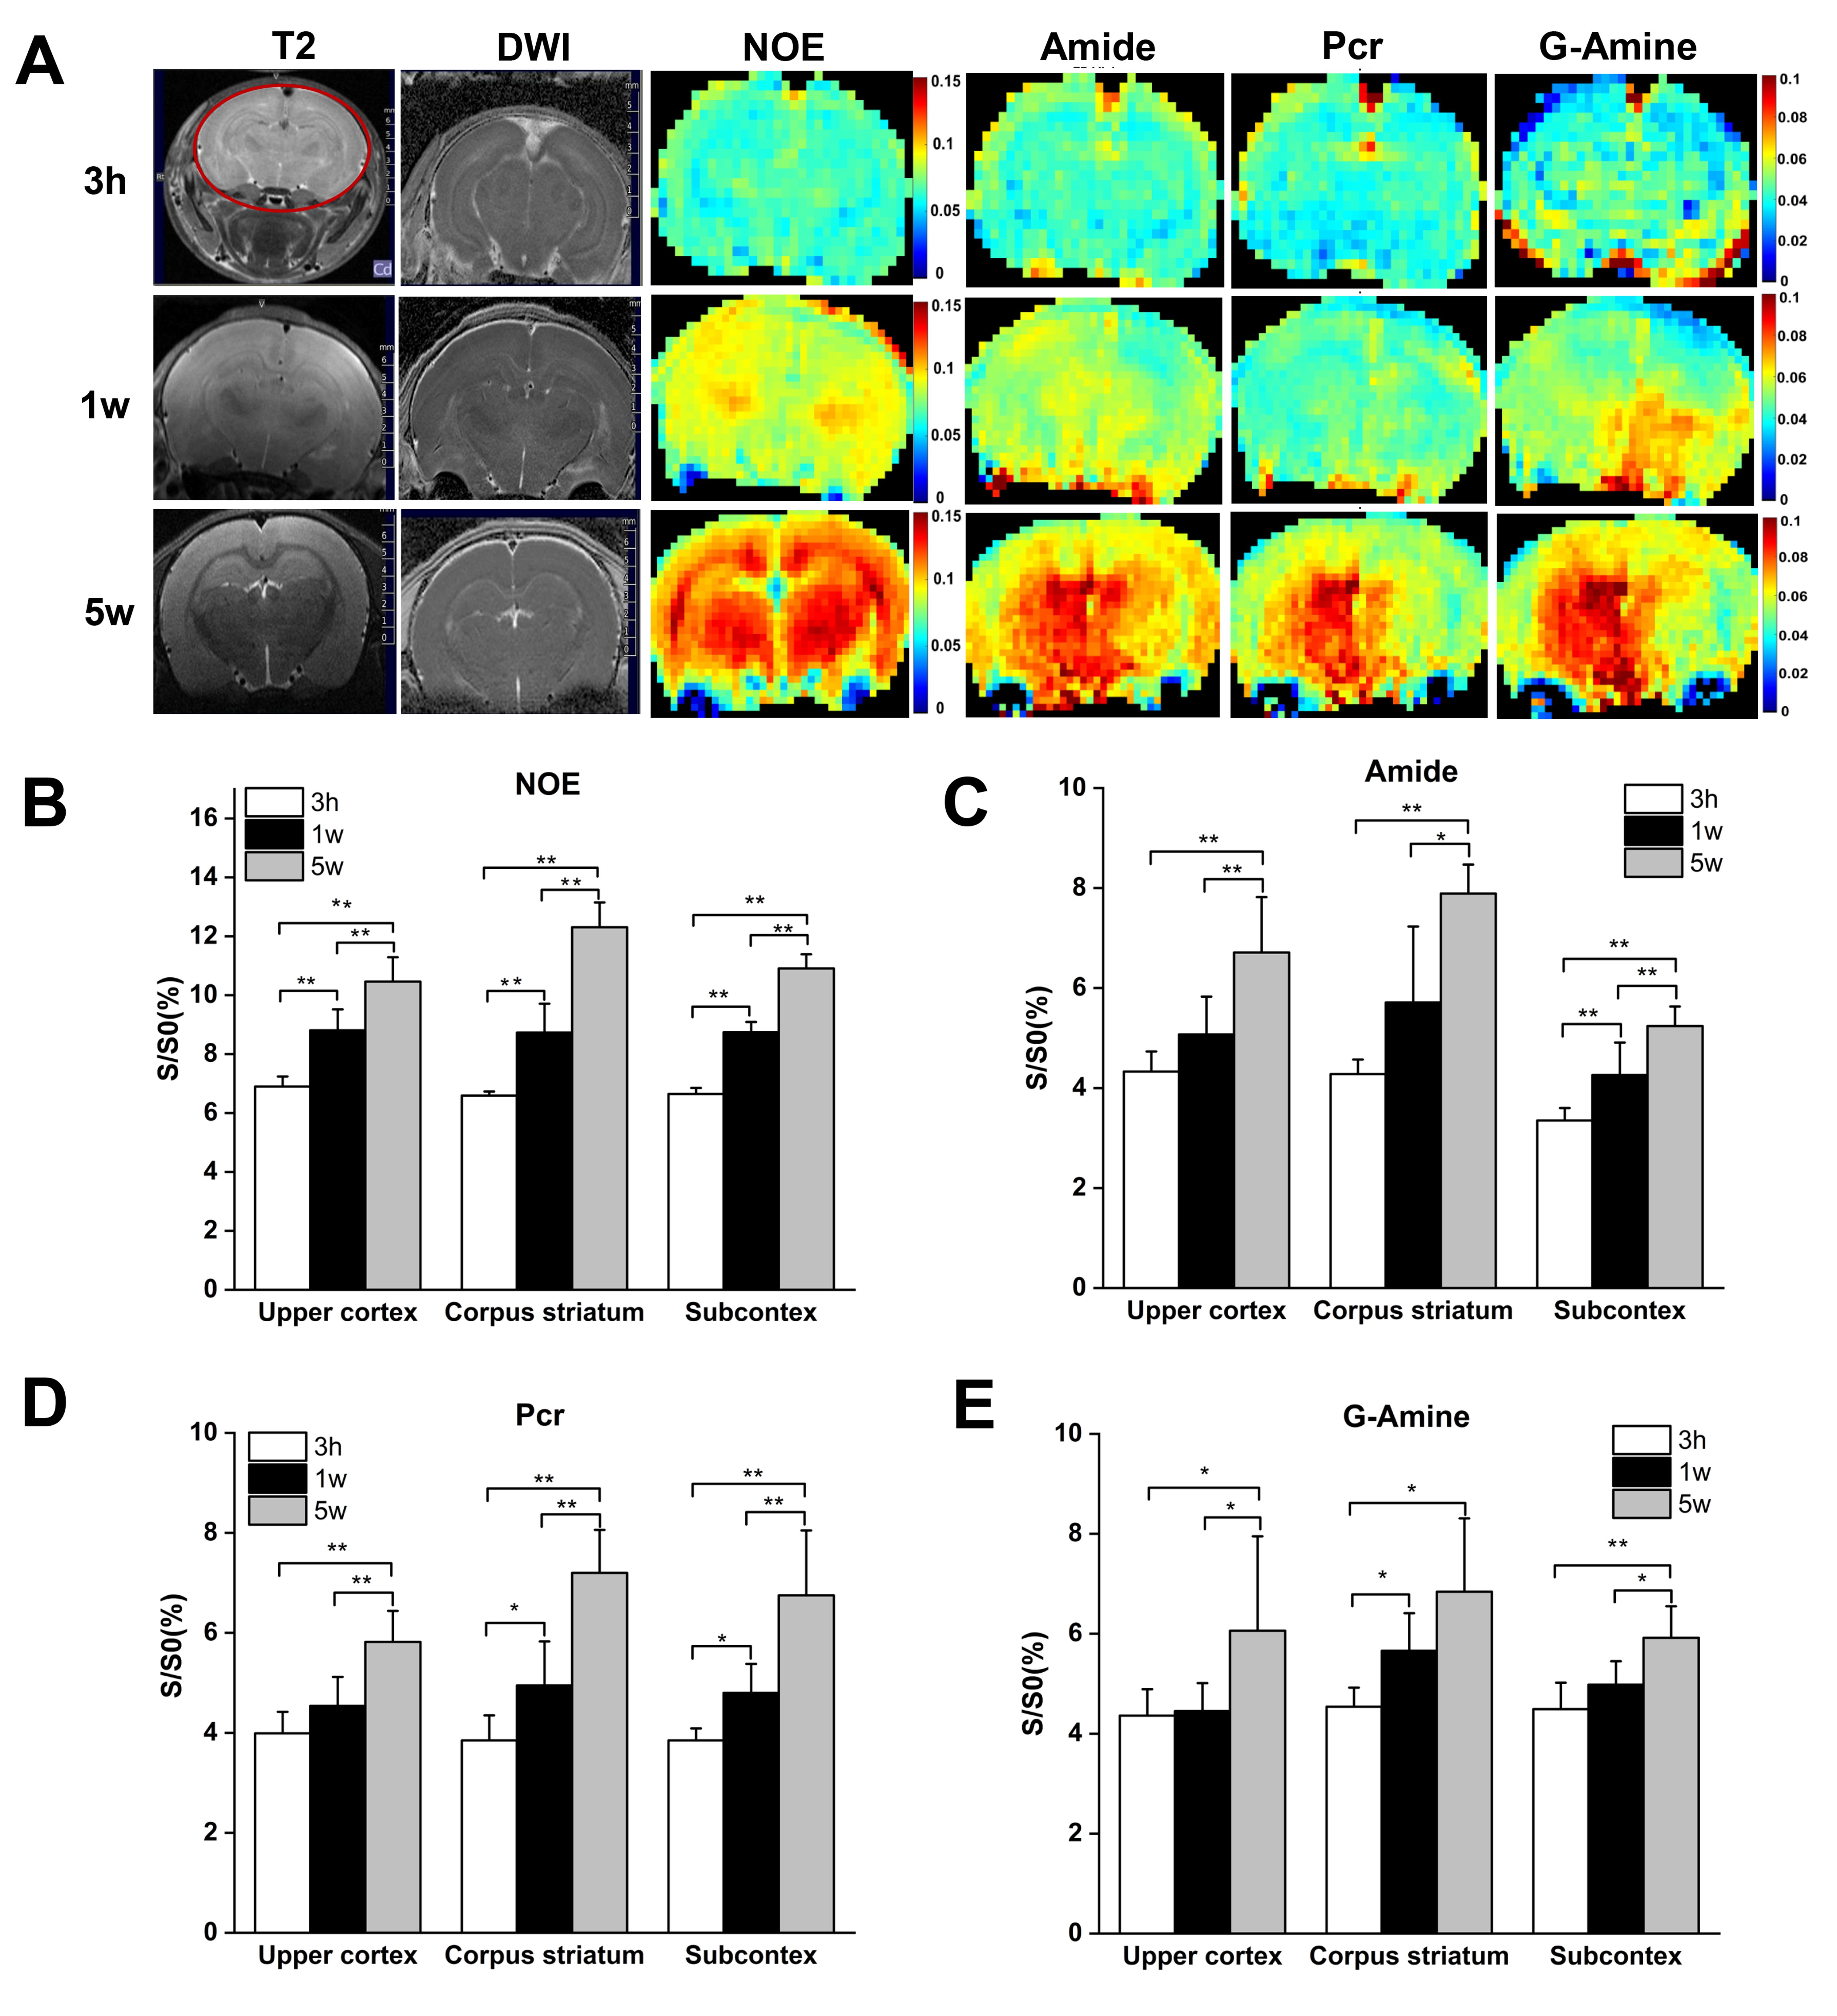
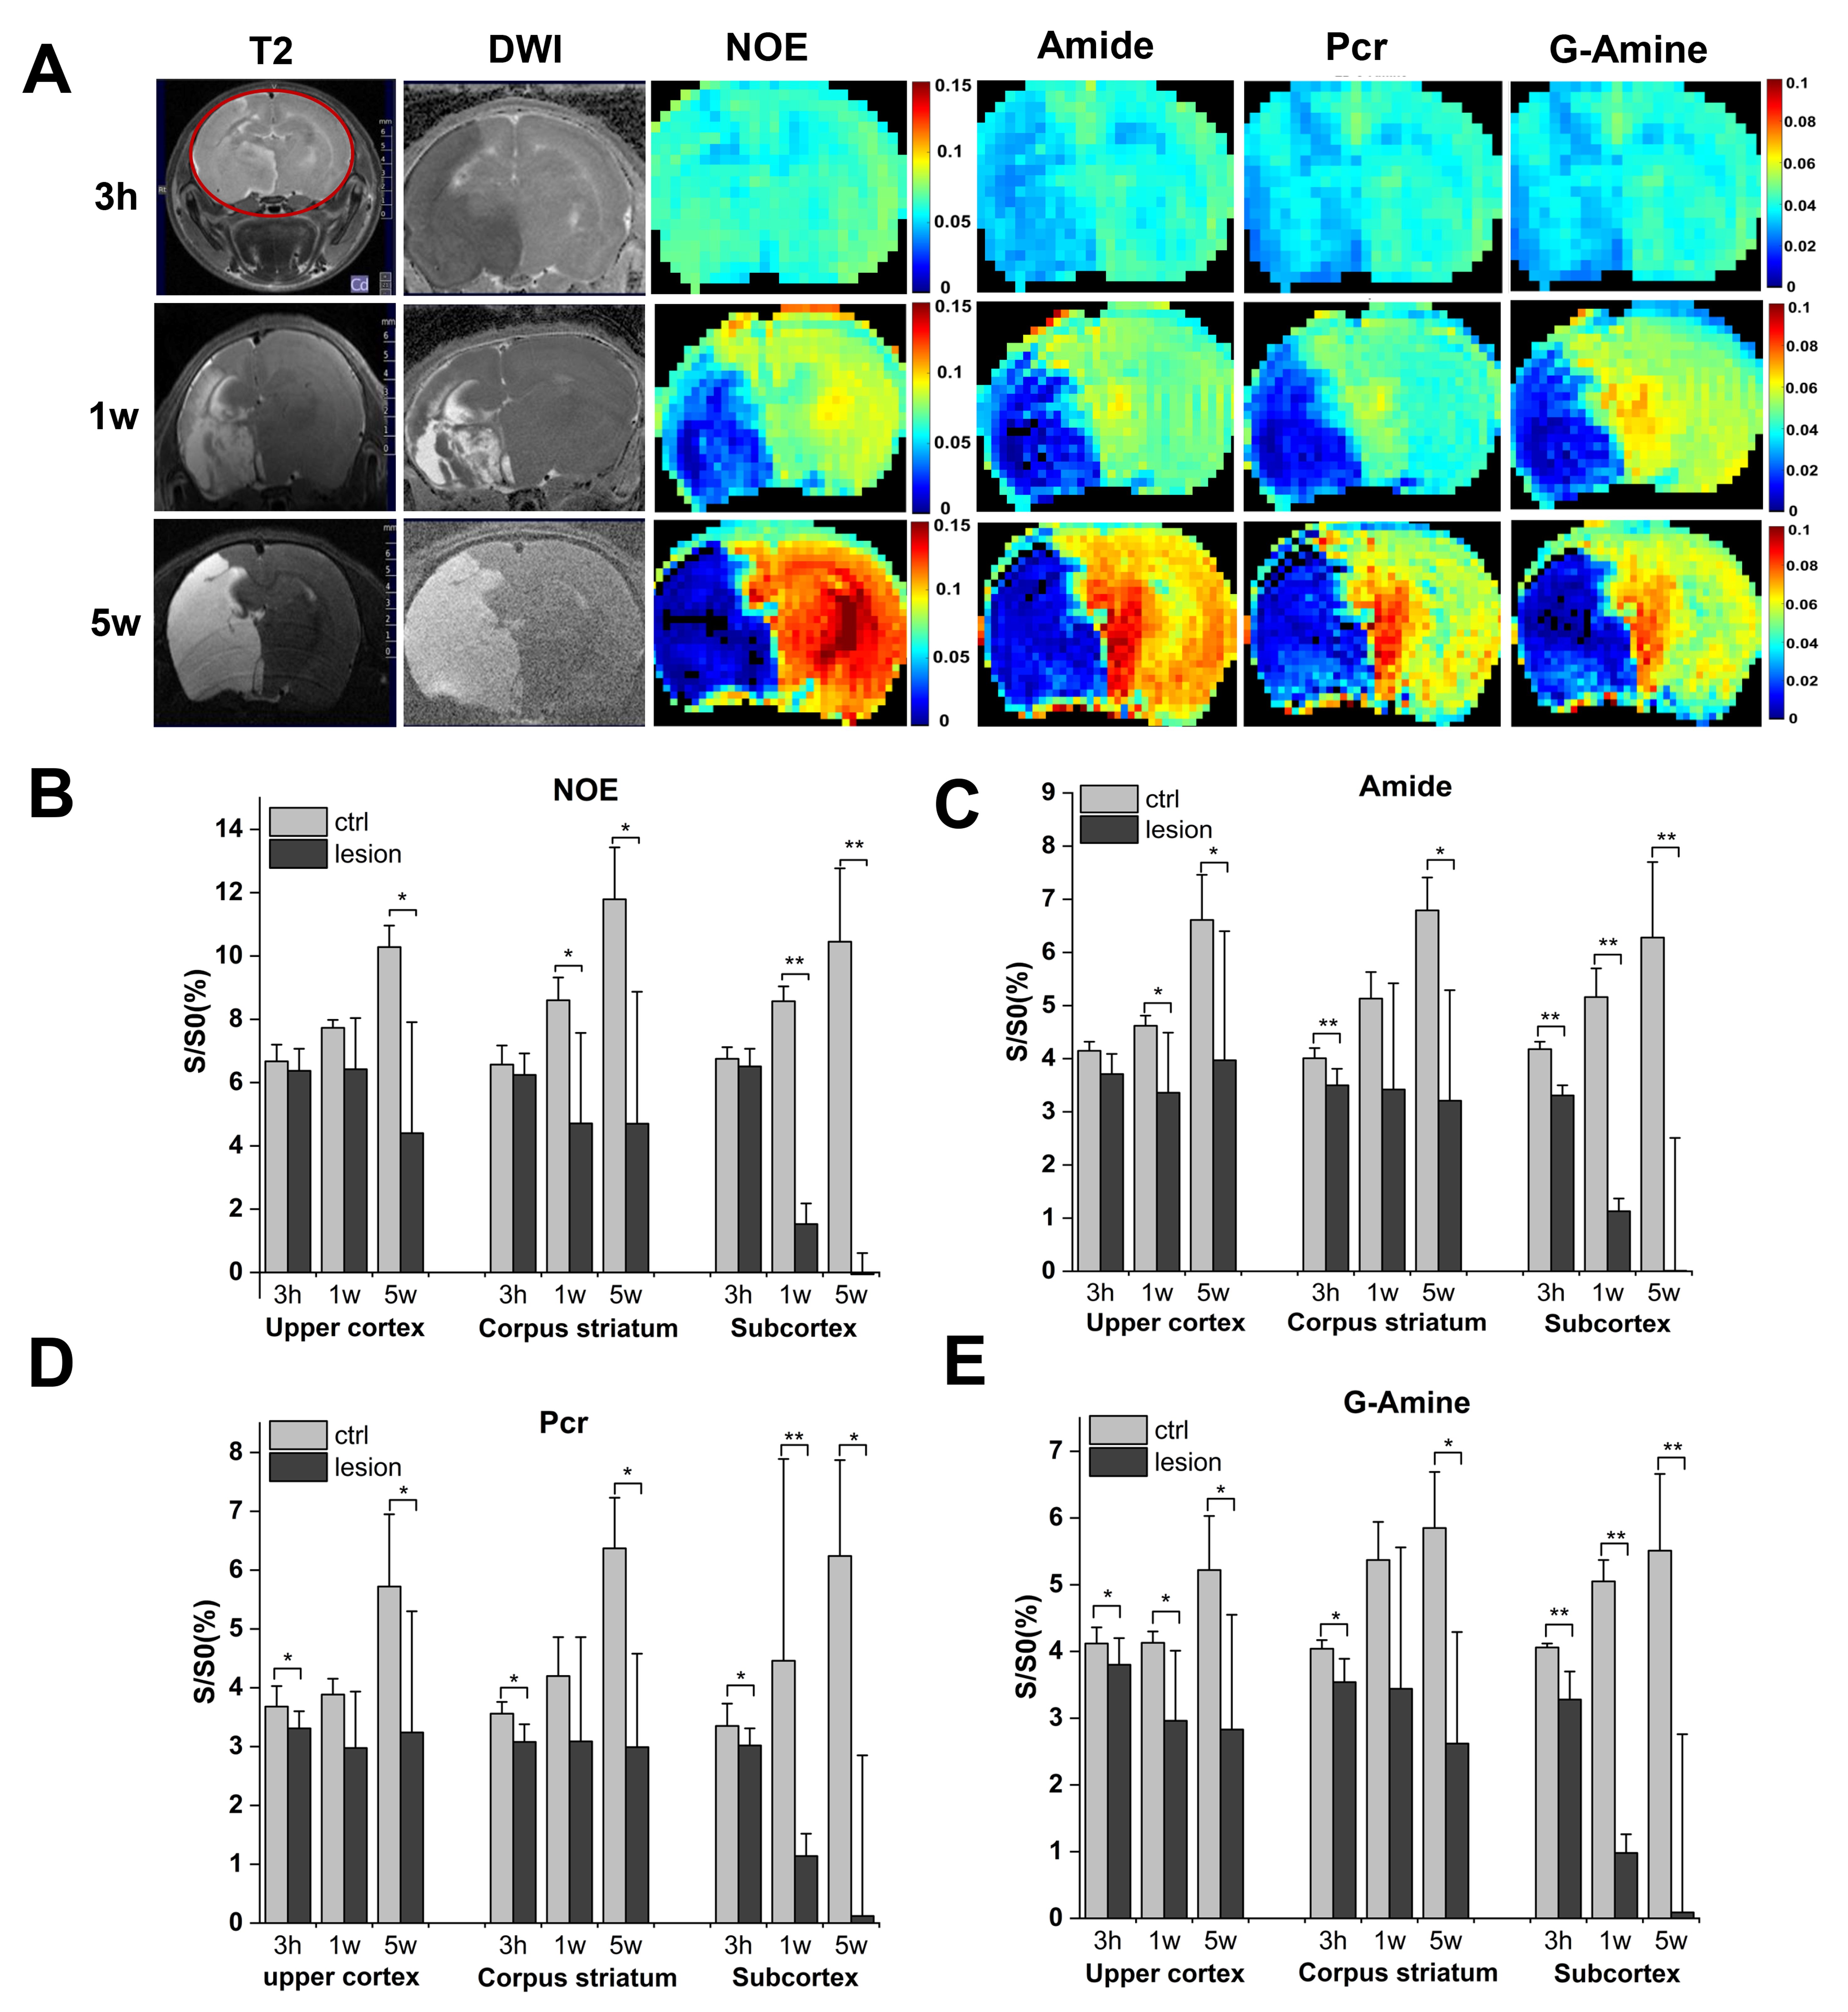
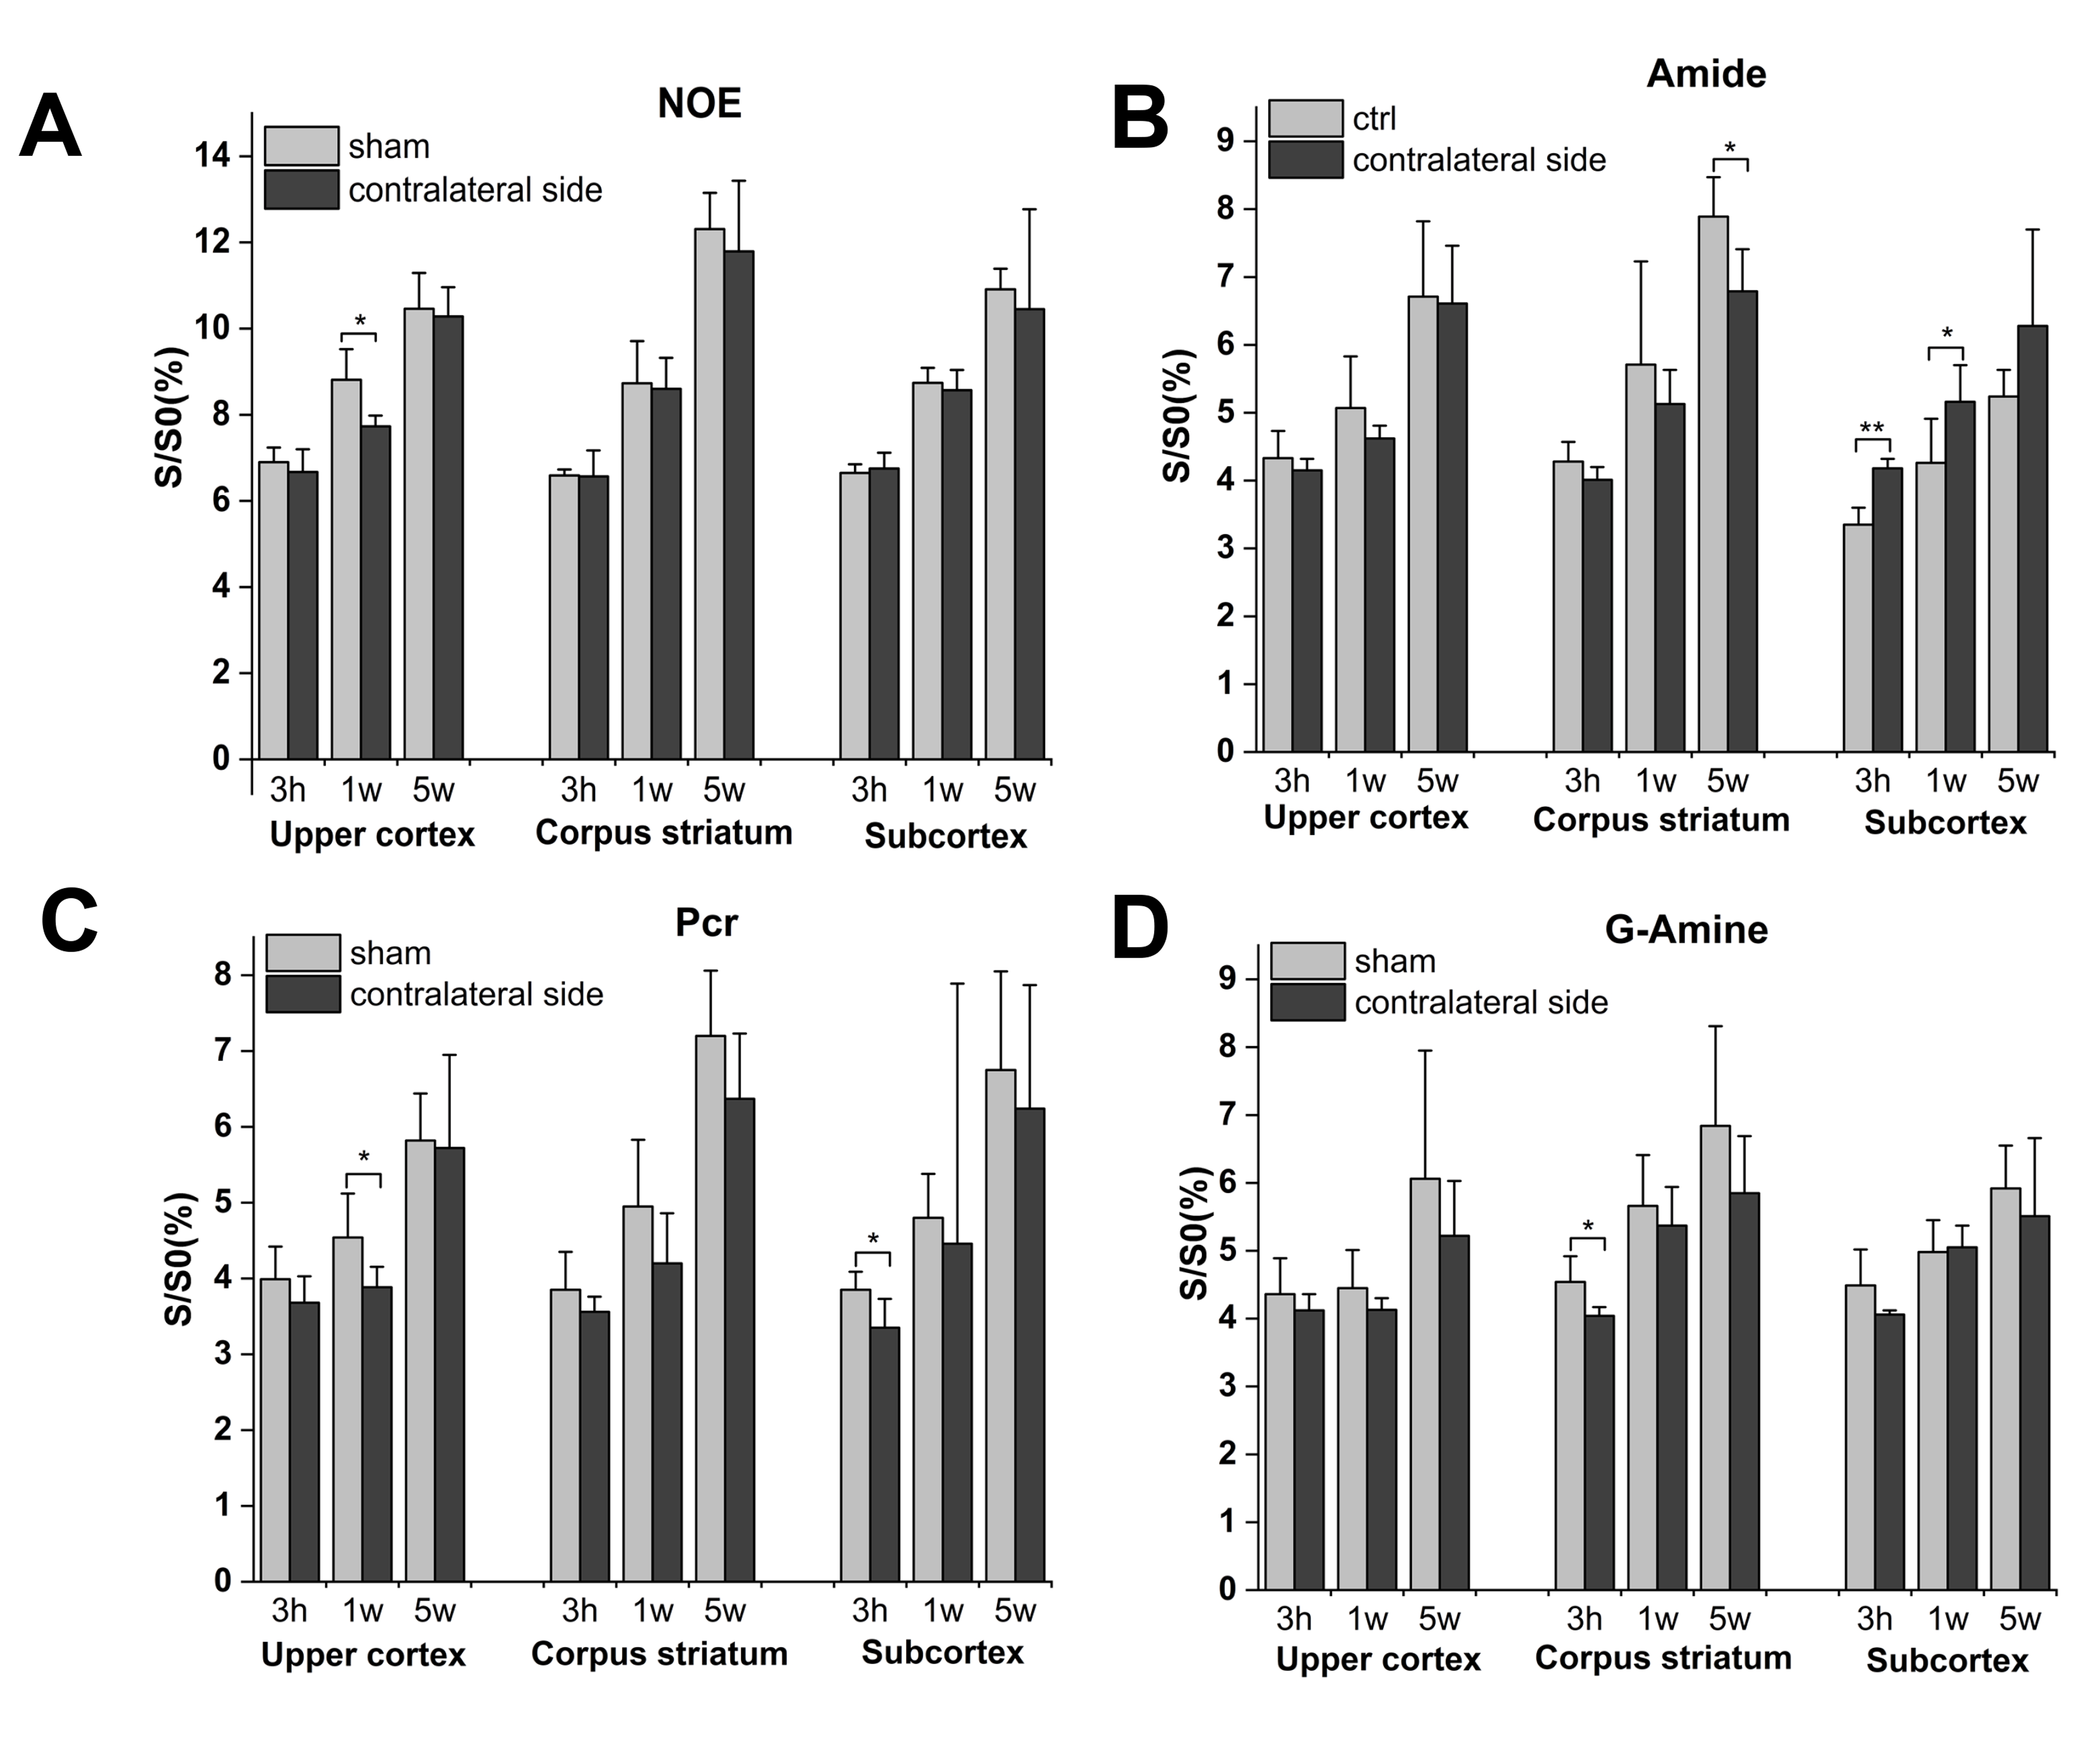
Figure 2A showed the T2WI, DWI, and CEST maps of a representative rat brain in sham group at different time points. In sham group, all LD-quantified CEST contrast maps (Amide, G-Amine, pCr and NOE signals from aliphatic protons) exhibit significant increase over from 3h to 5w after sham operation, reaching the maximum at 5w (Figure 2B-F). In contrast no obvious changes were observed on T2WI. Figure 3A showed the T2WI, DWI, and CEST maps of a representative rat brain in NAIS group at different time points. The ischemic hemisphere displayed a significantly lower signal than the contralateral sides in the upper cortex, corpus striatum and subcortex at 5w (P<0.05, Figure 3B-F), while the normal contralateral sides displayed similar increased CEST signals at multiple frequency offsets. Compared with the upper cortex and corpus striatum, the NOE, APT, Pcr and G-Amine values in the subcortex at 1w and 5w were significantly decreased (all p < 0.05). The average CEST contrast maps change in the sham group and contralateral sides of NAIS group has been displayed in Figure 4. The contralateral sides of NAIS group were slightly lower than that of the sham group, but there was no significant difference except for amide at subcortex in NAIS group.Discussion
We observed distinctive changes in NOE, APT, Pcr and G-Amine within the neonatal rats over from 3 h to 5 w post ischemia. The growth in NOE, Amine and Amide signals may provide a sensitive way in monitoring the brain development in neonatal rats, but further behavior and pathological experiments are needed to verify this.Conclusion
The feasibility for longitudinal monitoring of NAIS evolution in rat models using CEST MRI at 9.4 T has been demonstrated. Multiple frequency CEST MRI imaging and analysis may provide a sensitive metabolic MRI tool for diagnosis and management of NAIS evolution.Acknowledgements
This work is partially supported by National Key R&D Program of China 2022YFC36025,2022YFC3602503 and National Natural Science Foundation of China (NSFC) (Nos. 82071914).References
[1]. Mackay, M.T., et al., Association of Acute Infarct Topography With Development of Cerebral Palsy and Neurologic Impairment in Neonates With Stroke. Neurology, 2023. 101(15): 1509-1520.
[2]. Roumes, H., et al., Neuroprotective role of lactate in rat neonatal hypoxia-ischemia. J Cereb Blood Flow Metab, 2021. 41(2): 342-358.
[3]. Derugin, N., D.M. Ferriero, and Z.S. Vexler, Neonatal reversible focal cerebral ischemia: a new model. Neurosci Res, 1998. 32(4): 349-53.
Figures