2358
Functional characteristics of cerebral infarction lesion and its penumbra1Tianjin Medical University, Tianjin, China, 2Haikou People's Hospital, Affiliated Haikou Hospital of Xiangya Medical College, Central South University, Haikou, China, 3MR Research Collaboration,Siemens Healthineers, Guang zhou, China, 4Tianjin Fourth Central Hospital, Tianjin, China
Synopsis
Keywords: Stroke, Stroke, Resting-state fMRI, ischemic stroke, regional homogeneity, amplitude of low-frequency, penumbra, perfusion
Motivation: Functional changes in ischemic penumbra after cerebral infarction may indicate different degrees of hypoperfusion and different prognosis.
Goal(s): To explore the functional characteristics of infarction and its penumbra region using rs-fMRI.
Approach: The functional differences between infarct, penumbra and contralateral normal tissue were evaluated by Paired sample t test and Wilcoxon paired sign-rank test. Spearman correlation analysis was used to evaluate the correlation between the degree of hypoperfusion of the penumbra and the functional impairment.
Results: Substantial differences in functional characteristics were observed between infarction and normal tissue. The degree of ischemic penumbra was considerably correlated with its functional characteristics.
Impact: The elucidation of penumbral functional characteristics may influence its reversibility potential. Such knowledge can be pivotal in guiding clinical decision-making related to thrombolytic and neuroprotective treatments, optimizing patient outcomes.
Introduction
Ischemic stroke is characterized by focal neurological deficits and accounts for approximately 80% of all strokes.1 Astrup and colleagues first defined the "penumbra" as the hypoperfused tissue surrounding the ischemic core that is the target tissue for thrombolysis and reperfusion.2 In recent years, the perfusion and diffusion of the penumbra have been widely studied. However, the functional characteristics of the penumbra have not been specifically elaborated, and in particular, the relationship between the functional characteristics of the penumbra and its reversibility has not been investigated. Resting-state functional MRI (rs-fMRI) can reflect spontaneous neuronal activity, the amplitude of low-frequency fluctuation (ALFF)3 and regional homogeneity (ReHo),4 the indices derived from rs-fMRI, may reflect the intensity and consistency of neuronal activity of adjacent voxels, respectively. This study investigated the functional characteristics of infarction and its penumbra after ischemic attack.Methods
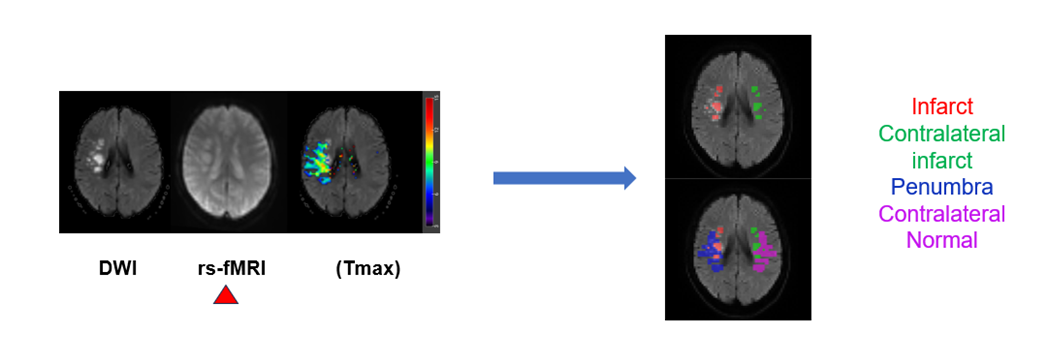
A total of 90 patients with acute ischemic stroke were recruited. The exclusion criteria were as follows: a previous history of neurological impairment or psychiatric disorder; infarcts in both cerebral hemispheres; and small lesions (maximum diameter <2 cm). The MRI data were collected using a 3T system (MAGNETOM Skyra, Siemens Healthineers, Erlangen, Germany). Each patient underwent MRI, including rs-fMRI and DWI; this was followed by computed tomography perfusion (CTP) examination in 21 patients. rs-fMRI images were acquired using an echo-planar imaging sequence with the following parameters: TR/ TE, 2500/30 milliseconds; flip angle, 90°; field of view (FOV), 192 mm; matrix, 64 × 64; slice thickness, 4 mm, 25 slices; bandwidth, 2442 Hz/pixel; and 120 volumes, resulting in a scan time of 5 minutes 9 seconds. The CT perfusion was acquired using a 128-detector scanner (SOMATOM Drive, Siemens Healthineers, Forchheim, Germany). The CTP data was postprocessed using Siemens “syngo.via” software. Time-to-maximum (Tmax) maps were generated to visualize hypoperfused tissue (Tmax > 6 seconds), with a higher Tmax value signifying a more pronounced degree of cerebral hypoperfusion .5 The DWI lesion area represented the infarction, and the area between the hypoperfused tissue and the DWI lesion represented the penumbra. DPARSF (http://www.restfmri.net) was used for rs-fMRI data preprocessing and obtained ALFF by discrete Fourier transform. ReHo was calculated using Kendall's coefficient of concordance. A radiologist (C.Y.P) delineated regions of interest (ROIs) for quantitative analysis. The ROI delineation process is depicted in Figure 1. Paired-sample t-tests were used to compare ALFF and ReHo values between the infarct and contralateral areas. The Wilcoxon paired signed-rank test was used to compare the ALFF and ReHo values between the penumbra and the contralateral normal tissue. The ratio of ALFF/ ReHo between penumbra and contralateral normal tissue was calculated to obtain the relative ALFF (rALFF) and relative ReHo (rReHo). Spearman correlation analysis assessed relationships between rALFF, rReHo, and Tmax in the penumbra. All analyses were performed using SPSS 26.0 for Windows.Results
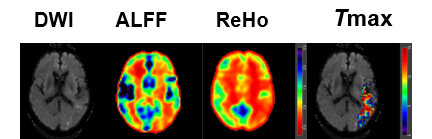
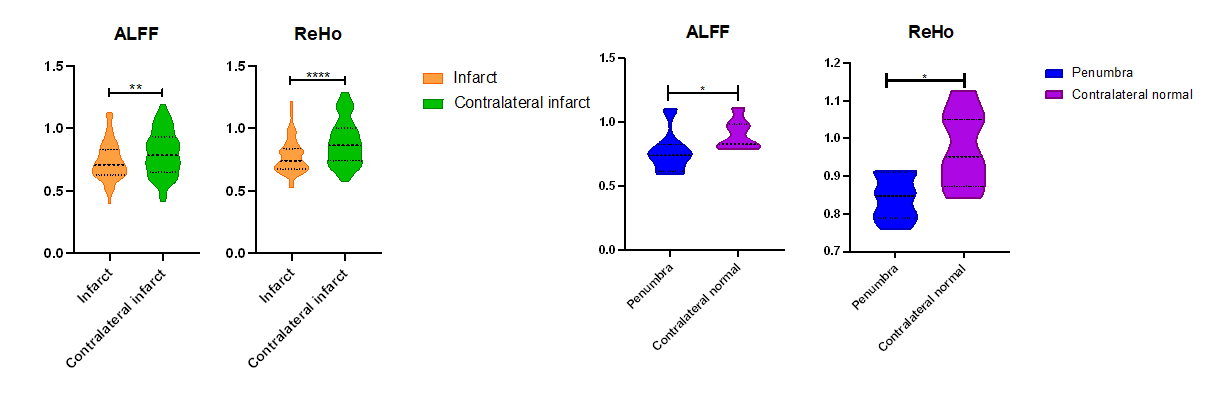
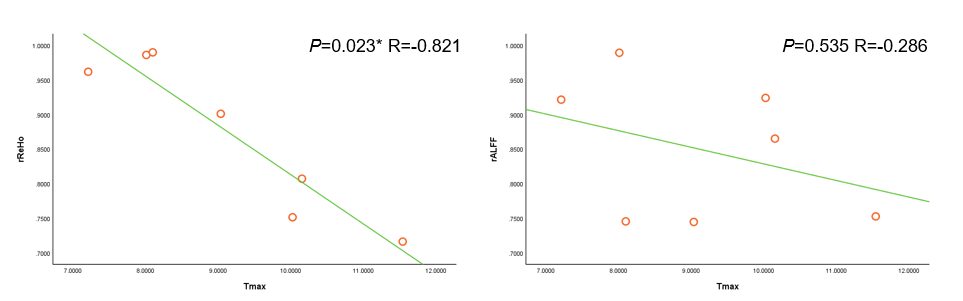
A total of 49 patients participated in the study (mean age: 67 years; 36 male and 13 female; time range from stroke onset to imaging examination: 2.5 hours to 7 days). Penumbral areas were present in 7 of 21 patients who underwent CT perfusion. Figure 2 shows the functional and perfusion maps of a typical patient. The results of the paired-sample t test demonstrated that ALFF (P =.004) and ReHo (P <.0001) values in the infarct were remarkably lower than those in the contralateral infarct. In the 7 patients with penumbra, ALFF (P = .016) and ReHo (P = .016) levels were lower than those in healthy tissue (Fig. 3). Table 1 shows the penumbra information of 7 patients. Spearman correlation analysis revealed a significantly negative correlation between rReHo and Tmax (P =.023, R = –0.821), that is, the more ischemic the penumbral tissue, the more disturbed the neuronal activity. However, no obvious correlation was noted between rALFF and Tmax (P =.535, R = -0.286) (Fig. 4).Discussion/Conclusion
Our study revealed considerable variations in ALFF and ReHo between infarcted regions and corresponding healthy counterparts, suggesting successful tracking of altered brain functioning following an ischemic stroke event. Moreover, ReHo was more sensitive in evaluating infarct and penumbra. The functional characteristic parameters of infarction and penumbra generally decreased, which is consistent with the results of Tsai et al.6 7 Despite a limited initial penumbra sample of just seven cases, we discovered a strong inverse correlation between rReHo and Tmax levels. This correlation suggests that as perfusion decreases, neuronal dysfunction within the penumbra intensifies. This intriguing relationship may provide valuable insights into varying prognoses following ischemic strokes.Acknowledgements
We would like to express our sincere thanks to all those involved in this study for their contributions.References
- Campbell, B. C. V. et al. Nat Rev Dis Primers 5, 70 (2019).
- Astrup, J., Symon, L., Branston, N. M. & Lassen, N. A. Stroke 8, 51–57 (1977).
- Auer, D. P. Magnetic Resonance Imaging 26, 1055–1064 (2008).
- Shen, Z. et al. Ann Transl Med 8, 1319–1319 (2020).
- Giammello, F. et al. Radiol med 127, 414–425 (2022).
- Tsai, Y.-H. et al. PLoS ONE 9, e105117 (2014).
- Liu, Y. et al. J. Magn. Reson. Imaging 26, 1112–1116 (2007).
Figures