2354
Structural connectivity networks of putamen subregions in health and in early Parkinson’s Disease1School of Biomedical Engineering, The University of Sydney, Sydney, Australia, 2Brain and Mind Centre, The University of Sydney, Sydney, Australia, 3National Imaging Facility, Sydney, Australia, 4School of Medical Science, The University of Sydney, Sydney, Australia, 5School of Psychology, The University of Sydney, Sydney, Australia, 6Neuroscience Research Australia, Sydney, Australia, 7Sydney Imaging, The University of Sydney, Sydney, Australia
Synopsis
Keywords: Parkinson's Disease, Parkinson's Disease, Brain connectivity, Diffusion MRI
Motivation: Putamen, a subcortical grey matter (SGM) structure and its associated brain connectivity networks are often implicated in the early stages of Parkinson’s Disease (PD).
Goal(s): With more detailed structural connectivity analysis using SGM parcellation, we characterise the structural connectivity of putamen subregions in healthy brains, and their alterations in early PD.
Approach: Using data from Parkinson’s Progressive Markers Initiative, structural connectivity analysis, and by incorporating SGM parcellation, we have revealed the connectivity networks specific to four putamen subregions.
Results: Heterogeneous connectivity alteration was identified in PD subjects, demonstrating weakening of intra-SGM connectivity within hemisphere and strengthening of it across hemispheres.
Impact: We identified structural connectivity networks specific to four putamen subregions in healthy brain and in early Parkinson’s Disease. Our method allows focused connectivity analysis while our findings provide new insight into the intra- and inter-hemispheric connectivity alterations with disease progression.
Introduction
Putamen is a subcortical grey matter (SGM) structure that plays key roles across learning, cognition and motor control1. The putamen and its associated brain connectivity are often implicated in the early stages of neurodegenerative disorders, such as in Parkinson’s disease (PD)2. Using MRI, putamen atrophy and increased functional connectivity of putamen have been identified as possible biomarkers for PD3,4. Parcellation of SGM has now enabled segregation of putamen subregions with distinct microarchitectural properties5. In this pilot study, we aim to improve the characterisation of putamen subregion’s structural connectivity in healthy brains, and then assess how connectivity is implicated in mild and moderate PD, as defined by the MDS-Unified Parkinson’s Disease Rating Scale Part-III (MDS-UPDRS-III)6.Methods
T1w and dMRI data were downloaded from the Parkinson’s Progressive Markers Initiative (PPMI)7 for 20 control and 20 PD subjects. Disease severity for PD cases was evaluated by motor examination using the MDS-UPDRS part III, where higher scores indicate greater motor impairment6. Following standard preprocessing steps8 for each subject, 20M streamlines were generated, 10M by dynamic seeding and 10M seeded from the SGM region. For SGM parcellation atlas, all subjects were registered to 50-subject template space5 by multi-modal registration9. SGM parcellation5 was warped to subject space, the Desikan-Killiany (DK)10 and extended DK (DK-ex) atlases were computed for each subject using Freesurfer11. DK-ex atlas appends SGM parcellation (which includes putamen sub-regions per hemisphere)5 at the end of standard DK atlas10,11. Structural connectivity12 was computed using both atlases. Streamline weights were averaged for the healthy group. For the PD subjects, streamline weights for connections between each putamen subregion to each brain parcel, were correlated individually against the MDS-UPDRS part III scores.Results
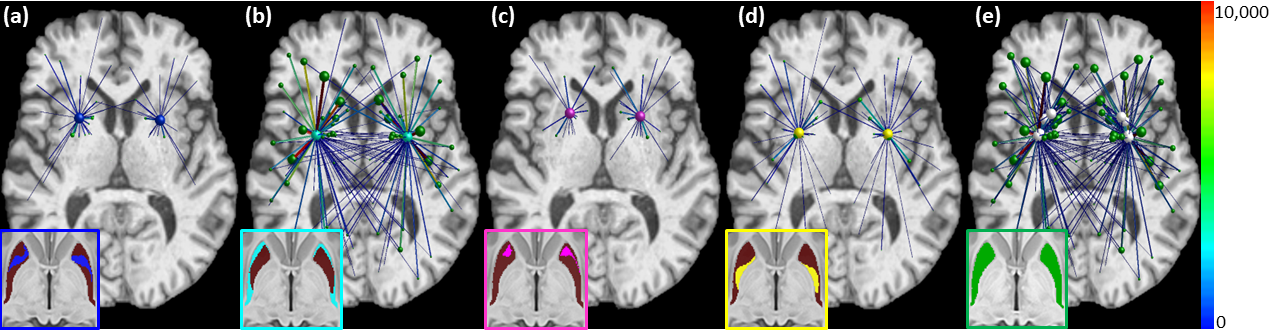
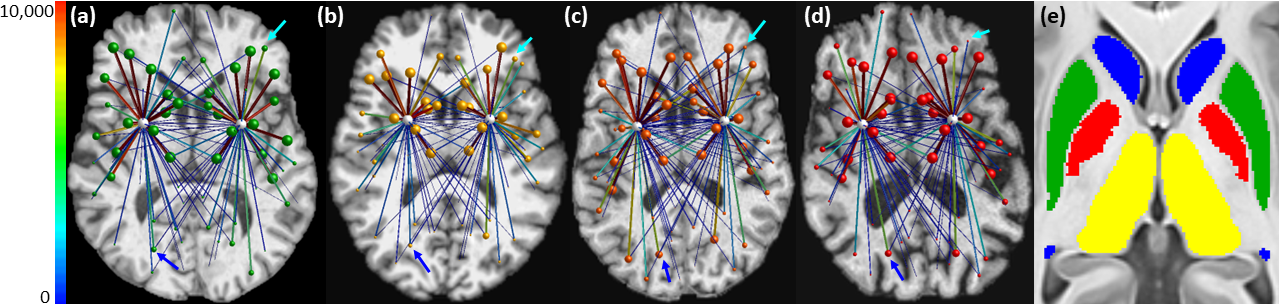
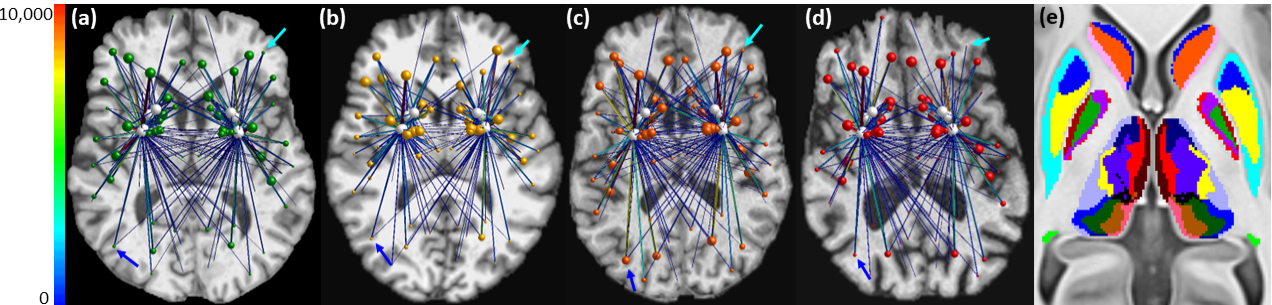
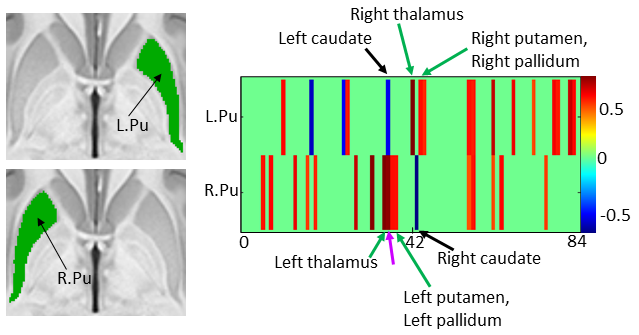
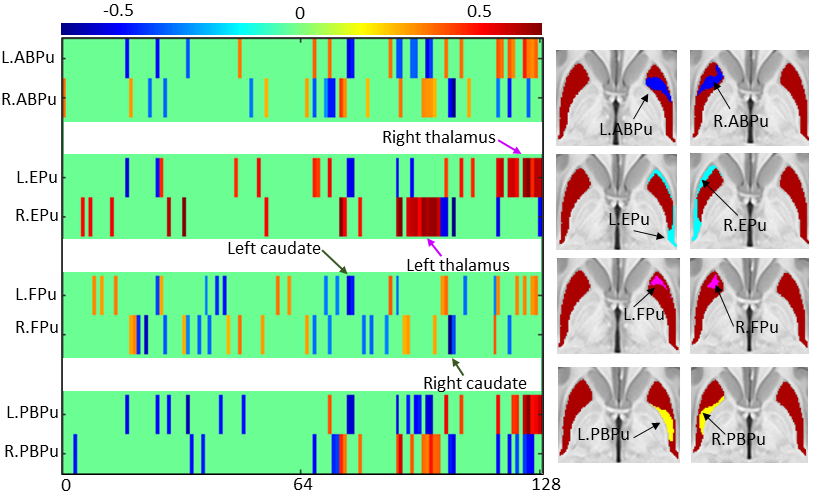
For the healthy group, different connectivity patterns were observed for the putamen subregions as shown in Figure 1: anterior body of putamen (ABPu, a), external putamen (EPu, b), fundus of putamen (FPu, c), and posterior body of putamen (PBPu, d). Intricate connectivity networks were observed when all the subregions were combined (e). For the PD subjects, MDS-UPDRS part III scores ranged from 4 to 41, which corresponds to mild to moderate PD6. Figure 2 shows illustrative examples of streamline weight alterations in three PD subjects with varying MDS-UPDRS part III scores for parcels corresponding to DK atlas and full putamen. This highlights the heterogeneous nature of PD connectivity alterations. For the same subjects, when using SGM parcellation and DK-ex atlas, more detailed information was obtained on structural connectivity to, and within, SGM subregions (Figure 3). The 20% strongest correlations between putamen connectivity and MDS-UPDRS-III score are shown for DK atlas in Figure 4. Between the left and right putamen, relatively high (inverse) correlation was observed for caudate on the same hemisphere, but not for other SGM structures, including contralateral caudate or thalamus. Remarkable correlations were observed when the same analysis was repeated for DK-ex atlas with putamen subregions (Figure 5).Discussion and Conclusions
FPu is a well-documented specialised sub-region in humans13 while EPu has previously been reported in rodent brains14 and has very recently been identified in human using ultra-high resolution MRI at 7T15. However, no putamen subregions have yet been added to extant MRI-based parcellations. Our SGM parcellation and the more detailed connectivity analysis have revealed the structural networks specific to putamen subregions. Fpu and ABPu demonstrated focused connectivity towards the frontal and motor regions while PBPu and Epu showed diffuse connectivity. These findings suggest differential roles of putamen subregions in cortical communication and function, confirming the need for focused connectivity analysis for putamen subregions while assessing PD. Note, our analysis approach can also be extended to explore connectivity in other SGM structures like thalamus.Heterogeneous alterations were identified in structural connectivity of PD subjects, with both decreased and increased connectivity for different brain parcels. This observation agrees with PD studies where reduced structural connectivity were reported for motor16 and sensorimotor17 regions, while enhanced functional connectivity were recorded for putamen and supplementary motor region18. Relatively strong positive/negative correlations were observed among MDS-UPDRS part III scores and connectivity to cortical regions in a non-bilateral manner, consistent with the asymmetric motor symptoms typically seen in early PD19. Interestingly, negative correlation was found among putamen subregion-SGM structures on the same side of brain while positive correlations were found for contralateral parts (Figure 5) suggesting weakening of intra-SGM connectivity within hemisphere and strengthening of it across hemispheres with gradual increase of MDS-UPDRS part III scores, and thereby, the motor impairment in PD. Higher number of subjects should be assessed in future, with more quantitative measures, to further explore and validate these findings.
Acknowledgements
Data used in the preparation of this article were obtained from the Parkinson’s Progression Markers Initiative (PPMI) database (www.ppmi-info.org/access-dataspecimens/download-data), RRID:SCR 006431. For up-to-date information on the study, visit www.ppmi-info.org.
References
1. Ghandili M, Munakomi S. Neuroanatomy, Putamen. In: ; 2023.
2. Sigirli D, Ozdemir ST, Erer S, et al. Statistical shape analysis of putamen in early-onset Parkinson’s disease. Clin Neurol Neurosurg. 2021;209(May):106936. doi:10.1016/j.clineuro.2021.106936
3. Shen B, Pan Y, Jiang X, et al. Altered putamen and cerebellum connectivity among different subtypes of Parkinson’s disease. CNS Neurosci Ther. 2020;26(2):207-214. doi:10.1111/cns.13259
4. Kinoshita K, Kuge T, Hara Y, Mekata K. Putamen Atrophy Is a Possible Clinical Evaluation Index for Parkinson’s Disease Using Human Brain Magnetic Resonance Imaging. J Imaging. 2022;8(11). doi:10.3390/jimaging8110299
5. Ali T, Lv J, Dalton M, Kassem S, D’souza A, Calamante F. In-vivo parcellation of human subcortex by diffusion and anatomical MRI. In: ISMRM 2023. ; 2023:3628.
6. Martínez-Martín P, Rodríguez-Blázquez C, Alvarez M, et al. Parkinson’s disease severity levels and MDS-Unified Parkinson’s Disease Rating Scale. Park Relat Disord. 2015;21(1):50-54. doi:10.1016/j.parkreldis.2014.10.026
7. Marek K, Jennings D, Lasch S, et al. The Parkinson Progression Marker Initiative (PPMI). Prog Neurobiol. 2011;95(4):629-635. doi:10.1016/j.pneurobio.2011.09.005
8. Ali TS, Lv J, Calamante F. Gradual changes in microarchitectural properties of cortex and juxtacortical white matter: Observed by anatomical and diffusion MRI. Magn Reson Med. 2022;(June):1-20. doi:10.1002/mrm.29413
9. Lv J, Zeng R, Ho MP, D’Souza A, Calamante F. Building a Tissue-unbiased Brain Template of Fibre Orientation Distribution and Tractography with Multimodal Registration. Magn Reson Med. 2022;1(14). https://www.biorxiv.org/content/10.1101/2022.04.13.488117v1%0Ahttps://www.biorxiv.org/content/10.1101/2022.04.13.488117v1.abstract
10. Desikan RS, Ségonne F, Fischl B, et al. An automated labeling system for subdividing the human cerebral cortex on MRI scans into gyral based regions of interest. Neuroimage. 2006;31(3):968-980. doi:10.1016/j.neuroimage.2006.01.021
11. Fischl B. FreeSurfer. Neuroimage. 2012;62(2):774-781. doi:10.1016/j.neuroimage.2012.01.021
12. Smith RE, Tournier JD, Calamante F, Connelly A. SIFT2: Enabling dense quantitative assessment of brain white matter connectivity using streamlines tractography. Neuroimage. 2015;119:338-351. doi:10.1016/j.neuroimage.2015.06.092
13. Mai JK, Majtanik M, Paxinos G. Atlas of the Human Brain. Academic Press; 2015.
14. Mehlman ML, Winter SS, Taube JS. Functional and anatomical relationships between the medial precentral cortex, dorsal striatum, and head direction cell circuitry. II. Neuroanatomical studies. J Neurophysiol. 2019;121(2):371-395. doi:10.1152/jn.00144.2018
15. Schira MM, Isherwood ZJ, Kassem MS, et al. HumanBrainAtlas: an in vivo MRI dataset for detailed segmentations. Brain Struct Funct. 2023;(0123456789). doi:10.1007/s00429-023-02653-8
16. Hanganu A, Houde JC, Fonov VS, et al. White matter degeneration profile in the cognitive cortico-subcortical tracts in Parkinson’s disease. Mov Disord. 2018;33(7):1139-1150. doi:10.1002/mds.27364
17. Sharman M, Valabregue R, Perlbarg V, et al. Parkinson’s disease patients show reduced cortical-subcortical sensorimotor connectivity. Mov Disord. 2013;28(4):447-454. doi:10.1002/mds.25255
18. Yu R, Liu B, Wang L, Chen J, Liu X. Enhanced Functional Connectivity between Putamen and Supplementary Motor Area in Parkinson’s Disease Patients. PLoS One. 2013;8(3). doi:10.1371/journal.pone.0059717
19. Claassen DO, McDonell KE, Donahue M, et al. Cortical asymmetry in Parkinson’s disease: early susceptibility of the left hemisphere. Brain Behav. 2016;6(12):1-10. doi:10.1002/brb3.573
Figures