2353
Alzheimer's brain and control brain show distinct ultrashort echo time magnetization transfer ratio (UTE-MTR): an ex vivo study1Department of Radiology, University of California, San Diego, CA, United States, 2Department of Radiology, The First Affiliated Hospital of Chongqing Medical University, Chongqing, China, 3Department of Pathology, University of California, San Diego, La Jolla, San Diego, CA, United States, 4Radiology Service, VA San Diego Healthcare System, La Jolla, CA, United States, 5Department of Bioengineering, University of California, San Diego, La Jolla, CA, United States
Synopsis
Keywords: Alzheimer's Disease, Alzheimer's Disease, ultrashort echo time magnetization transfer ratio; in vivo
Motivation: Alzheimer’s disease is a degenerative brain disorder. Conventional MRI primarily focuses on quantifying the volume of the hippocampus and gray matter (GM).
Goal(s): This study employed ultrashort echo time magnetization transfer ratio (UTE-MTR) mapping to identify myelin changes in white matter (WM) and grey matter (GM) within brain samples from AD and regular donors.
Approach: Six ROIs were selected for each specimen, comprising three WM regions and three GM regions.
Results: The UTE-MTR values of both WM and GM from AD donors were lower than those of controls, indicating the capability of UTE-MTR to detect myelin loss in individuals with AD.
Impact: Decreased UTE-MTR values of WM and GM were found in AD brains compared to control brains, indicating myelin loss in AD brain regions. This biomarker provides valuable assistance for the diagnosis of AD.
Body of the Abstract
IntroductionAlzheimer's disease (AD) is a neurodegenerative disorder characterized by progressive cognitive decline that typically manifests in advanced age and occasionally even before1,2. The affected regions of the brain tissue, sequentially, include the hippocampus3,4, white matter (WM)5,6, and cortical gray matter (GM)7,8. Although conventional MRI techniques have demonstrated very high sensitivity for the detection of lesions in WM in general9,10, there is still a lack of robust methods that allow detecting lesions located in GM and cortical areas. In addition, direct imaging of myelin is difficult due to its ultrashort T2 (T2<1 ms). Ultrashort echo time (UTE) MRI sequences can be used to directly detect signals from myelin protons11-13; thus, they could enable a more specific evaluation of changes in myelin that occur in AD myelin. UTE magnetization transfer ratio (UTE-MTR) has been proposed for quantitative evaluation of short-T2 tissues such as cortical bone and myelin14-16. In this study, we aim to compare UTE-MTR in WM and GM of AD vs. control brain specimens.
Methods
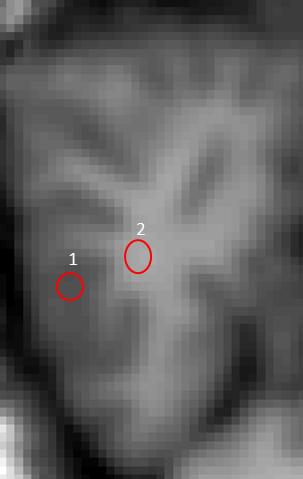
Brain specimens from 10 donors with pathologically confirmed AD and 5 healthy controls were scanned with an 8-channel phased-array head coil on a 3T MRI system (MR 750, GE Healthcare Technologies, Milwaukee, WI, USA). Brain samples from the left frontal lobe were chosen for this study. The brain samples from both groups were quantitatively assessed for UTE-MTR values. MTR was measured using a 3D UTE MT sequence with and without MT preparation. The imaging parameters included: MT power = 1500°; frequency offset = 5 kHz; flip angle = 25°; 5 spokes per MT preparation, TR/TE= 176/0.032 ms, readout bandwidth = 125 kHz, field of view (FOV) = 18×18×17 cm3, acquisition matrix = 128×128×68, slice thickness 2.5 mm, voxel size= 1.41×1.41×2.5 mm3, scan time = 18 min. Six regions of interest (ROI) were selected for each specimen, including three regions of subcortical WM and three regions of cortical GW. Figure 1 shows representative ROIs in cortical GM and subcortical white matter, away from the boundary to mitigate partial volume effects. Post measurement, the consistency of UTE-MTR values between the two analyzers was compared. Independent samples two-tailed t-test was used to compare UTE-MTR values of GM and WM between the two groups.
Results
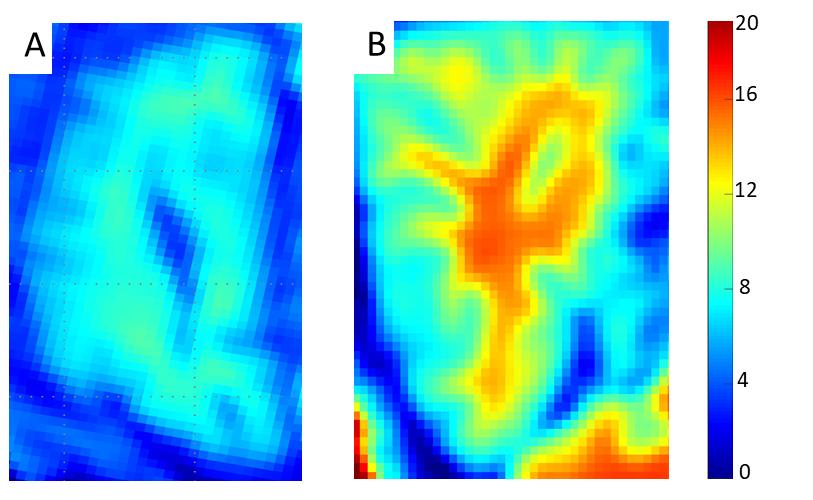
Figure 2 shows representative UTE-MTR color maps of an AD brain and a control brain without known neurological diseases. Lower UTE-MTR values were observed for the AD brain compared to the control brain in both WM and GM regions. Also, higher UTE-MTR values were observed in WM regions, consistent with higher myelin density in WM than in GM.
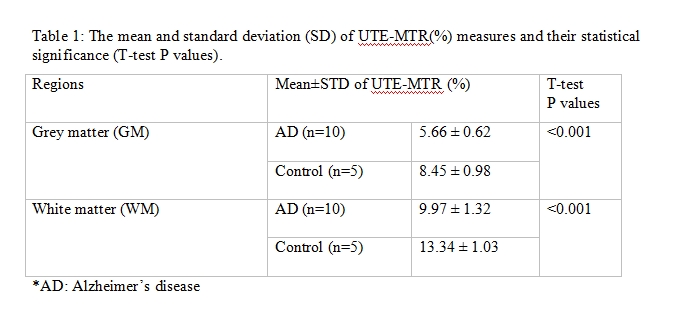
The UTE-MTR values of the WM and the cortical GM measured by two analyzers in both groups showed good agreement (ICC = 0.88, P < 0.01 for WM and ICC = 0.91, P < 0.01 for cortical GM). Table 1 summarizes the average UTE-MTR values of subcortical WM and cortical GM in 10 AD brain specimens and 5 control brain specimens. The AD brains show significantly lower UTE-MTR values for both WM (9.97±1.32 vs. 13.34±1.03; P < 0.001) and GM (5.66±0.62 vs. 8.45±0.98 ; P < 0.001) as compared to controls, suggesting that AD is associated with whole brain myelin loss.
Discussion
UTE has been shown to have great advantages for direct imaging of lipids and myelin11-13. The MTR is commonly employed as an indicator that reflects the macromolecular content, leveraging the interaction between free water protons and those bound to macromolecules. The combination of UTE acquisition with MT preparation allows quantitative UTE-MTR mapping by directly detecting signal changes from myelin. In the cuprizone mouse model of multiple sclerosis (MS), the UTE-MTR values of cortical and subcortical GM in the central nervous system (CNS) were significantly correlated with histological myelination content16. Both AD and MS are neurodegenerative disorders. AD is characterized by typical clinical symptoms and conventional MRI often manifests normal-appearing white and gray matter regions, leading to a discrepancy between the clinical presentation and imaging findings. The UTE-MT technique was employed in this study to measure UTE-MTR values in the subcortical WM and cortical GM in brain samples from AD donors and healthy controls. The results revealed significantly lower UTE-MTR values in AD brains compared to the control group, indicating loss of myelin in these regions.
Conclusion
Our results indicate lower UTE-MTR values in WM and cortical GM of AD brain specimens, suggesting that AD is associated with systematic myelin loss.
Acknowledgements
The authors acknowledge grant support from the National Institutes of Health (RF1AG075717), and VA Research and Development Services (Merit Awards I01CX001388).
References
1. Scheltens P, De Strooper B, Kivipelto M, et al. Alzheimer's disease. Lancet. 2021;397(10284):1577-1590.
2. Graff-Radford J, Yong KXX, Apostolova LG, et al. New insights into atypical Alzheimer's disease in the era of biomarkers. Lancet Neurol. 2021;20(3):222-234.
3. Jaroudi W, Garami J, Garrido S, et al. Factors underlying cognitive decline in old age diseasee hippocampus. Rev Neurosci. 2017;28(7):705-714.
4. Choi H, Choi Y, Lee EJ, et al. Hippocampal glucose uptake as a surrogate of metabolic change of microglia in Alzheimer's disease. J Neuroinflammation. 2021;18(1):190.
5. Nasrabady SE, Rizvi B, Goldman JE, et al. White matter changes in Alzheimer's disease: a focus on myelin and oligodendrocytes. Acta Neuropathol Commun. 2018;6(1):22.
6. Lam S, Lipton RB, Harvey DJ, et al. Alzheimer's disease neuroimaging initiative. white matter hyperintensities and cognition across different Alzheimer's biomarker profiles. J Am Geriatr Soc. 2021;69(7):1906-1915.
7. Krajcovicova L, Klobusiakova P, Rektorova I. Gray matter changes in Parkinson's and Alzheimer's disease and relation to cognition. Curr Neurol Neurosci Rep. 2019;19(11):85.
8. Thijssen EH, La Joie R, Wolf A, et al. Diagnostic value of plasma phosphorylated tau181 in Alzheimer's disease and frontotemporal lobar degeneration. Nat Med. 2020;26(3):387-397.
9. Filippi M, Rocca MA. MR imaging of multiple sclerosis. Radiology. 2011;259(3):659-681.
10. Traboulsee A, Simon JH, Stone L, et al. Revised Recommendations of the Consortium of MS Centers Task Force for a Standardized MRI Protocol and Clinical Guidelines for the Diagnosis and Follow-Up of Multiple Sclerosis. AJNR Am J Neuroradiol. 2016;37(3):394-401.
11. Waldman A, Rees JH, Brock CS, Robson MD, Gatehouse PD, Bydder GM. MRI of the brain with ultra-short echo time pulse sequences. Neuroradiology 2003; 45:887-892.
12. Wilhelm MJ, Ong HH, Wehrli SL, Li C, Tsai PH, Hackney DB, Wehrli FW. Direct magnetic resonance detection of myelin and prospects for quantitative imaging of myelin density. Proc Natl Acad Sci USA 2012; 109:9605-9610.
13. Sheth V, Shao H, Chen J, VandenBerg S, Corey-Bloom J, Bydder GM, Du J. Magnetic resonance imaging of myelin using ultrashort echo time (UTE) pulse sequence: phantom, specimen, volunteers and multiple sclerosis patient studies. NeuroImage 2016; 136:37-44.
14. Springer F, Martirosian P, Machann J, Schwenzer NF, Claussen CD, Schick F. Magnetization transfer contrast imaging in bovine and human cortical bone applying an ultrashort echo time sequence at 3 Tesla. Magn Reson Med 2009; 61:1040-1048.
15. Chang EY, Bae WC, Shao H, et al. Ultrashort echo time magnetization transfer (UTE-MT) imaging of cortical bone. NMR Biomed 2015; 28:873-880.
16. Guglielmetti C, Boucneau T, Cao P, et al. Longitudinal evaluation of demyelinated lesions in a multiple sclerosis model using ultrashort echo time magnetization transfer (UTE-MT) imaging. Neuroimage. 2020;208:116415.
Figures