2350
Substantia Nigra and Nigrosome1 identification in Parkinson’s disease and healthy controls: comparison of manual and automated approach at 3T1Neuroscience Research Center, Department of Medical and Surgical Sciences, Università degli Studi Magna Graecia di Catanzaro, Catanzaro, Italy, 2Institute for Advanced Biomedical Technologies, Department of Neurosciences, Imaging, and Clinical Sciences, University G. D’Annunzio of Chieti-Pescara, Chieti, Italy, 3Institute of Neurology, Università degli Studi Magna Graecia di Catanzaro, Catanzaro, Italy, 4Cardiff University Brain Research Imaging Centre (CUBRIC), Department of Psychology, Cardiff University, Cardiff, United Kingdom
Synopsis
Keywords: Parkinson's Disease, Quantitative Susceptibility mapping
Motivation: Quantification of iron overload in relevant brain regions is crucial for Parkinson’s disease (PD) diagnosis and monitoring.
Goal(s): To evaluate and compare manual and automated approaches for substantia nigra (SN) and nigrosome1 (N1) identification and iron content assessment using quantitative susceptibility mapping (QSM)
Approach: Histogram analysis to assess distributions of iron content in SN and N1, and compare them in patients with PD and controls
Results: Histogram analysis of automatically defined SN regions of interest in PD can be a promising tool to complement current diagnostic procedures. Nigrosome1 identification is confirmed to be more challengeing, and should be carefully checked by expert raters.
Impact: Lean and accurate quantification of iron overload in Substantia Nigra and Nigrosome1 in parkinsonian patients could represent an added value to routine clinical evaluation, enhancing accuracy of early diagnosis, possibly in pre-morbid conditions, as well as optimal treatment monitoring
Introduction
Quantitative Susceptibility Mapping (QSM) in Substantia Nigra (SN) and Nigrosome1 (N1) is of great interest for diagnosis and monitoring of Parkinson’s disease (PD)1,2. However, accurate identification of these structures in patients at 3T is critical, due to their pathological appearance as well as to limitations of routine-clinical-practice acquisition schemes. In this study, we evaluated the distribution of QSM values in SN and N1 in healthy subjects and patients with PD, to assess iron overload driven by neurodegeneration, by using two different identification approaches, automated versus manual, to determine their accuracy and their potential integration in routine clinical practice.Methods
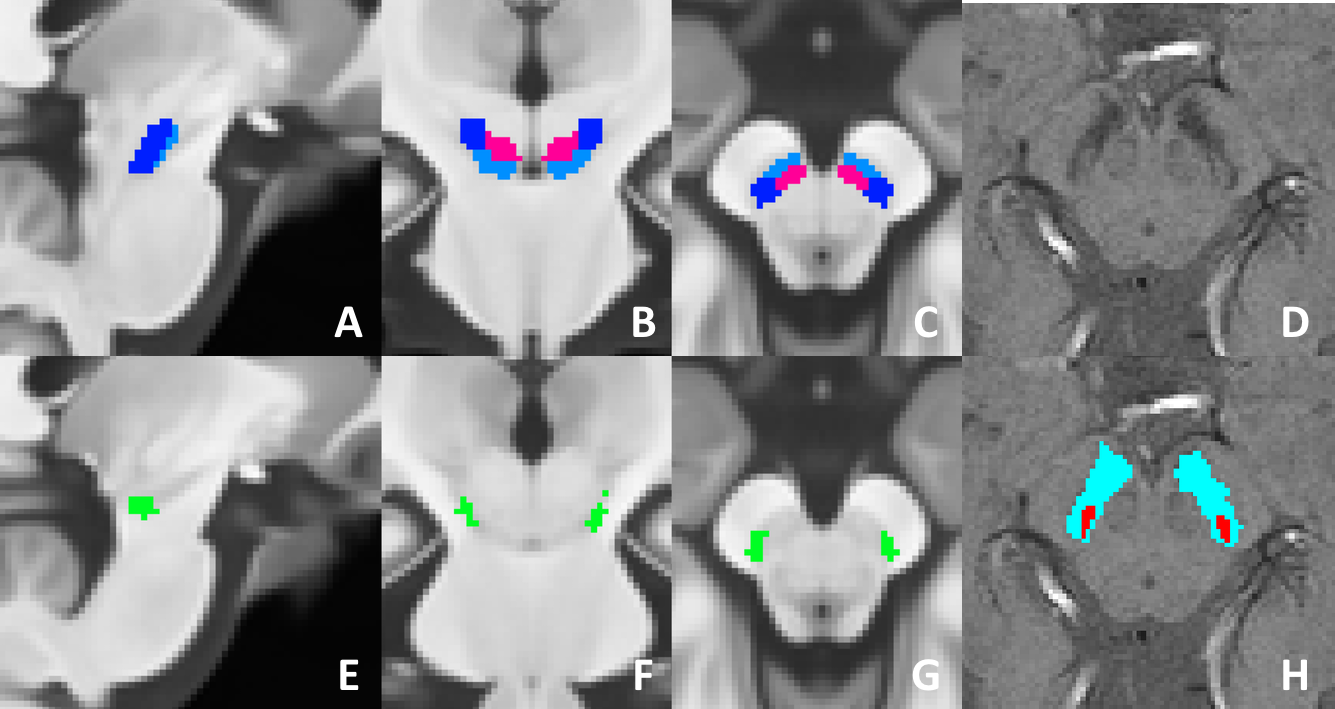
Sixteen patients with PD (10M/6F, mean age 65.4 ± 9.7y) and 16 age- and sex-matched healthy controls underwent 3T brain MRI (Biograph mMR, Siemens Healthcare, Erlangen, Germany) using a 16-channel PET-transparent head/neck coil. The protocol comprised i) three-dimensional T1-weighted magnetization-prepared rapid acquisition gradient-echo sequence (MPRAGE, 176 sagittal planes, FOV 256 × 247 mm2, voxel size 1 × 1 × 1 mm3, TR/TE/TI=2300/2.34/900 ms, flip angle 8°, TA = 5:12); ii) T2-FLAIR (160 sagittal planes, FOV 242 x 227 mm2, voxel size 0.5 x 0.5 x 1.0 mm3, TR/TE/TI=5000/367/1600 ms, TA = 5:27); iii) susceptibility weighted imaging (SWI, 56 transverse planes centered on the midbrain, FOV 220 x 213 mm2, voxel size 0.7 × 0.7 × 1.2 mm3, TR=50 ms, 5 TEs=5.88/13.62/21.62/29.62/37.96 ms, TA = 6:23). Bilateral SN and, when visible, N1 were manually segmented on SWI images. Quantitative susceptibility mapping (QSM) was estimated as following: phase unwrapping was performed on SWI data using ROMEO3; then, a brain mask was calculated from the 5th-TE magnitude image using FSL BET4 and background fields were removed from the B0 map calculated by ROMEO using VSHARP5; finally, local field-to-magnetic susceptibility inversion was performed using Tikhonov regularisation and L-curve optimisation6. Histograms of regional χ values (parts per billion, ppb) were calculated using FSL and Matlab 2018b, and distributions were compared between healthy subjects and PD patients. Regional χ values were extracted from the regions of interest following two approaches, as shown in Figure 1: a) using the manually segmented masks of each individual subject (Figure 1, panels D and H), and b) coregistering a publicly available symmetric template of SN pars compacta (SNpc), subdivided into three functional territories (i.e., associative, sensorimotor, limbic; Figure 1, panels A-B-C) and a study-specific N1 probability map, calculated using the same script that generated the SN template, thresholded and binarized at 0.25 (Figure 1, panels E-F-G)1,7.Results
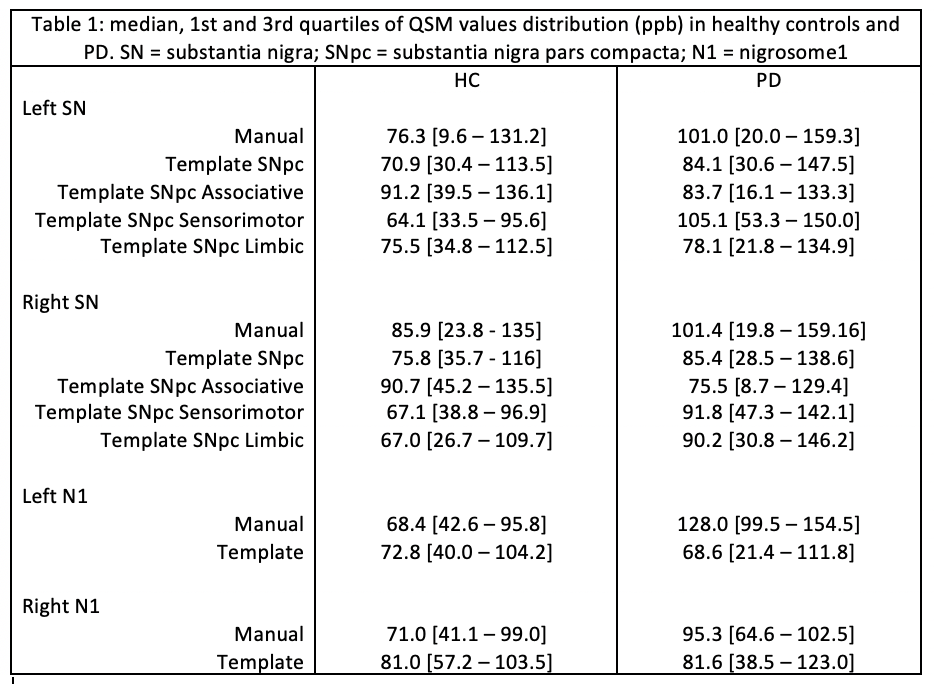
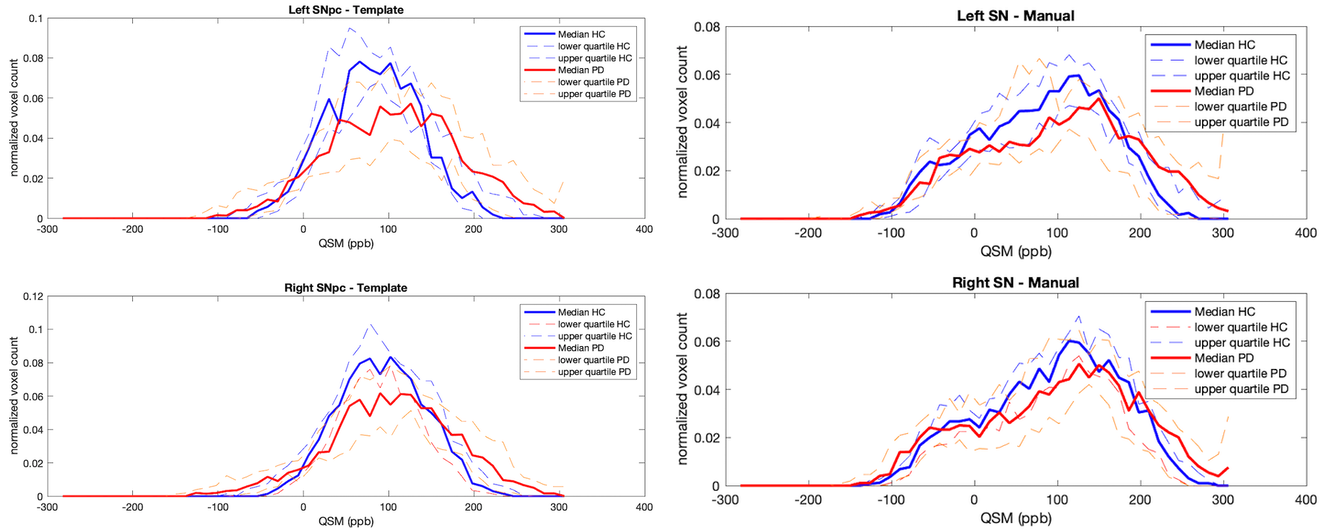
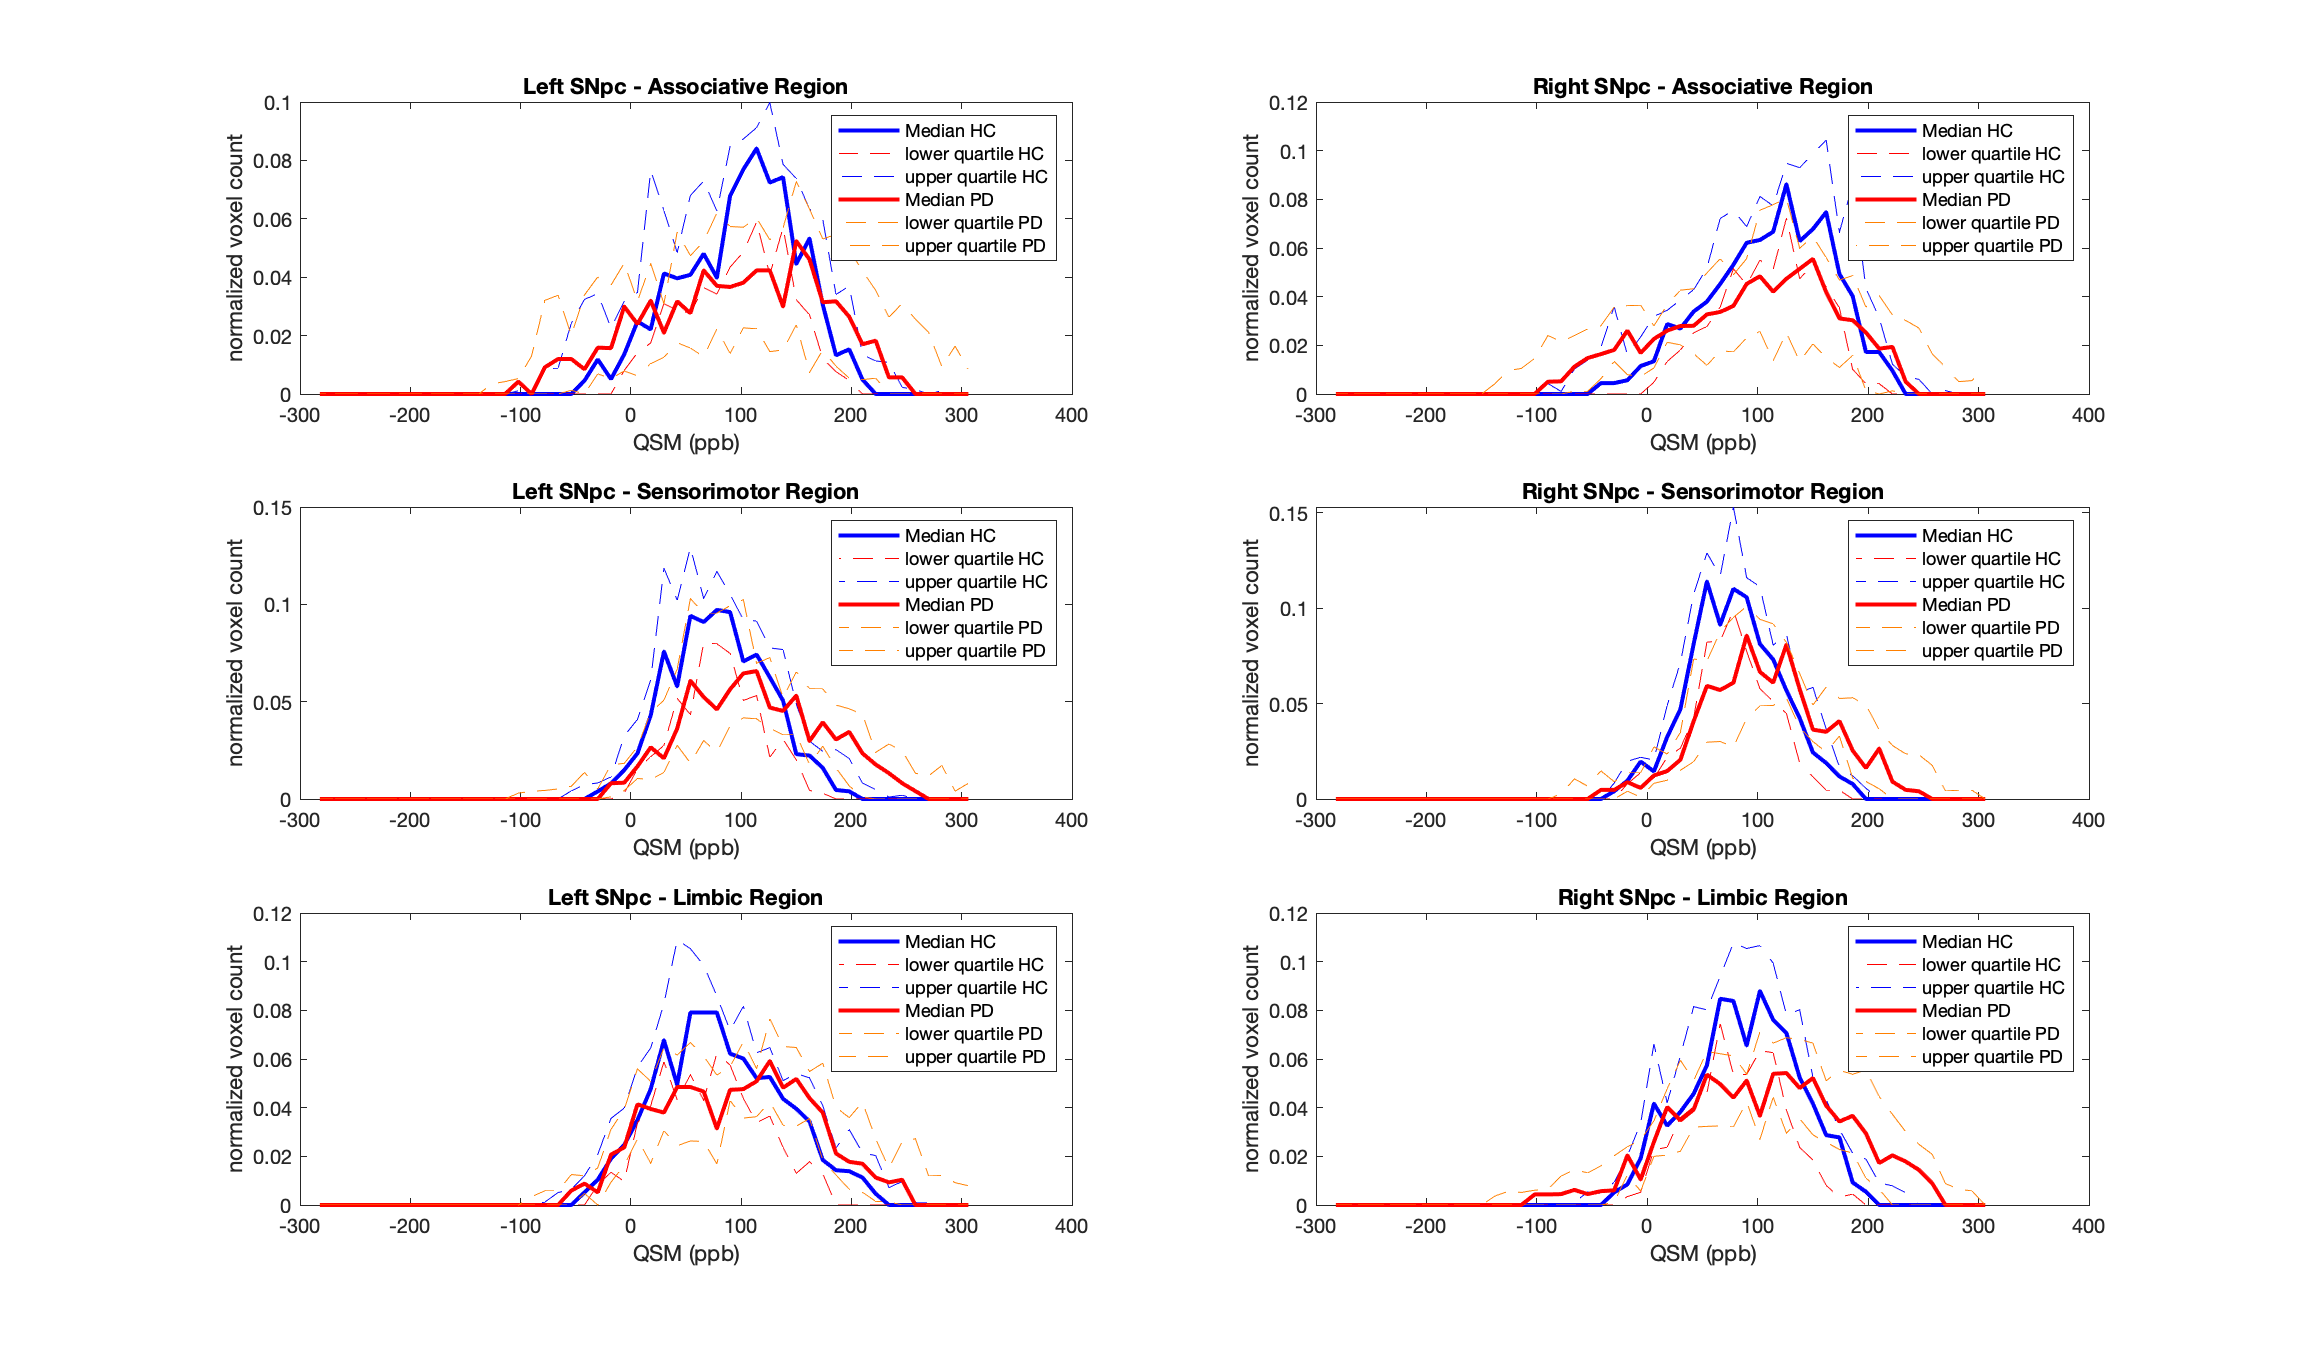
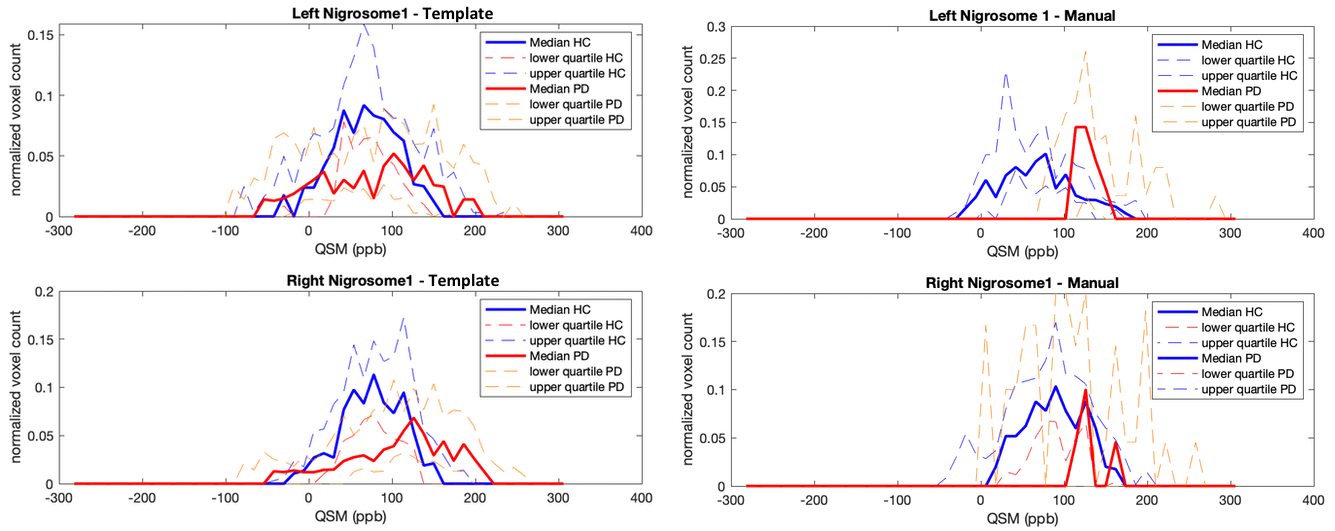
Manual segmentations of SN were obtained in all subjects, whereas N1 was visible bilaterally in all healthy controls, on the left side in 7 PD patients and on the right side in 4 PD patients. A comparison of QSM χ distributions extracted with the two different approaches is shown in Figure 2. In PD patients, nigral χ were shifted towards higher values compared to healthy controls, in all regions of interest and with both methods of identification. When considering subdivisions, the sensorimotor region of SNpc was characterized by the largest difference between group distributions (Figure 3 and Table 1). On the other hand, smaller differences were observed in N1 χ values between patients and controls when using the common region of interest, while a clear shift towards higher values was observed when using individual segmentations.Discussion
Overall, these results support the feasibility of using an atlas-based approach to identify SNpc and its subdivisions, as well as N1, in healthy subjects and patients with PD using a hybrid 3T PET/MR scanner. Of note, compared to manual approaches on SWI qualitative scans, the use of a template built upon neuromelanin-based segmentations of the SN allows a more accurate identification of the pars compacta, with concurrent exclusion of the pars reticulata, which has different susceptibility properties and may influence the spread of χ distributions. Indeed, distributions of values in all automatically-identified SN regions were similar to those obtained using manual segmentation, which is more time-consuming and cumbersome. Instead, group differences were smaller when using a nigrosome template on all subjects: this could be partly explained by the fact that this analysis included all patients – with and without a visible N1 – limiting the accuracy of region positioning, compared to manual delineation.Acknowledgements
Work supported by
- #NEXTGENERATIONEU (NGEU) and funded by the Ministry of University and Research (MUR), National Recovery and Resilience Plan (NRRP), project MNESYS (PE0000006) – A Multiscale integrated approach to the study of the nervous system in health and disease (DN. 1553 11.10.2022)
- Italian Ministry of University and Research, Research Projects of National Relevance (PRIN), Project Code: 2022BERM2F, Project Title: “Mapping Mitochondrial Function and Oxygen Metabolism in the Human Brain with Magnetic Resonance Imaging.” Concession decree No. 1065 of 18. 07.2023 adopted by the Italian Ministry of University and Research, ERC Sector LS7 “Prevention, Diagnosis and Treatment of Human Diseases”.
References
1) Biondetti, E., Santin, M.D., Valabrègue, R., Mangone, G., Gaurav, R., Pyatigorskaya, N., Hutchison, M., Yahia-Cherif, L., Villain, N., Habert, M.-O., Arnulf, I., Leu-Semenescu, S., Dodet, P., Vila, M., Corvol, J.-C., Vidailhet, M., Lehéricy, S., 2021. The spatiotemporal changes in dopamine, neuromelanin and iron characterizing Parkinson’s disease. Brain 144, 3114–3125. https://doi.org/10.1093/brain/awab191
2) Lancione, M., Donatelli, G., Del Prete, E., Campese, N., Frosini, D., Cencini, M., ... & Cosottini, M. (2022). Evaluation of iron overload in nigrosome 1 via quantitative susceptibility mapping as a progression biomarker in prodromal stages of synucleinopathies. NeuroImage, 260, 119454.
3) Dymerska, B., Eckstein, K., Bachrata, B., Siow, B., Trattnig, S., Shmueli, K., & Robinson, S. D. (2021). Phase unwrapping with a rapid opensource minimum spanning tree algorithm (ROMEO). Magnetic Resonance in Medicine, 85(4), 2294–2308. https://doi.org/10.1002/mrm.28563
4) Smith, S. M. (2002). Fast robust automated brain extraction. Human Brain Mapping, 17(3), 143–155. https://doi.org/10.1002/hbm.10062
5) Li, W., Wu, B., & Liu, C. (2011). Quantitative susceptibility mapping of human brain reflects spatial variation in tissue composition. NeuroImage, 55(4), 1645–1656. https://doi.org/10.1016/j.neuroimage.2010.11.088
6) Kressler, B., De Rochefort, L., Liu, T., Spincemaille, P., Jiang, Q., & Wang, Y. (2010). Nonlinear regularization for per voxel estimation of magnetic susceptibility distributions from MRI field maps. IEEE Transactions on Medical Imaging, 29(2), 273–281. https://doi.org/10.1109/TMI.2009.2023787
7) Biondetti, E., Gaurav, R., Yahia-Cherif, L., Mangone, G., Pyatigorskaya, N., Valabrègue, R., Ewenczyk, C., Hutchison, M., François, C., Arnulf, I., Corvol, J.C., Vidailhet, M., Lehéricy, S., 2020. Spatiotemporal changes in substantia nigra neuromelanin content in Parkinson’s disease. Brain 143, 2757–2770. https://doi.org/10.1093/brain/awaa216
Figures