2347
Regional high iron deposition on quantitative susceptibility mapping correlates with cognitive impairment in patients with hemodialysis1the First Affiliated Hospital of Dalian Medical University, Dalian, China
Synopsis
Keywords: Gray Matter, Neurodegeneration
Motivation: Patients with chronic kidney disease (CKD) often have brain iron overload and with cognitive impairment, so it is important to control clinical iron overload.
Goal(s): To evaluate the changes of gray matter nucleus iron deposition in CKD patients, and analyze the correlation between iron deposition and cognitive function.
Approach: Recruit CKD patients undergoing hemodialysis, non-hemodialysis patients and healthy controls. The magnetic susceptibility value of gray matter nuclei was measured by quantitative susceptibility mapping (QSM) and compare QSM data and cognitive scores among three groups.
Results: Brain iron deposition is increased in CKD patients, especially in hemodialysis patients, and is related to cognitive function.
Impact: Compared with full-structure analysis, regional analysis seems to be more sensitive to related changes. In addition, CKD patients were divided into groups to explore not only the effect of CKD on brain iron deposition, but also the role of hemodialysis.
Introduction
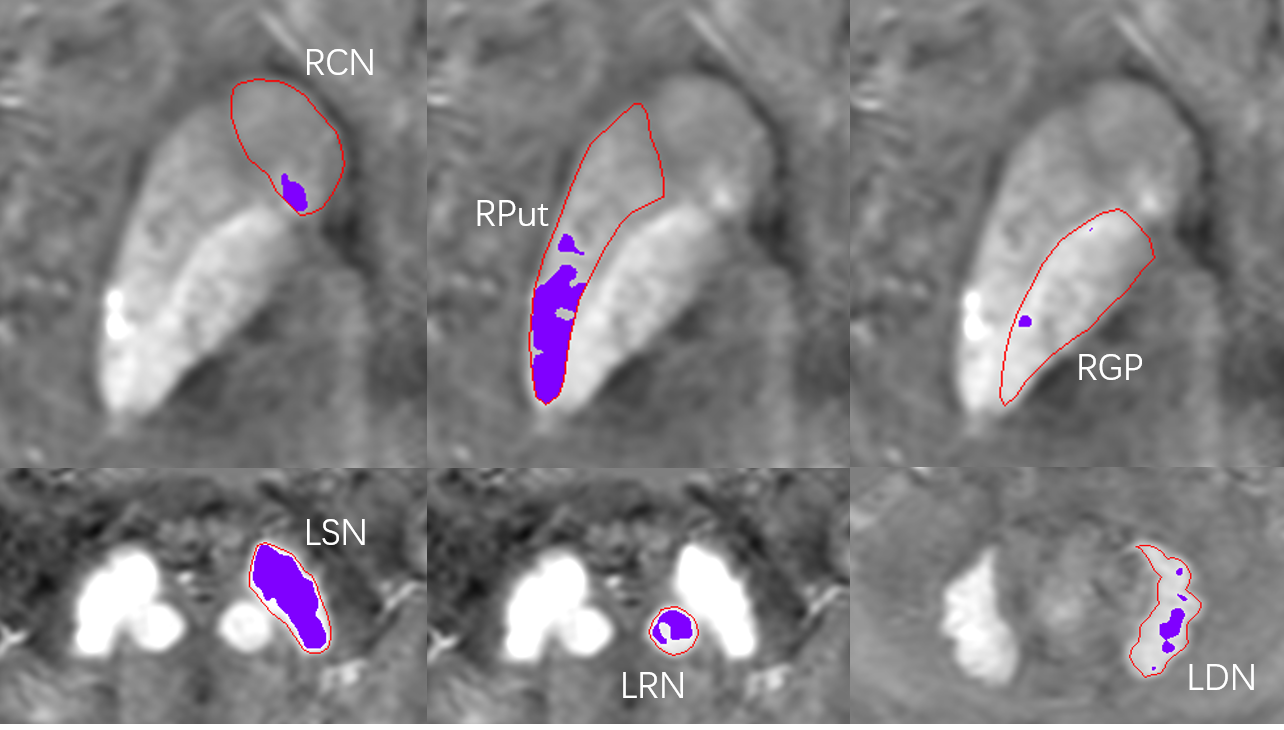
To evaluate the changes of subcortical gray matter nucleus volume and iron deposition in patients with end-stage renal disease undergoing hemodialysis (HD) by quantitative susceptibility mapping (QSM) threshold method, and to analyze the correlation between gray matter nucleus iron deposition and cognitive function.Methods
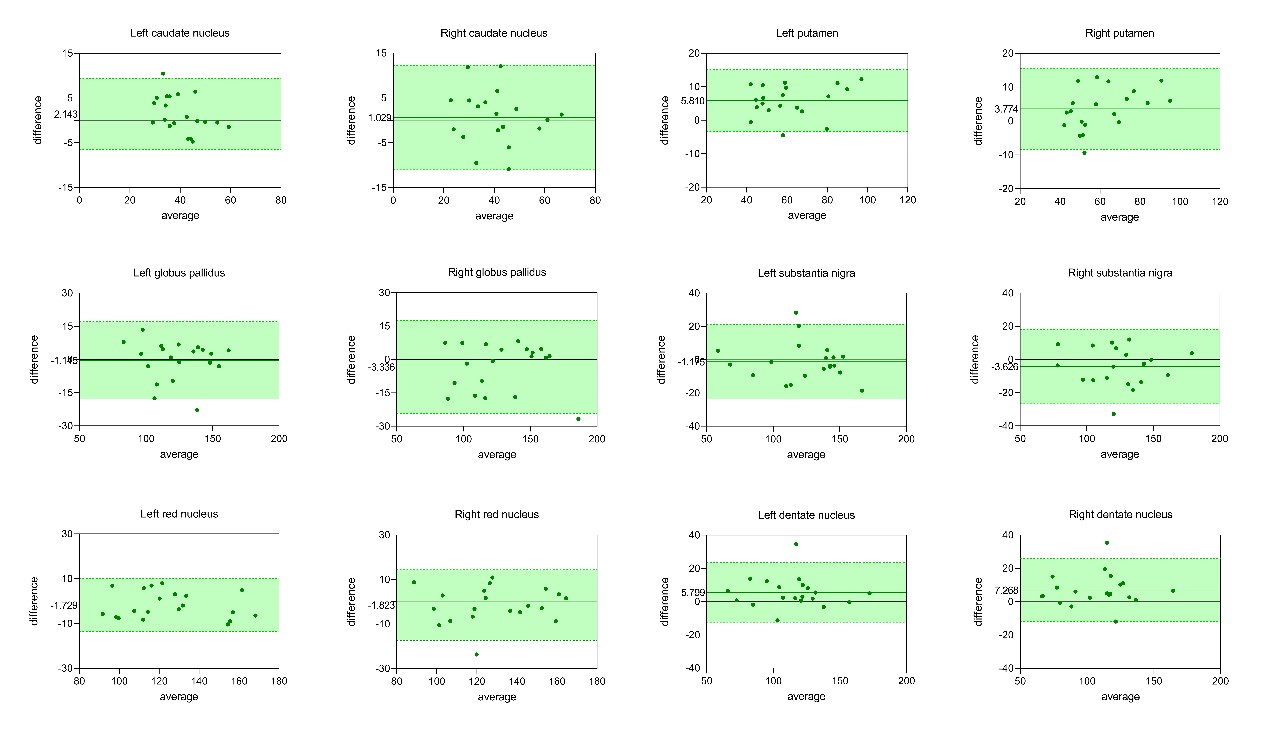
Thirty-five CKD patients undergoing HD, 18 non-HD (NHD) CKD patients and 43 healthy controls (HCs) were prospectively recruited. The neuropsychological scale scores and clinical indexes among the three groups were analyzed by one-way analysis of variance. The mean magnetic susceptibility values and volumes (MSVM, VM), regional high iron values and volumes (MSVRII, VRII) of bilateral caudate nucleus (CN), putamen (Put), globus pallidus (GP), substantia nigra (SN), red nucleus (RN) and dentate nucleus (DN) were measured manually by QSM. All QSM data were compared by multivariate analysis of covariance among groups, and age, sex and years of education were covariates. The correlation between MSVRII with the score of neuropsychological scale and laboratory index was analyzed. A statistically significant P-value was set at 0.05.Results
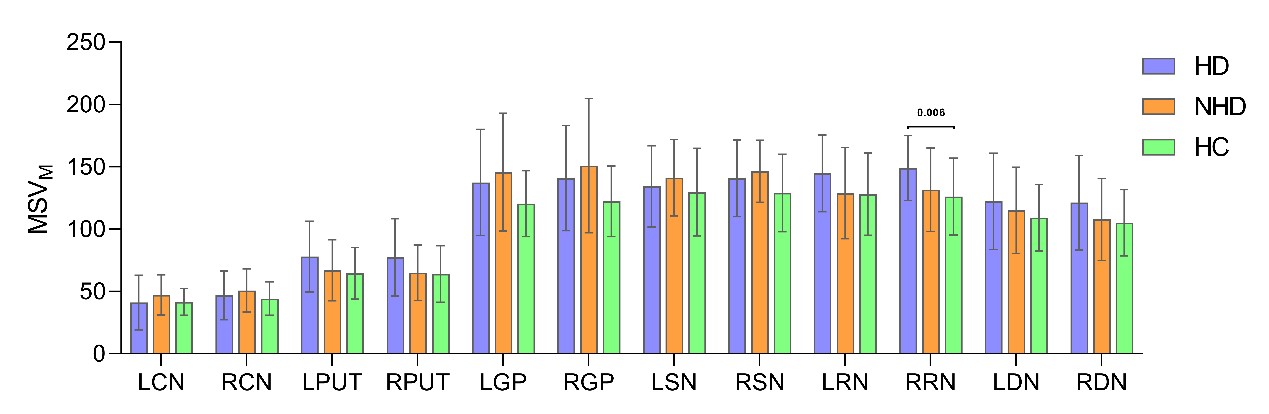
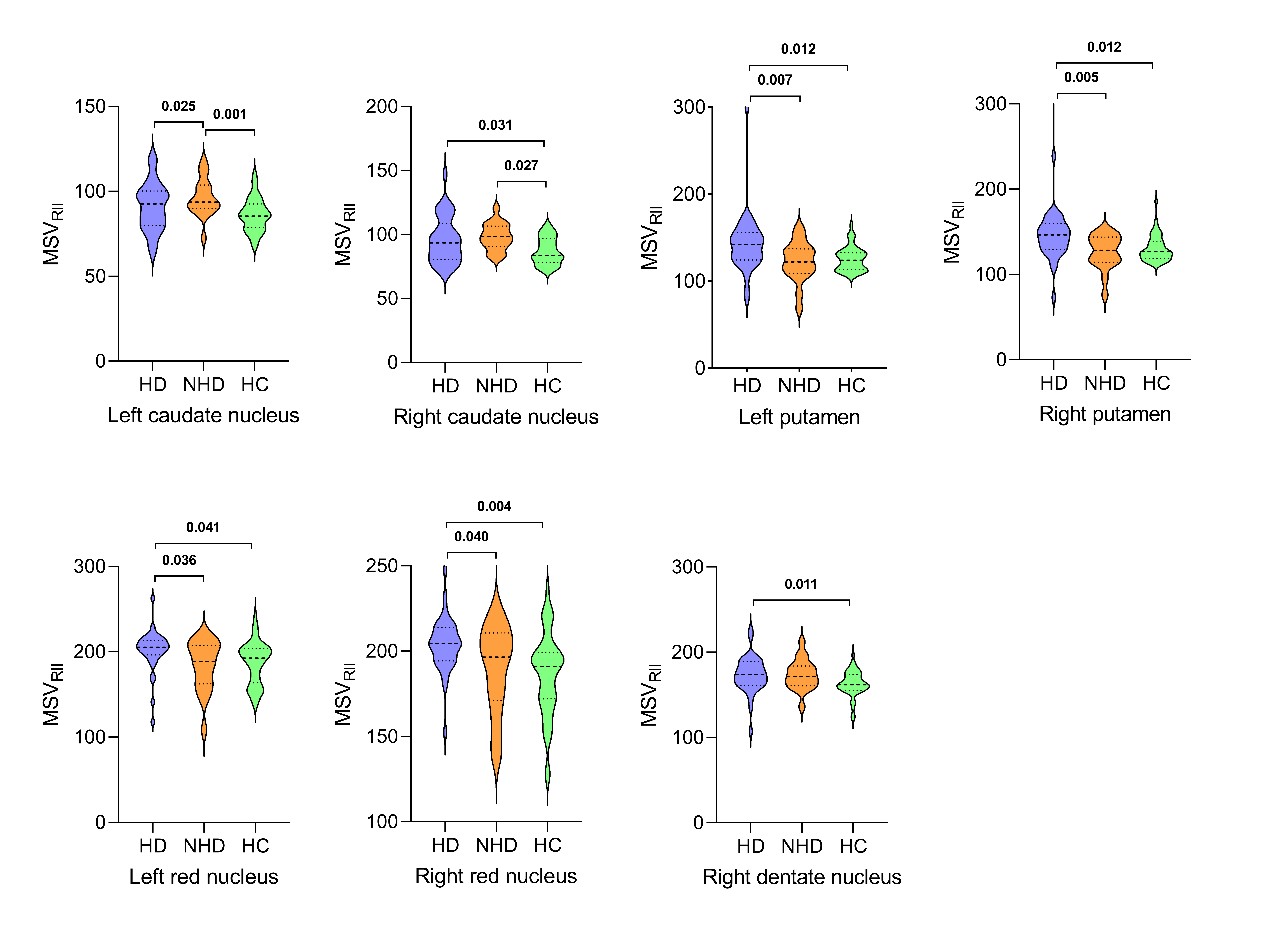
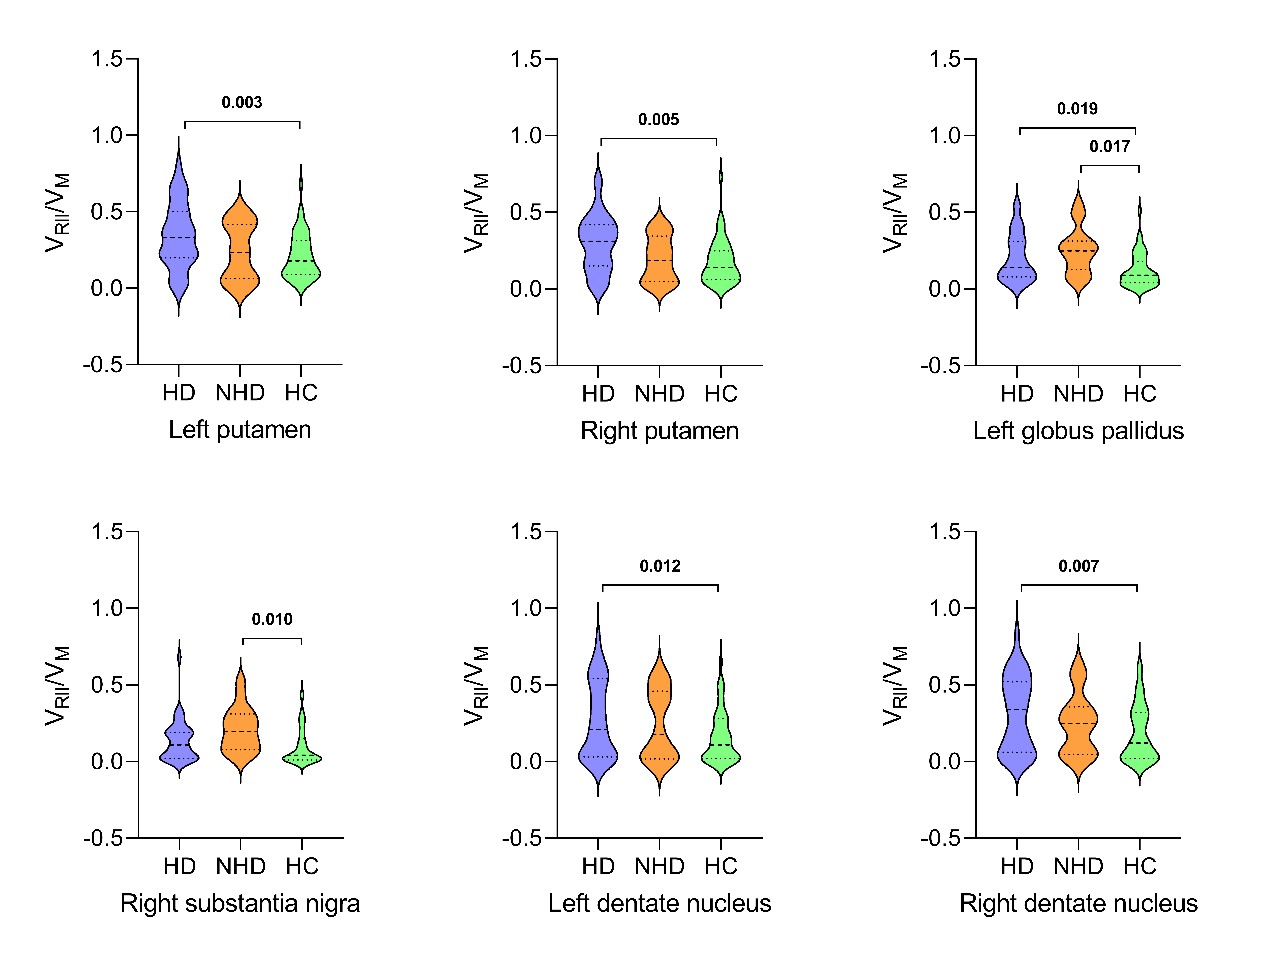
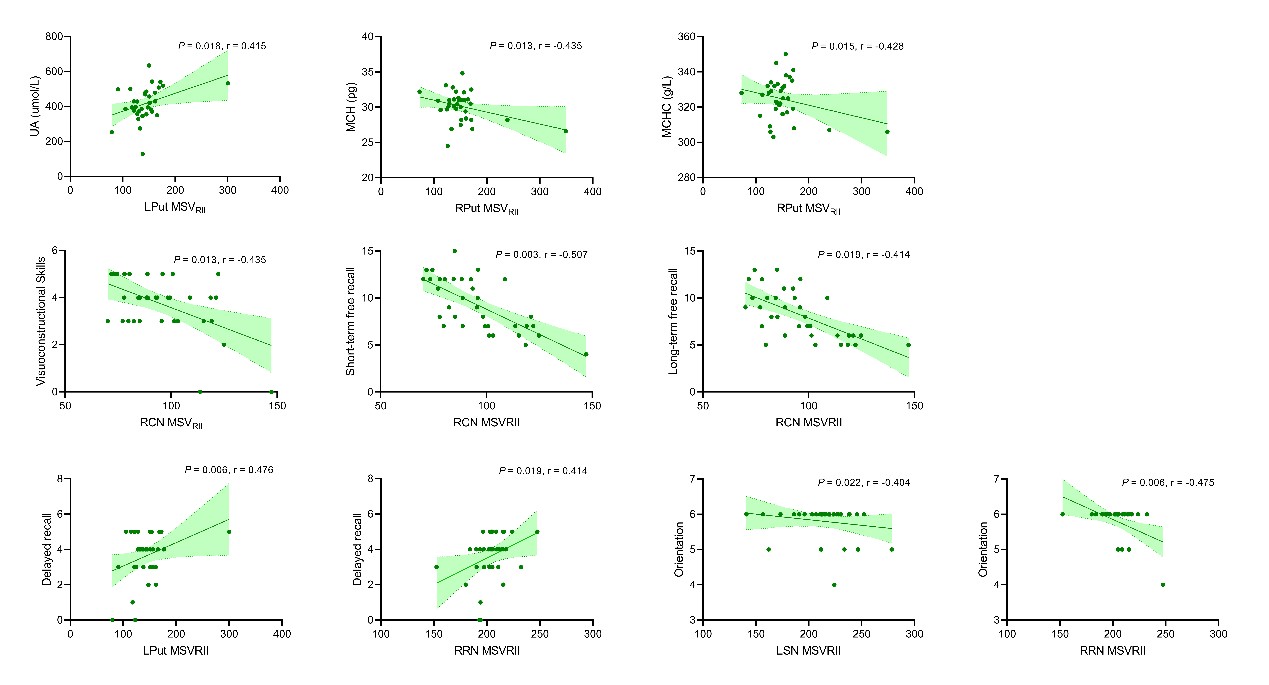
Compared with the HCs, the MSVM of right RN increased significantly in HD patients. In addition, the MSVRII of right CN, bilateral Put, bilateral RN and right DN in HD patients was significantly higher than that in HCs; the MSVRII of bilateral CN in NHD patients was significantly higher than that in HCs; and the MSVRII of left CN, bilateral Put and bilateral RN in HD patients was significantly higher than that in NHD patients. The VRII/VM of bilateral Put, left GP and bilateral DN in HD patients was significantly larger than that of HCs, and VRII/VM of left GP and right SN in NHD patients was significantly larger than HCs. Partial correlation analysis showed that in HD group, MSVRII of left Put was positively correlated with UA, while MSVRII of right Put was negatively correlated with MCH and MCHC. Besides, MSVRII of left CN was negatively correlated with HAMD score; MSVRII of right CN was negatively correlated with visuospatial/executive function, short-term free recall and long-term free recall scores, while positively correlated with TMT-B completion time; MSVRII of left Put, left SN and right RN was positively correlated with delayed recall score and negatively correlated with orientation score; MSVRII of right Put was negatively correlated with orientation score; and MSVRII of right DN was negatively correlated with score of HAMA and HAMD.Discussion
Our study showed that compared with HCs, there was abnormal iron deposition in right RN in HD patients. In addition, we used QSM threshold method to compare the iron content in the high-iron deposition area in the deep gray matter nuclei of HD patients, NHD patients and HCs. The results showed that there were also significant differences in MSVRII of bilateral CN, bilateral Put, bilateral RN and right DN. It is more sensitive than the mean MSV analysis, which indicates that the increase of iron deposition in the extrapyramidal system of CKD patients was significantly heterogeneous. Post-hoc analyses showed that compared with NHD patients, the MSVRII of bilateral Put and bilateral RN increased significantly in HD patients, indicating that hemodialysis can aggravate the iron deposition in brain tissue. And the analysis of high iron area showed that the relative volume of high iron area in the left GP and right SN in NHD patients was significantly larger than that in HCs, while the relative volume in bilateral Put and bilateral DN in HD patients was significantly larger than that in HCs, which further indicated that the iron deposition in the gray matter nuclei was increased and unevenly distributed in patients with CKD, and hemodialysis may enlarge the iron deposition areas in bilateral Put and bilateral DN. Partial correlation analysis showed that the higher levels of UA, the more iron deposition in the left Put, and the lower levels of MCH and MCHC, the more iron deposition in the right Put. After excluding the influence of age, sex and years of education, we found that the MSVRII of left CN and right DN was related to anxiety and depression, the MSVRII of left Put and bilateral RN was positively correlated with delayed recall, and the MSVRII of right CN, bilateral Put and bilateral RN was related to cognitive and memory impairment.Conclusion
In patients with CKD, the iron deposition in the deep gray matter nucleus is excessive and uneven, especially in hemodialysis patients. The regions high-iron deposition can better assess the distribution of iron, which is related to the decline of cognitive and memory function, as well as anxiety emotion.Acknowledgements
No acknowledgement found.References
[1] Luo Y, Murray AM, Guo YD, Tian R, Ye PP, Li X, Li GG, Lu FP, Ma YC, Sun Y, Wang YZ, Xiao YF, Zhang QM, Zhao XF, Zhao HD, Chen XM. Cognitive impairment and associated risk factors in older adult hemodialysis patients: a cross-sectional survey. Sci Rep. 2020 Jul 27;10(1):12542. doi: 10.1038/s41598-020-69482-1.
[2] Chai C, Yan S, Chu Z, Wang T, Wang L, Zhang M, Zuo C, Haacke EM, Xia S, Shen W. Quantitative measurement of brain iron deposition in patients with haemodialysis using susceptibility mapping. Metab Brain Dis. 2015 Apr;30(2):563-71. doi: 10.1007/s11011-014-9608-2.
[3] Vinayagamani S, Sheelakumari R, Sabarish S, Senthilvelan S, Ros R, Thomas B, Kesavadas C. Quantitative Susceptibility Mapping: Technical Considerations and Clinical Applications in Neuroimaging. J Magn Reson Imaging. 2021 Jan;53(1):23-37. doi: 10.1002/jmri.27058.
[4] Liu M, Liu S, Ghassaban K, Zheng W, Dicicco D, Miao Y, Habib C, Jazmati T, Haacke EM. Assessing global and regional iron content in deep gray matter as a function of age using susceptibility mapping. J Magn Reson Imaging. 2016 Jul;44(1):59-71. doi: 10.1002/jmri.25130.
[5] Ghassaban K, He N, Sethi SK, Huang P, Chen S, Yan F, Haacke EM. Regional High Iron in the Substantia Nigra Differentiates Parkinson's Disease Patients From Healthy Controls. Front Aging Neurosci. 2019 May 27;11:106. doi: 10.3389/fnagi.2019.00106.
Figures