2345
Structural and Functional Deterioration along the Visual Pathways in Glaucoma Patients1Department of Ophthalmology, New York University Grossman School of Medicine, New York, NY, United States, 2Department of Biomedical Engineering, Tandon School of Engineering, New York University, New York, NY, United States, 3Wills Eye Hospital, Philadelphia, PA, United States, 4Sidney Kimmel Medical College of Thomas Jefferson University, Philadelphia, PA, United States, 5Department of Biomedical Engineering, Drexel University, Philadelphia, PA, United States, 6Department of Radiology, New York University Grossman School of Medicine, New York, NY, United States
Synopsis
Keywords: Other Neurodegeneration, Neurodegeneration, Glaucoma
Motivation: Glaucoma is a neurodegenerative, multi-faceted disease resulting in irreversible blindness. Previous studies demonstrated both ocular and cerebral involvement, but brain findings remained mixed from small studies.
Goal(s): To elucidate structural and functional brain changes associated with glaucoma using big data.
Approach: We compared UK Biobank's extensive multi-parametric brain MRI data, ophthalmic parameters, and physiometabolic data between 1,229 glaucoma subjects and 12,290 age- and gender-matched healthy subjects.
Results: In addition to clinical ophthalmic and physiometabolic differences, smaller brain volumes and lower fractional anisotropy were found along the posterior visual pathway of glaucoma patients, with weakened functional brain activation upon Hariri faces/shapes task.
Impact: Changes in both the structure and function of the posterior visual brain pathways point to trans-synaptic degeneration in glaucoma. Additionally, glaucoma may impair both the lower-level visual processing areas and the structural and functional aspects of higher-level visual processing regions.
INTRODUCTION
Glaucoma is a neurodegenerative disease of the visual system and is the leading cause of irreversible blindness worldwide. Recent studies suggest that glaucoma exerts a dual impact on both ocular and cerebral domains1,2. However, the brain findings remain mixed, partly due to small samples and different severity across neuroimaging studies. In this study, we leveraged the large data repository of the UK Biobank, encompassing multi-parametric brain magnetic resonance imaging (MRI) datasets of T1-weighted structural MRI, diffusion-weighted MRI (dMRI), and task-evoked functional MRI (fMRI) to better understand the structural and functional brain changes in glaucoma.METHODS
We used the UK Biobank to select brain MRI-scanned participants aged 40 to 80 without significant non-glaucomatous eye problems including diabetes related eye diseases, loss of vision secondary to trauma, macular degeneration, or other serious eye diseases, and excluded those with neurological conditions including extrapyramidal disorders, and degenerative, demyelinating, and inflammatory diseases of the nervous system. Glaucoma subjects were further defined as participants with ICD-10 codes H40-42 for glaucoma or self-reported eye issues related to glaucoma, whereas healthy subjects were further defined as individuals with no ICD-10 diagnosis of glaucoma and no self-reported history of glaucoma.Using the above criteria, we identified 1,229 glaucoma subjects [654 male, mean age: 59.6±0.18 years old (mean±SEM)] and matched them with 30,000 healthy controls with brain MRI scans. We used greedy matching in R Studio to minimize potential biases related to age and gender. This produced a balanced dataset of 12,290 healthy subjects (6623 male, mean age:59.5±0.05 years old). We then extracted volumetry from T1-weighted structural MRI (Category 110), mean fractional anisotropy (FA) from diffusion-weighted MRI (Category 107), and blood-oxygenation-level-dependent (BOLD) fMRI data from the Hariri faces/shapes "emotion" task (Category 106) from the UK Biobank. Retinal layer thicknesses from optical coherence tomography of the eye (Category 100079), standard polygenic risk scores (PRS) for primary open-angle glaucoma (POAG) (Data Field 26265), visual acuity (Data Field 5208 and 5209) and physiometabolic data (Category 100078) were also drawn from the UK Biobank and compared between glaucoma and healthy groups using unpaired t-tests. The percentage differences between glaucoma and healthy cohorts were also calculated.
RESULTS
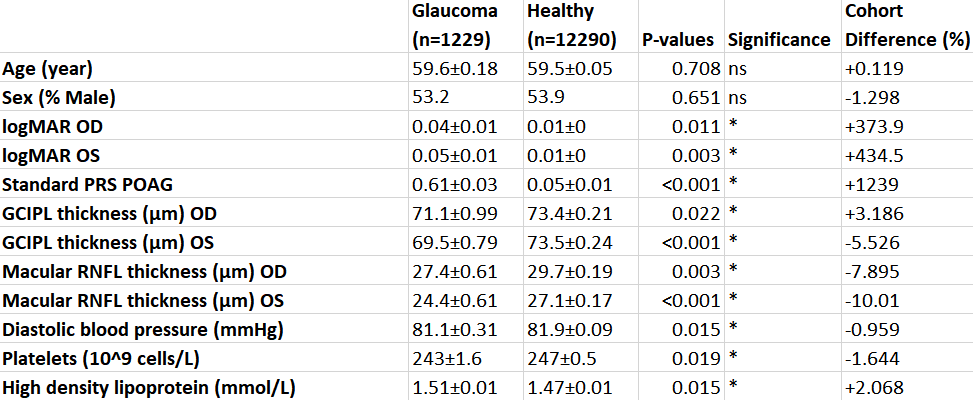
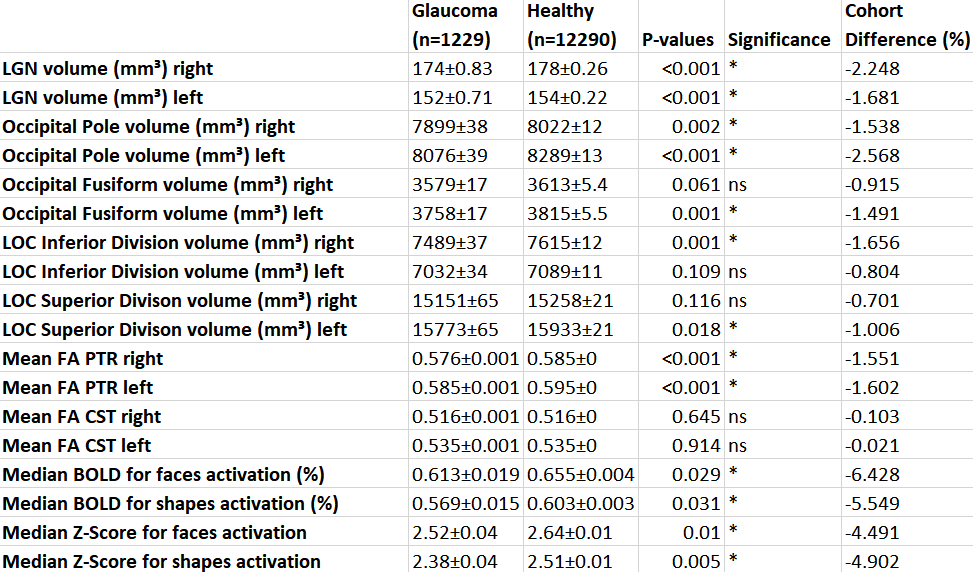
As shown in Table 1, glaucoma subjects showed significant thinness in the macular inner retinal layers along the anterior visual pathway, as well as worse visual acuity and higher polygenic risk scores as compared to healthy subjects. Furthermore, physiometabolic data indicated significantly lower platelet count, lower diastolic blood pressure, and higher high-density lipoprotein (HDL) cholesterol levels in glaucoma subjects than healthy controls.As shown in Table 2, along the posterior visual pathway, the lateral geniculate nuclei (LGN) of glaucoma subjects were significantly smaller than those in healthy subjects in both hemispheres. The visual cortex also exhibited smaller volumes in both lower-order (occipital pole) and sub-regions of higher-order areas (occipital fusiform; lateral occipital cortex (LOC)) in glaucoma subjects than healthy subjects. Between the LGN and the visual cortex, the posterior thalamic radiation containing the optic radiation (OR) had a significantly lower fractional anisotropy (FA) in glaucoma subjects than healthy subjects in both hemispheres. Such group FA differences were not observed in the corticospinal tract (CST), indicative of the specificity to the visual pathway. Task-based fMRI revealed significantly weaker face- and shape-related brain activation in glaucoma patients and healthy subjects. These structural and functional brain differences were generally smaller than the clinical ophthalmic differences.
CONCLUSION
The results of this study revealed multifaceted aspects of glaucoma not only in the anterior and posterior visual pathways, but also systemically from the physiometabolic measures. The structural and functional brain changes between LGN and visual cortex indicated the presence of trans-synaptic degeneration in the posterior visual pathway in addition to inner retinal degeneration in the anterior visual pathway. Glaucoma may also impair not only the lower-order visual brain areas, but also higher-order visual brain structure and function. Further studies will investigate the potential relationships between physiometabolic factors and neurodegeneration in the eye, brain, and body in glaucoma.Acknowledgements
This work is supported in part by the National Institutes of Health R01-EY028125 and R01-EY013178 (Bethesda, Maryland), and an unrestricted grant from Research to Prevent Blindness to NYU Langone Health Department of Ophthalmology (New York, New York).References
1. Murphy, M. C., Conner, I. P., Teng, C. Y., Lawrence, J. D., Safiullah, Z., Wang, B., Bilonick, R. A., Kim, S. G., Wollstein, G., Schuman, J. S., & Chan, K. C. (2016). Retinal Structures and Visual Cortex Activity are Impaired Prior to Clinical Vision Loss in Glaucoma. Scientific reports, 6, 31464 https://doi.org/10.1038/srep31464
2. Kasi A, Faiq MA, Chan KC. In vivo imaging of structural, metabolic and functional brain changes in glaucoma. Neural Regen Res. 2019 Mar;14(3):446-449. doi: 10.4103/1673-5374.243712. PMID: 30539811; PMCID: PMC6334611.
Figures