2342
Spinal cord atrophy in aging and across different neurological diseases1Deaprtment of Radiology, Beijing Tiantan Hospital, Capital Medical University, Beijing, China, 2MR Research Collaboration, Siemens Healthineers Ltd., Beijing, China
Synopsis
Keywords: Spinal Cord, Spinal Cord
Motivation: Determining the clinical significance of spinal cord changes across various neurological diseases.
Goal(s): Determining the clinical significance of spinal cord changes across various neurological diseases.
Approach: We compared the spinal cord changes across various neurological diseases, followed by analyzing the correlation of spinal cord atrophy with regional brain atrophy and corresponding clinical variables.
Results: The spinal cord atrophy happens with aging and is aggravated in neurological diseases, which partly reflects cognitive conditions and physical disability.
Impact: Identifying disease-specific patterns of spinal cord atrophy somehow helps in differential diagnosis and MUCCA could be serve as a MRI marker for cognitive impairment and/or physical disability.
Introduction
Spinal cord relays sensorimotor control signals between the cortex and the peripheral nervous system. The degree of spinal cord pathological atrophy is associated with clinical symptoms and substantial disability1–3. Structural measurements of spinal cord have been used to assess spinal atrophy severity4 and predict disability progression5. This study aims to measure and compare the spinal cord changes in healthy individuals and multiple neurological disorders diseases as well as analyze their associations with brain atrophy and the correponding clinical indicators in each disease.Methods
MRI scans and clinical data were collected from 2,162 healthy controls (HCs) and 1135 patients with neurological disorders, including 273 with multiple sclerosis (MS), 127 with neuromyelitis optica spectrum disorder (NMOSD), 189 with Alzheimer’s disease (AD), 228 with Parkinson’s disease (PD), and 318 with cerebral small vessel disease (CSVD) (Figure 1). The spinal cord parameters, such as the mean upper cervical cord area (MUCCA), anteroposterior diameter (APD), and left-to-right diameter (RLD), were obtained based on 3D T1-weighted images using Spinal Cord Toolbox (SCT). Then, the parameters were compared between each disease group and gender- and age-matched healthy controls. Finally, MUCCA was used to analyse their correlation with brain regional atrophy and clinical variables.Results
MUCCA, APD and RLD of patients in MS, NMOSD, PD and CSVD were decreased compared to matched HC except AD. The distinct patterns of spinal cord atrophy were exhibited in the different diseases (MS: [4.10% decrease for MUCCA; 1.40% decrease for APD; 3.04% decrease for RLD, P<0.05]; NMOSD: [5.04% decrease for MUCCA; 3.46% decrease for APD; 1.95% decrease for RLD, P<0.05]; PD: [6.62% decrease for MUCCA; 3.90% decrease for APD; 2.55% decrease for RLD, P<0.001]; CSVD: [2.06% decrease for MUCCA; 1.16% decrease for APD; 1.11% decrease for RLD, P<0.05]). Decreased MUCCA was mostly correlated with thalamus atrophy in MS, AQP4+ NMOSD and AD, with pallidum atrophy in PD, and with accumbens atrophy in CSVD, respectively (r=0.33, 0.29, 0.35, 0.34 and 0.27, respectively; FDR-corrected P<0.001). Moreover, decreased MUCCA was associated with worse cognitive scale score and lower Expanded Disability Status Scale (EDSS) in MS (r=0.13~0.16 for cognitive score, and r=-0.09 for EDSS, FDR corrected p<0.05) and worse cognitive scale score in NMOSD and CVSD (NMOSD: r=0.15~0.27; CVSD: r= 0.12; FDR-corrected P<0.001).Discussion and Conclusion
In this study, we investigated the differential spinal cord atrophy in healthy adults and patients with several neurological diseases. The spinal cord atrophy in these diseases were also associated with different brain regional atrophy as well as the clinical indicators, such as cognitive scores and EDSS.In conclusion, spinal cord atrophy happens in neuroinflammatory, neurodegenerative, and vascular diseases. The patterns of spinal cord atrophy vary in different diseases. MUCCA could serve as an MRI marker to predict the severity and disability in a wider range of neurological diseases.Acknowledgements
This work was supported by the Beijing Municipal Natural Science Foundation for Distinguished Young Scholars (No. JQ20035), Capital Health Development Research Project (NO. 2022-1-2042);References
1. Ciccarelli O, Cohen JA, Reingold SC, Weinshenker BG, International Conference on Spinal Cord Involvement and Imaging in Multiple Sclerosis and Neuromyelitis Optica Spectrum Disorders. Spinal cord involvement in multiple sclerosis and neuromyelitis optica spectrum disorders. Lancet Neurol. 2019;18(2):185-197. doi:10.1016/S1474-4422(18)30460-5
2. Dubey D, Pittock SJ, Krecke KN, et al. Clinical, Radiologic, and Prognostic Features of Myelitis Associated With Myelin Oligodendrocyte Glycoprotein Autoantibody. JAMA Neurol. 2019;76(3):301. doi:10.1001/jamaneurol.2018.4053
3. Mariano R, Messina S, Kumar K, Kuker W, Leite MI, Palace J. Comparison of Clinical Outcomes of Transverse Myelitis Among Adults With Myelin Oligodendrocyte Glycoprotein Antibody vs Aquaporin-4 Antibody Disease. JAMA Netw Open. 2019;2(10):e1912732. doi:10.1001/jamanetworkopen.2019.12732
4. van de Stadt SIW, van Ballegoij WJC, Labounek R, et al. Spinal cord atrophy as a measure of severity of myelopathy in adrenoleukodystrophy. J of Inher Metab Disea. 2020;43(4):852-860. doi:10.1002/jimd.12226
5. Bischof A, Papinutto N, Keshavan A, et al. Spinal Cord Atrophy Predicts Progressive Disease in Relapsing Multiple Sclerosis. Ann Neurol. 2022;91(2):268-281. doi:10.1002/ana.26281
Figures
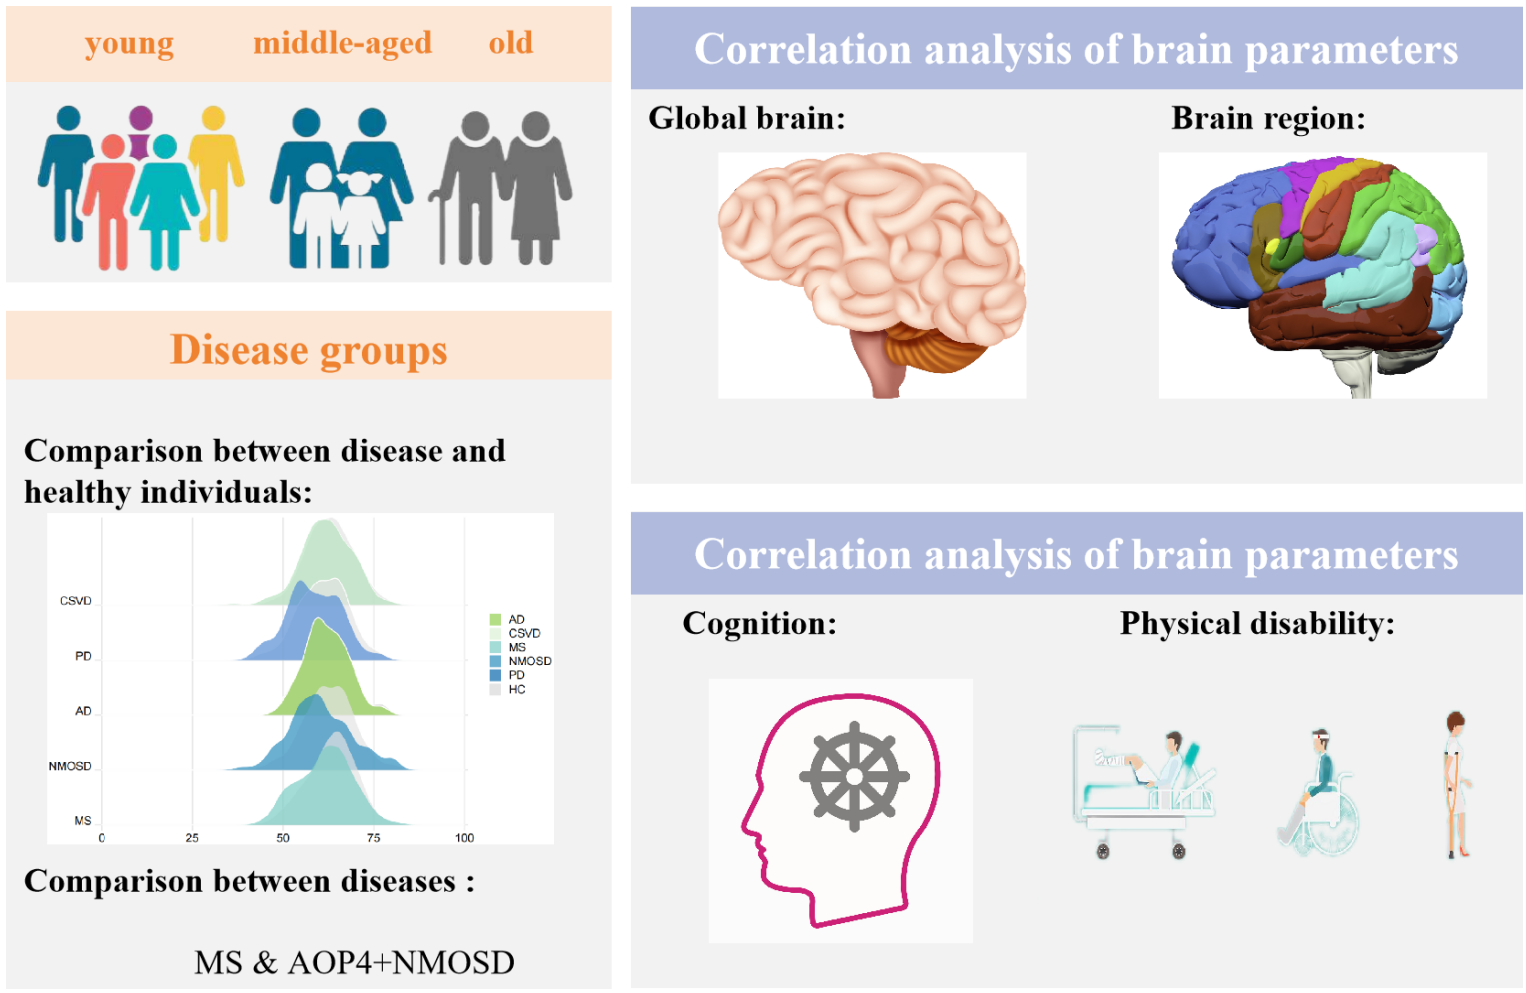
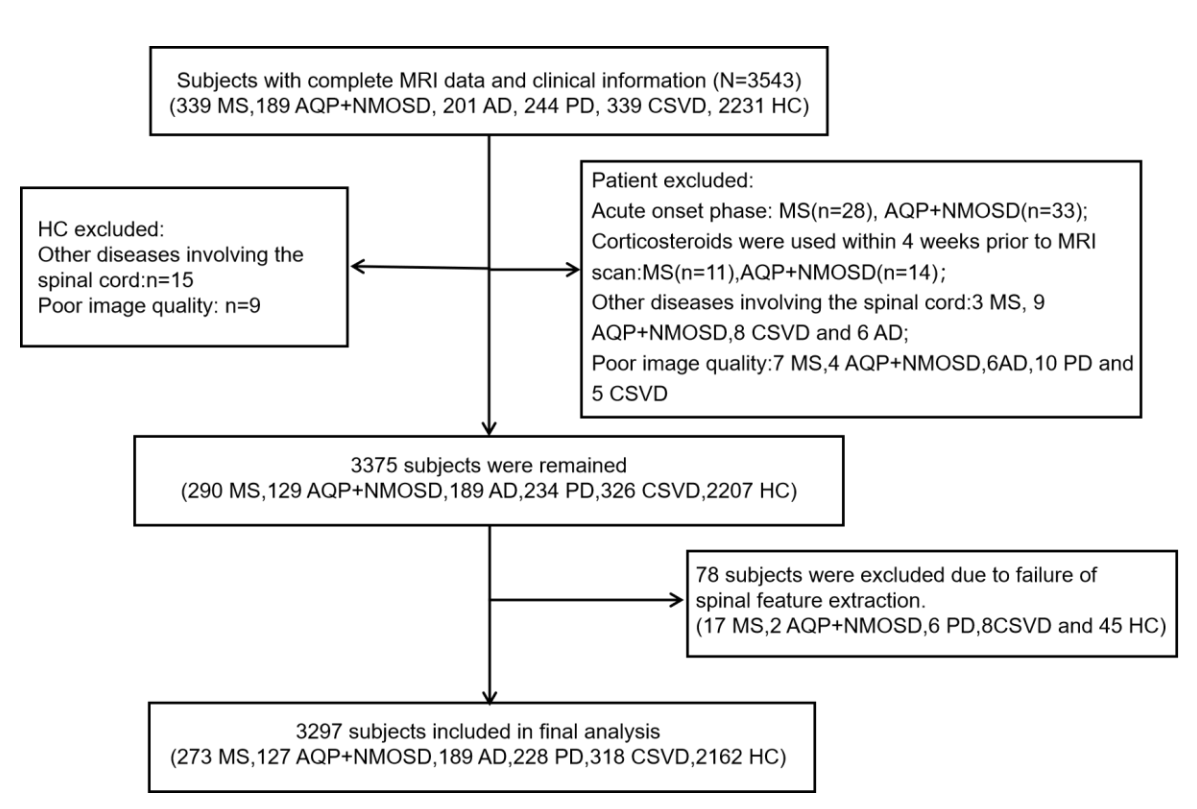
Figure 1. Study flowchart.Abbreviations: AD, Alzheimer's disease; AQP4+ NMOSD, aquaporin-4 antibody-seropositive + neuromyelitis optica spectrum disorders; CSVD, cerebral small vessel disease; MS, multiple sclerosis; PD, Parkinson's disease.

Figure 2. (A) MUCCA in MS patients, AQP4+NMOSD patients, AD patients, PD patients and CSVD patients and their matched HCs.Abbreviations: AD, Alzheimer's disease; AQP4+ NMOSD, aquaporin-4 antibody-seropositive+ neuromyelitis optica spectrum disorders; CSVD, cerebral small vessel disease; MS, multiple sclerosis; MUCCA, mean upper cervical cord area; PD, Parkinson's disease.
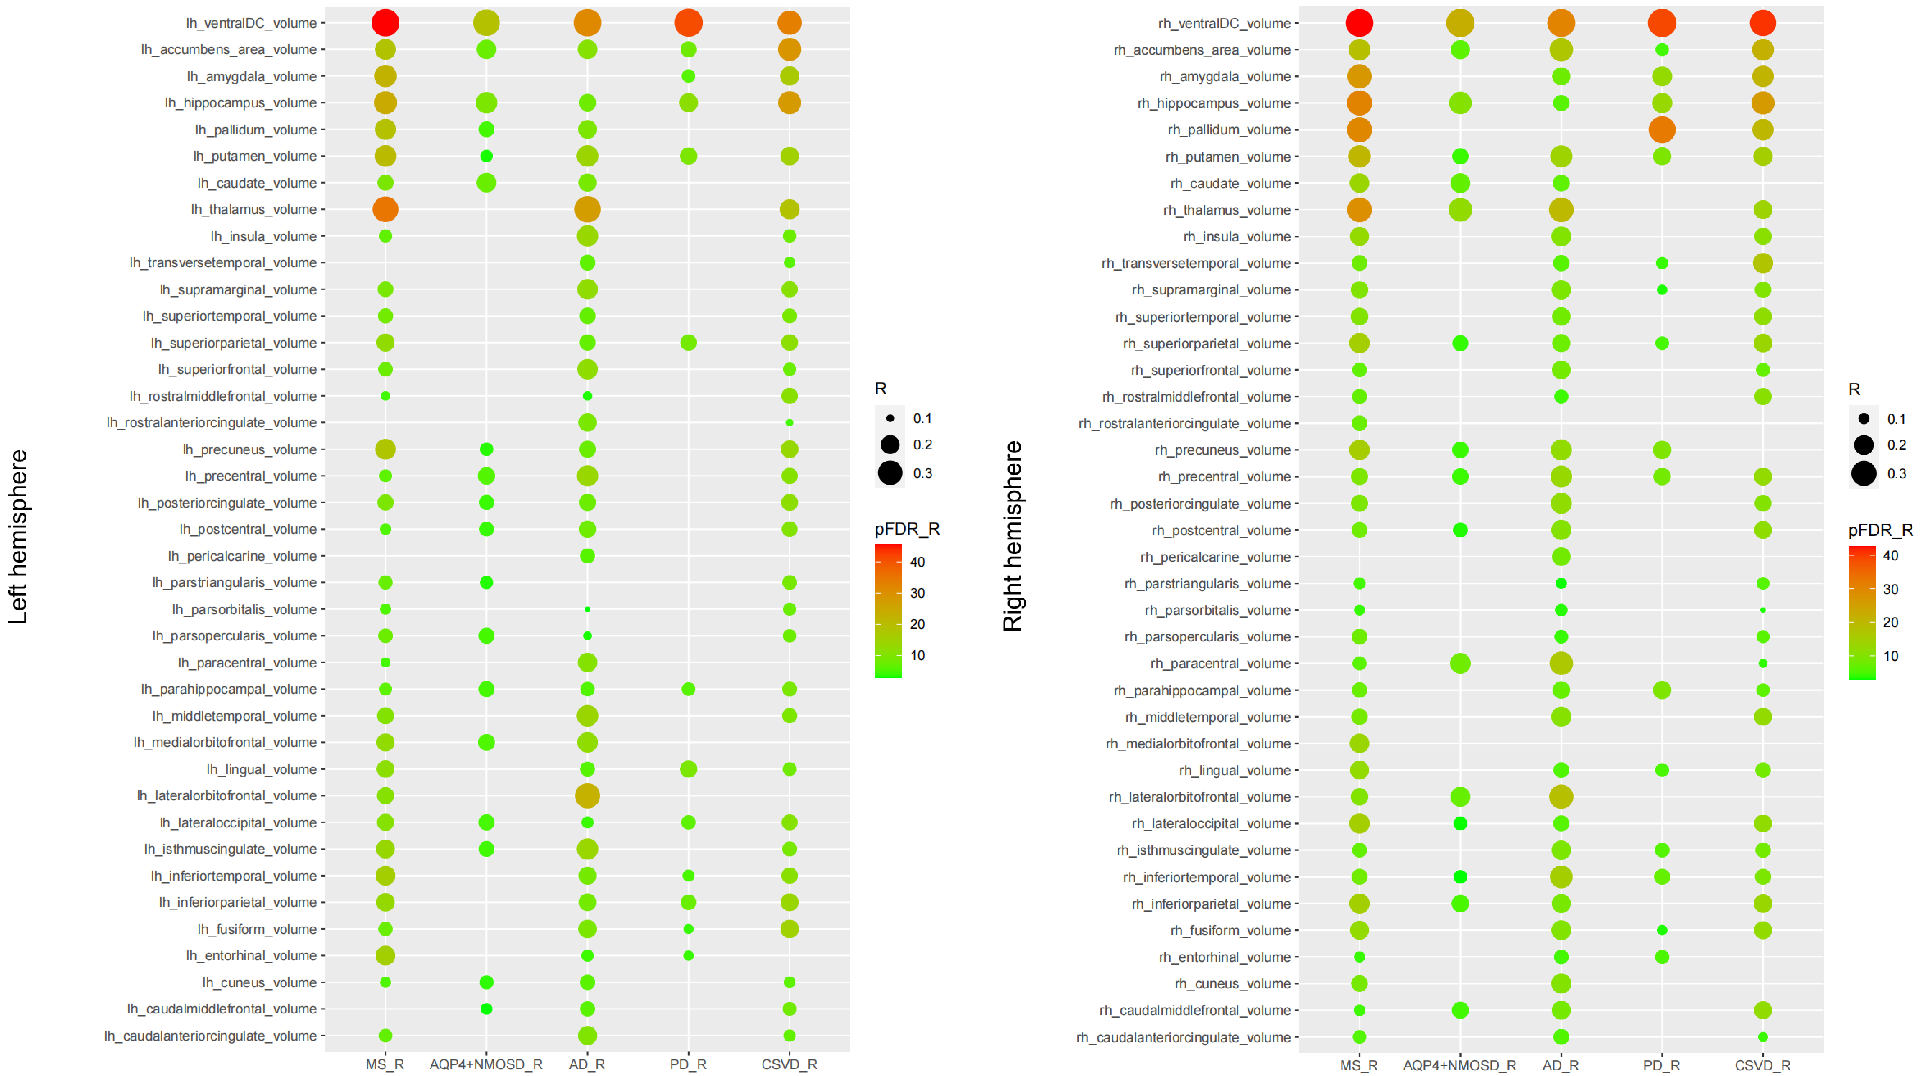
Figure 3. Correlations between MUCCA and brain regional atrophy among different neurological disorders in the left (A) and right (B) hemispheres.Abbreviations: AD, Alzheimer's disease; AQP4+ NMOSD, aquaporin-4 antibody-seropositive + neuromyelitis optica spectrum disorders; CSVD, cerebral small vessel disease; MS, multiple sclerosis; MUCCA, mean upper cervical cord area; PD, Parkinson's disease.
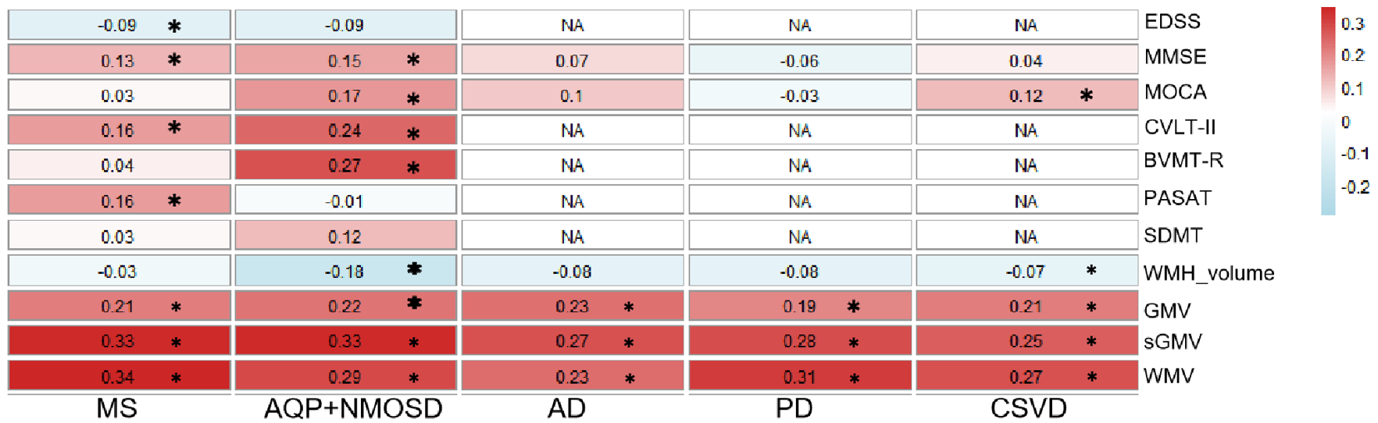
Figure 4 Correlation of MUCCA with MRI measurements and clinical indicators in neurological diseases.Abbreviations: BVMT-R, brief visuospatial memory test-revised; CVLT-II, California verbal learning test-second edition; EDSS, expanded disability status scale; GMV, gray matter volume; sGMV, subcortical gray matter volume; MoCA, Montreal cognitive assessment; MMSE, mini-mental state examination; NA, not available; PASAT, paced auditory serial addition task; SDMT, symbol digit modalities test; WMH, white matter hyperintensity; WMV, white matter volume.