2339
Two novel applications of 3D amplified MRI (aMRI)1GE Healthcare, Gisborne, New Zealand, 2Mātai Medical Research Institute, Gisborne, New Zealand, 3Faculty of Medical & Health Sciences & Centre for Brain Research, University of Auckland, Auckland, New Zealand, 4Stanford University, Stanford, CA, United States, 5Auckland Bioengineering Institute, University of Auckland, Auckland, New Zealand, 6Department of Surgery & Anaesthesia, University of Otago, Wellington, New Zealand, 7Department of Medicine, University of Otago, Dunedin, New Zealand, 8Department of Ophthalmology, University of Auckland, Auckland, New Zealand, 9Vision Research Foundation, Auckland, New Zealand
Synopsis
Keywords: Spinal Cord, Spinal Cord, Optical nerve
Motivation: We intend to employ advanced imaging methods to explain pathologic clinical scenarios involving the spine and optical nerve sheath. Motion in these applications is driven by cardiac pulsatility, and the pulsatile motion occurs across CSF-tissue boundary.
Goal(s): In this work, we tested if cardiac-gated cine MR imaging combined with video amplification can visualize sub-voxel motion.
Approach: Pulsatile motion profiles were extracted and quantitatively compared.
Results: Pulsatile motion in healthy and pathological use cases are compared.
Impact: Amplified MRI (aMRI) is a visualization method that shows pulsatile dynamics and is used to study brain pulsation. We have shown additional use-cases in spinal cord motion and optical nerve sheath dynamics.
Background
3D amplified MRI (aMRI)[1-5] is being developed for imaging brain motion in Chiari I malformation, during exercise, and in idiopathic intracranial hypertension. In this work we explore the use of aMRI in two additional parts of the body: Spinal Cord (SC) and optical nerve (ON) sheath.Application 1: Altered SC motion [6-8] is implicated in degenerative cervical myelopathy, cervical spine stenosis, and arachnoiditis. Phase Contrast (PC)-MRI is used in the diagnostic work-up of these conditions, but its readouts are influenced by varying phase drift resulting in false velocity values. Velocity measurements are usually limited to the scan plane which may obscure pathology elsewhere. Incorrect choices of a maximum velocity encoding and inability to extract full three-directional motion also limit its use.
Application 2: The optic nerve (ON) sheath encompass the ON as well as CSF and expands with raised intracranial pressure. The intraocular pressure and ON compartment pressure are opposed at the optic disc. Pressure gradients here cause glaucoma and papilloedema. The balance of pressures, dynamic behaviour and compliance of the ON sheath, globe and optic disc are important factors that have not been possible to measure with imaging. Correlating ON sheath dynamics [9-11] with intraocular and intracranial pressure could be important for understanding the pathogenesis and risk of blindness in glaucoma and papilledema.
In the aforementioned applications, we postulate that employing a cine-MR acquisition can help detect the characterization of underlying dynamics.
Methods
Under Institutional Review Board approval (20/CEN/107), data were acquired on 4 volunteers (Healthy: 1F, 24 yr, Syrinx: 1 Female 44years; Glaucoma: 1Female 52years) using a 3T GE SIGNA Premier MRI.The product volumetric cine MR (FIESTA) sequence was employed with the following parameters:
SC healthy: 3D cine FIESTA; TR/TE/FA=3.2/1.2/25deg; matrix=256x256; Res=1x1mm; 2mm Slice thick=2mm; acceleration=9; retrospective peripheral pulse gating binned to 20 cardiac phases; 70 slices; Average-HR=61 bpm.
SC syrinx: 3D cine FIESTA; TR/TE/FA=3.2/1.2/25; 256x256; in-plane res=1x1mm; Slice thick=2mm; acceleration=9; retrospective peripheral pulse gating binned to 20 cardiac phases; 120 slices; Scan time=1:30 min; Average-HR=76 beats per minute.
ON healthy and Glaucoma: 3D cine FIESTA: TR/TE/FA=3.6/1.4/25deg; Flip Angle=25; 512x512;0.4x0.4x0.8mm; Scan time=3:20min, Average-HR=66 bpm (Healthy) and 58 bpm (Glaucoma).
The cine data was amplified with a global amplification factor of 40. Difference maps were generated by subtracting each cardiac frame from the first frame, providing a visualization of the regions where motion had resulted in significant changes in pixel intensity. 3D displacement was calculated using Demons registration in Matlab(R). Each volume was registered to the first cardiac frame to produce a displacement field for every cardiac frame. Average displacement within each ROI was calculated.
Results
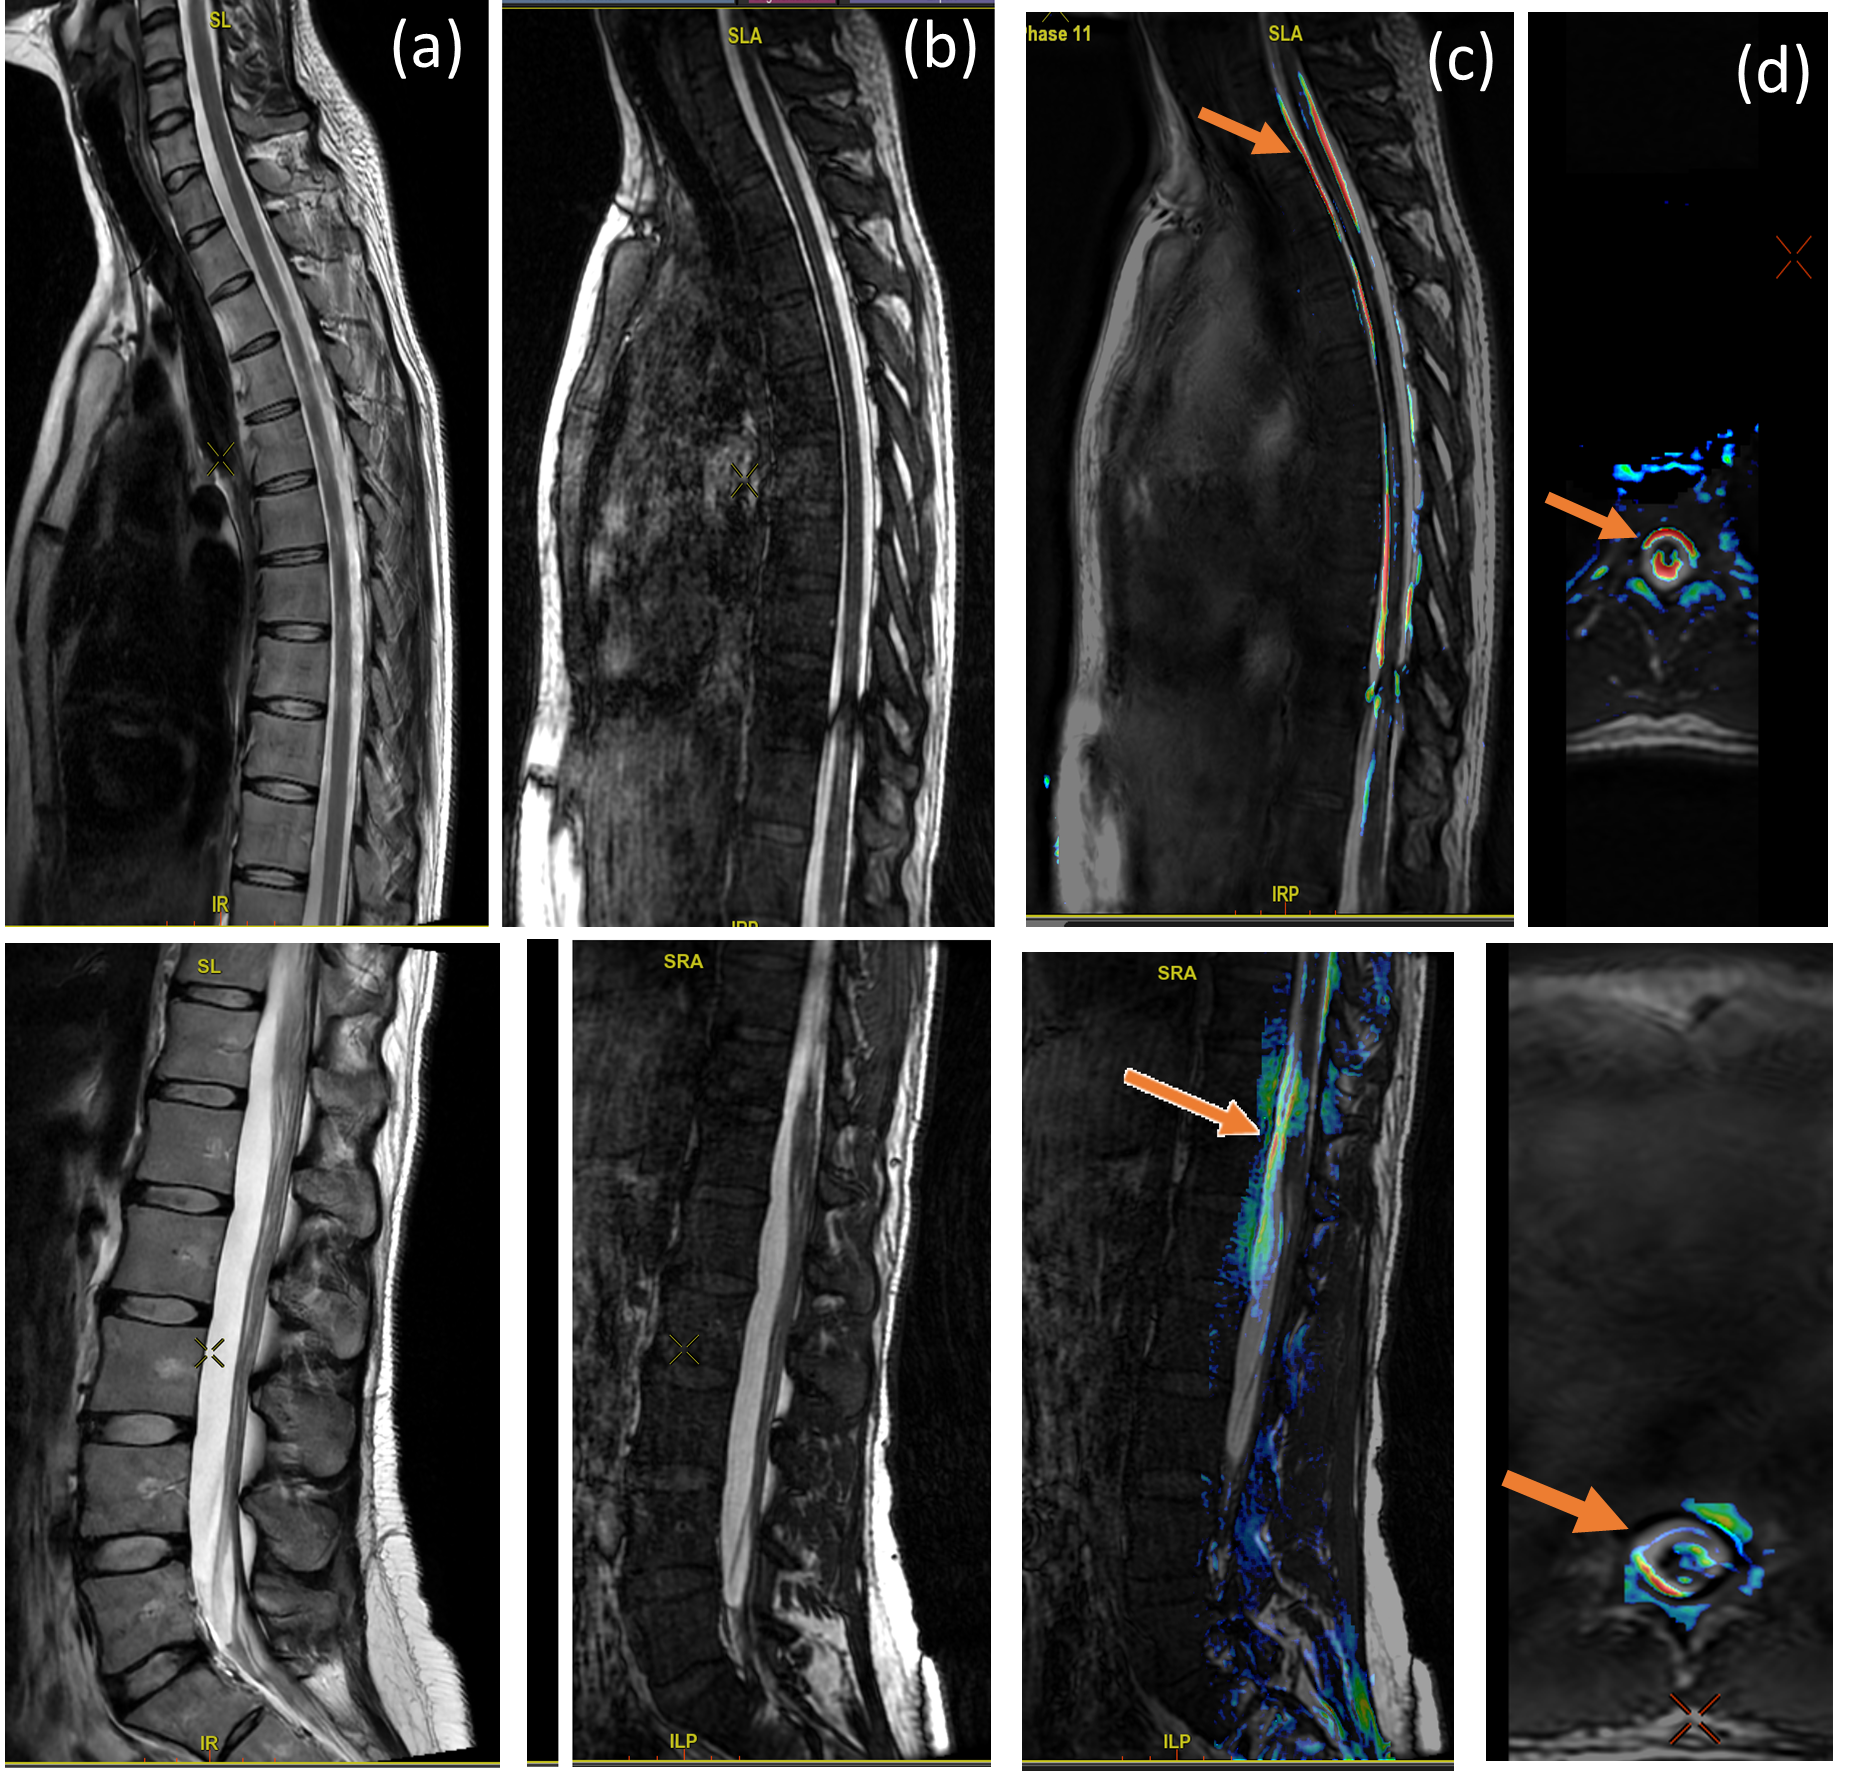
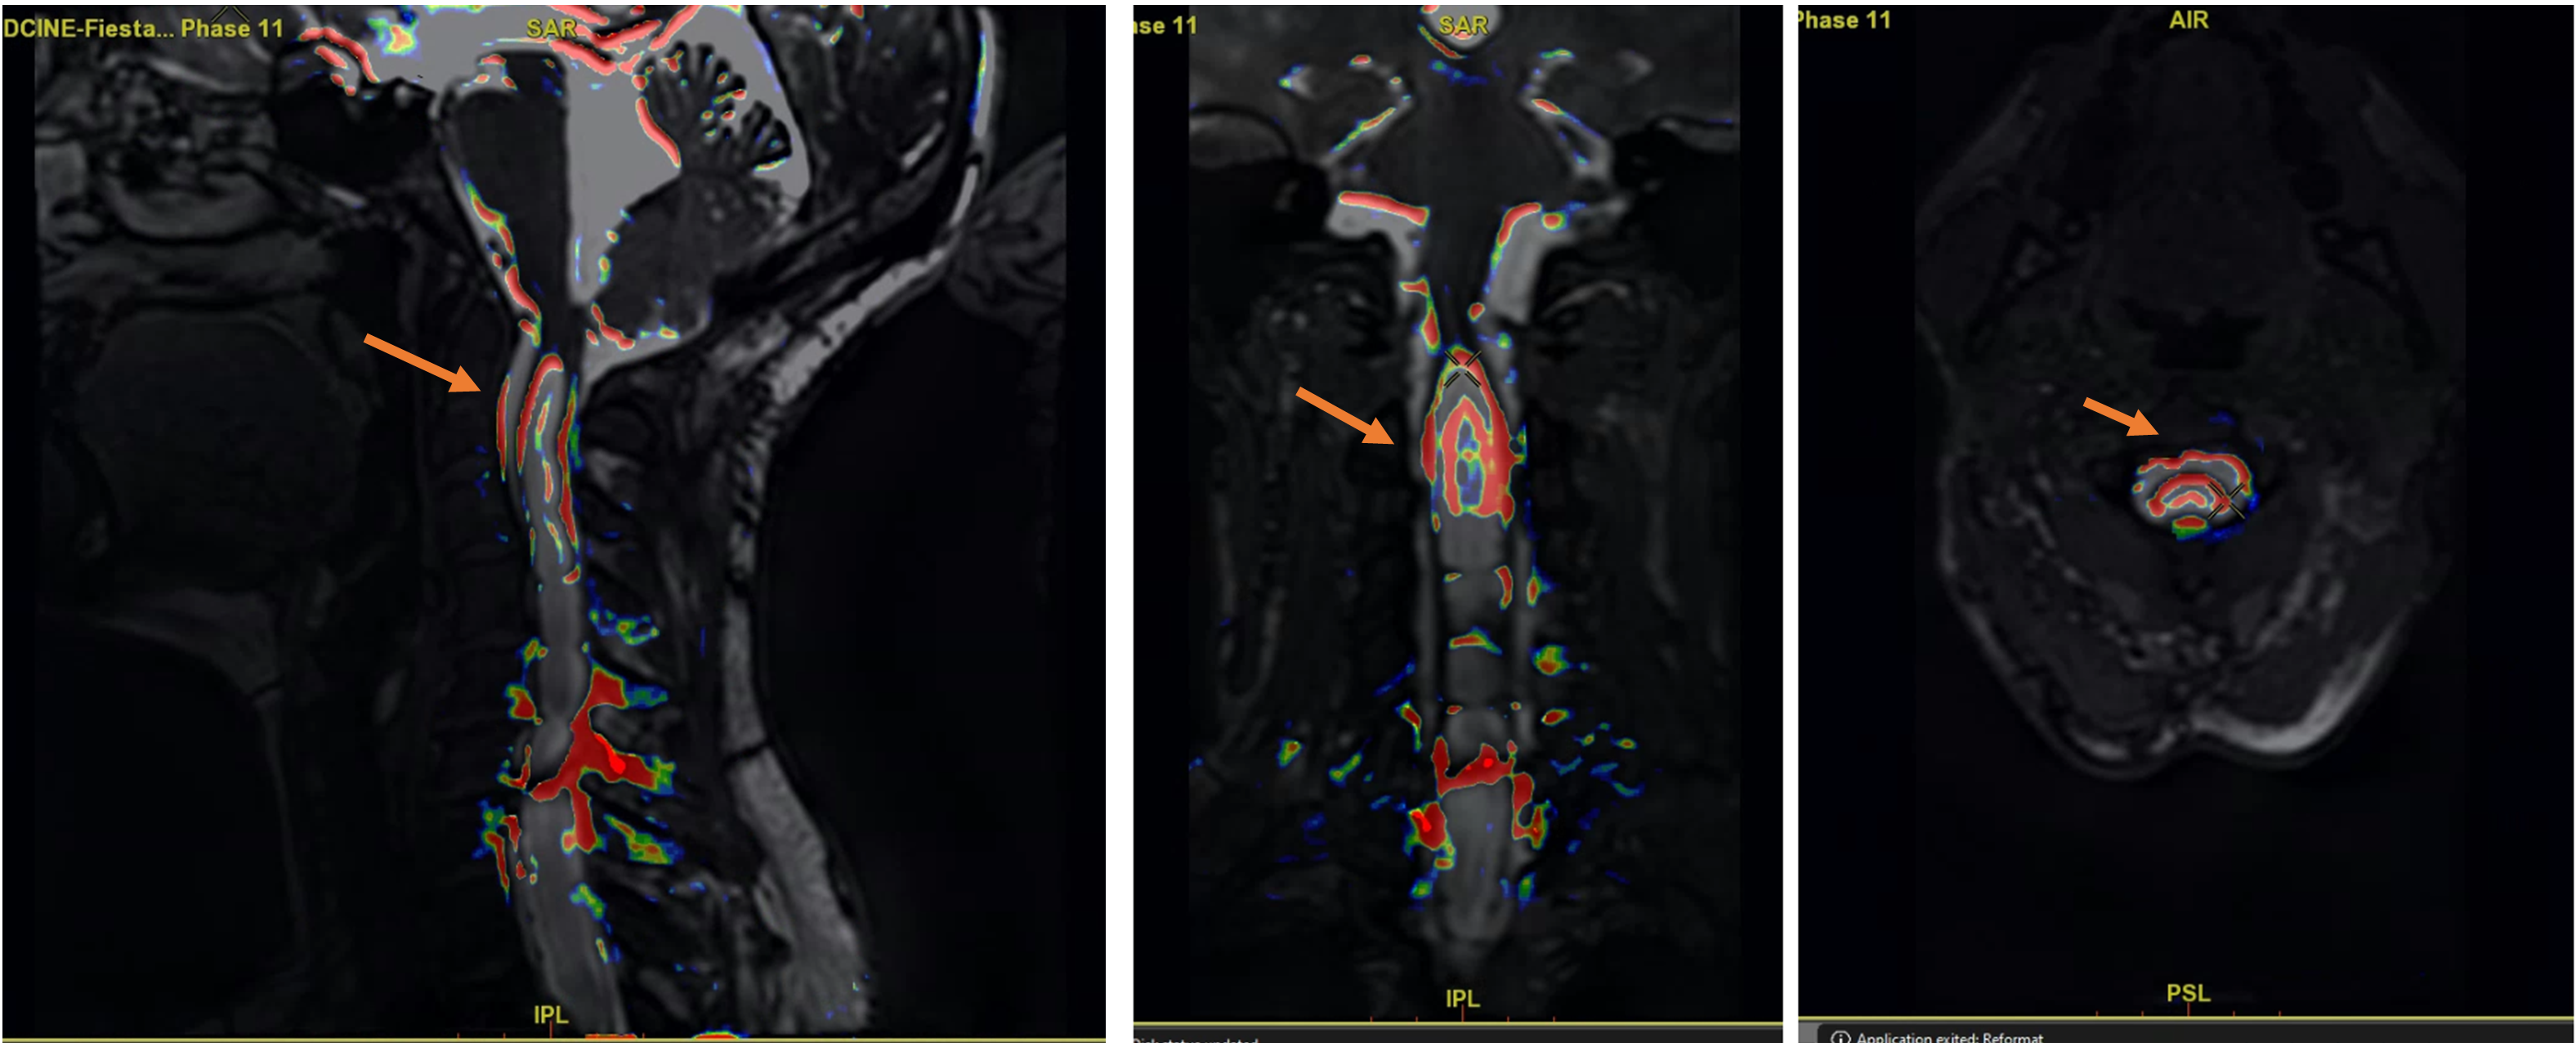
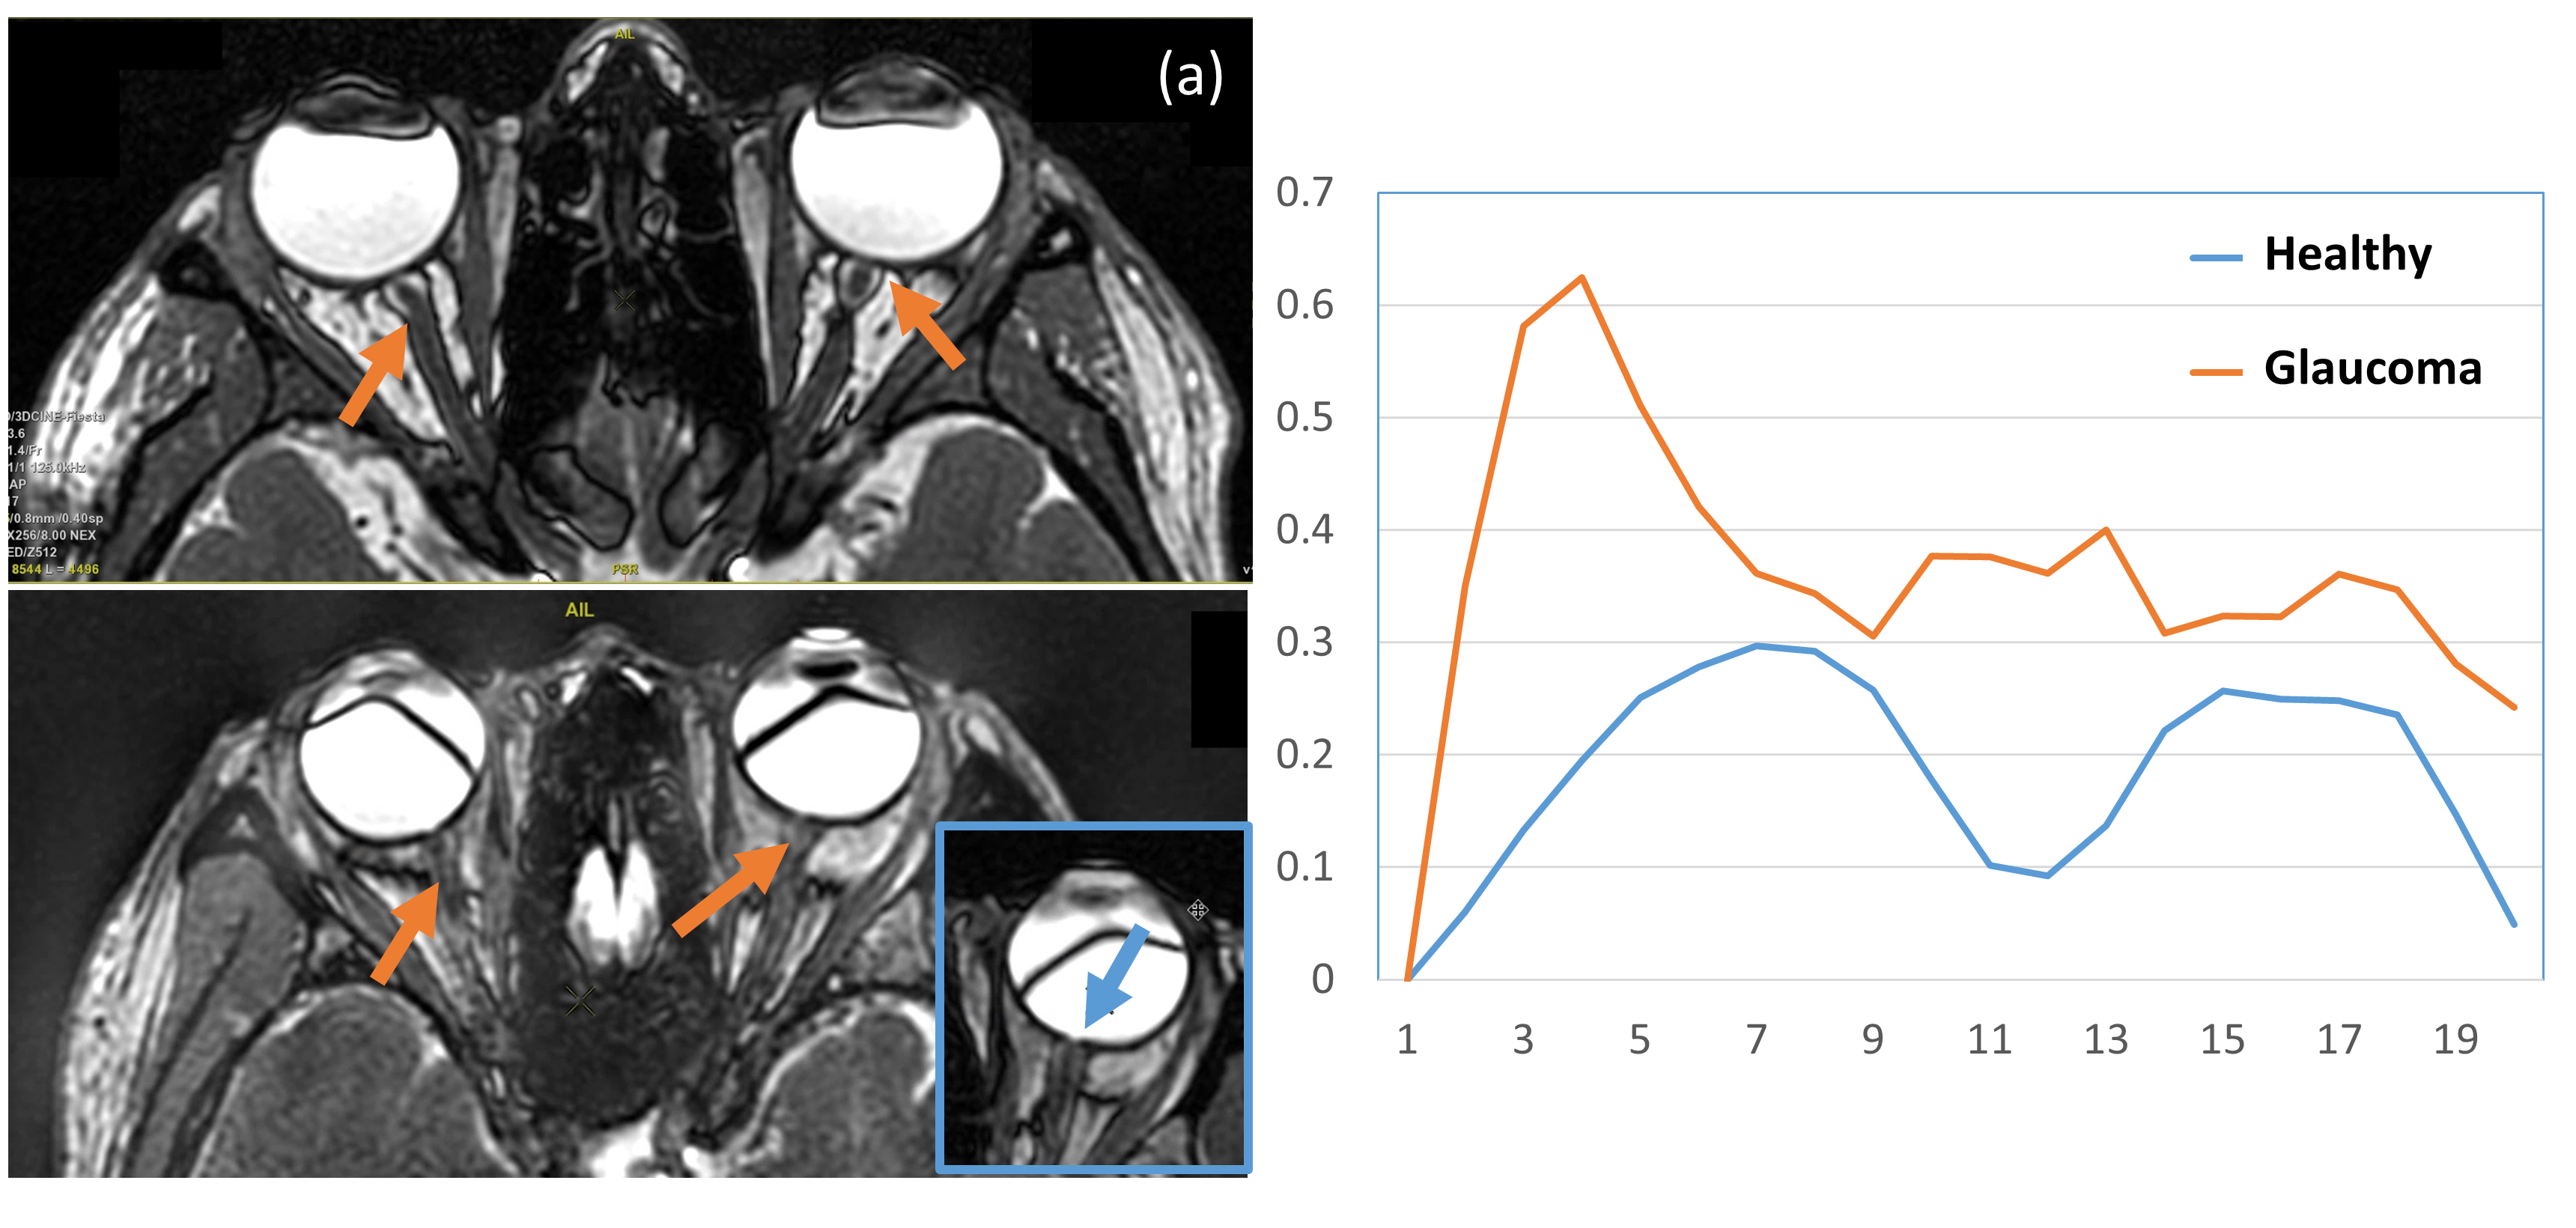
Figure 1 shows a reference for normal spinal cord motion used for comparative analysis. Figure 2 depicts cervical spinal cord motion in a patient with a syrinx. Compared to Figure 1, the overlaid colour maps indicate increased and dis-coordinated motion in the upper cervical spine at C2 and C5-7. In addition, abnormal and localized bulging of the spinal cord was seen on the amplified images during motion (not shown) but not on the static T2 FLAIR (not reported) or unamplified cine FIETA images.Figure 3 shows the optical nerve imaged using 0.4mm in-plane resolution slices. The ON sheath could be clearly delineated in the healthy control but not in the glaucoma patient. The average displacement plot (Figure 3c) shows uniform systolic and diastolic peaks in the healthy case while the glaucoma case has an asynchronous motion profile. Different intraocular vs intracranial pressures could explain the differences in the motion profiles.
Conclusion
Our examples show that differences in 3D SC and ON sheath motion can be measured with aMRI without the need to decide on an imaging plane. Our results show that aMRI can be used as an additional imaging sequence to characterize dynamic spinal cord and optic nerve sheath motion. Further studies are needed to see if these dynamics can be used a non-invasive, reliable, bio-marker for characterizing diseases of the spine or eyes.Acknowledgements
Acknowledgements: We would like to thank the Rapanui Trust, Gisborne, New Zealand; Vision Research Foundation, New Zealand; and the JN & HB Williams Foundation for supporting this work.References
1. Terem I, et al. (2021) 3D amplified MRI (aMRI). Magn. Reson. Med. 2021.
2. Abderezaei J, et al. (2021) Development, calibration, and testing of 3D amplified MRI (aMRI) for the quantification of intrinsic brain motion. Brain Multiphysics, doi: 10.1016/j.brain.2021.100022.
3. Abderezaei J, et al. (2022) Increased Hindbrain Motion in Chiari Malformation I Patients Measured Through 3D Amplified MRI (3D aMRI). https://doi.org/10.1101/2022.10.25.22281481.
4. Kumar H et al (2023) Changes in brain pulsatility associated with heart rate elevation using amplified MRI and phase-contrast MRI, ISMRM
5. Kumar H et al (2023) Alterations of brain motion in Idiopathic Intracranial Hypertension(IIH) using amplified MRI, ISMRM
6. Winklhofer S et al. Spinal Cord Motion: Fortschr Röntgenstr 2014;
7. Cheng et al. (2012) The presence of arachnoiditis affects the characteristics of CSF flow in the spinal subarachnoid space: A modelling study, Journal of Biomechanics 45, 1186–1191
8. Sadek A-R, Nader-Sepahi A, (2019) Spinal Arachnoid Cysts: Presentation, management and pathophysiology, Clinical Neurology and Neurosurgery 180, 87–96
9. Balaratnasingam C, Morgan WH, Johnstone V, et al. (2009) Histomorphometric measurements in human and dog optic nerve and an estimation of optic nerve pressure gradients in human. Exp Eye Res.
10. Chowdhury UR, Fautsch M. Intracranial Pressure and its relationship to glaucoma: Current understanding and future directions. Med Hypothesis Discov Innov Ophthalmol. 2015; 4(3): 71-80.
11. Mathieu E, et al. Reduced cerebrospinal fluid inflow to the optic nerve in glaucoma. Invest Ophthalmol Vis Sci. 2018.
Figures