2336
MRI Grading Scores Significantly Improve the Prognostic Performance of Standalone Clinical Model for Guillain-Barré Syndrome1Department of Radiology, Qilu Hospital of Shandong University, Jinan, Shandong, China
Synopsis
Keywords: Peripheral Nerves, Nervous system
Motivation: Guillain-Barré syndrome (GBS) has an unpredictable outcome, and it's vital to find ways to forecast its progression, as some patients may face severe disability or even death.
Goal(s): The study aimed to assess the value of MRI grading scores for muscle denervation edema in predicting the course of GBS.
Approach: We conducted a retrospective analysis on 354 GBS patients, employing a 5-point MRI grading scale. We compared the predictive capabilities of models using only clinical data against those that combined clinical information with MRI findings.
Results: The results clearly demonstrated that including MRI data significantly enhanced the accuracy of predictions for patient outcomes.
Impact: MRI grading scores may improve GBS prognosis, enable personalized treatment, and potentially reduce morbidity. This method paves the way for incorporating imaging biomarkers in neurological disorders to improve clinical strategies.
Introduction
Guillain-Barré Syndrome (GBS), with an incidence of 0.81-1.89 per 100,000 person-years1, presents with limb weakness and areflexia2. The outcomes of effective treatment vary from recovery to severe disability or death3. Early prognostication is indispensable to manage high-risk patients4. Previous studies highlight age, diarrhea, MRC sum scores, disability levels, and ventilatory support as prognostic indicators5, but exclude MRI findings. Contrast MRI often reveals nerve root and cauda equina abnormalities in GBS6; the prognostic value of MRI-detected lumbosacral muscle edema has not been fully studied. This study assesses the prognostic significance of MRI grading scores for this muscle edema and evaluates whether they improve the predictive accuracy of clinical prognostic models for GBS.Methods
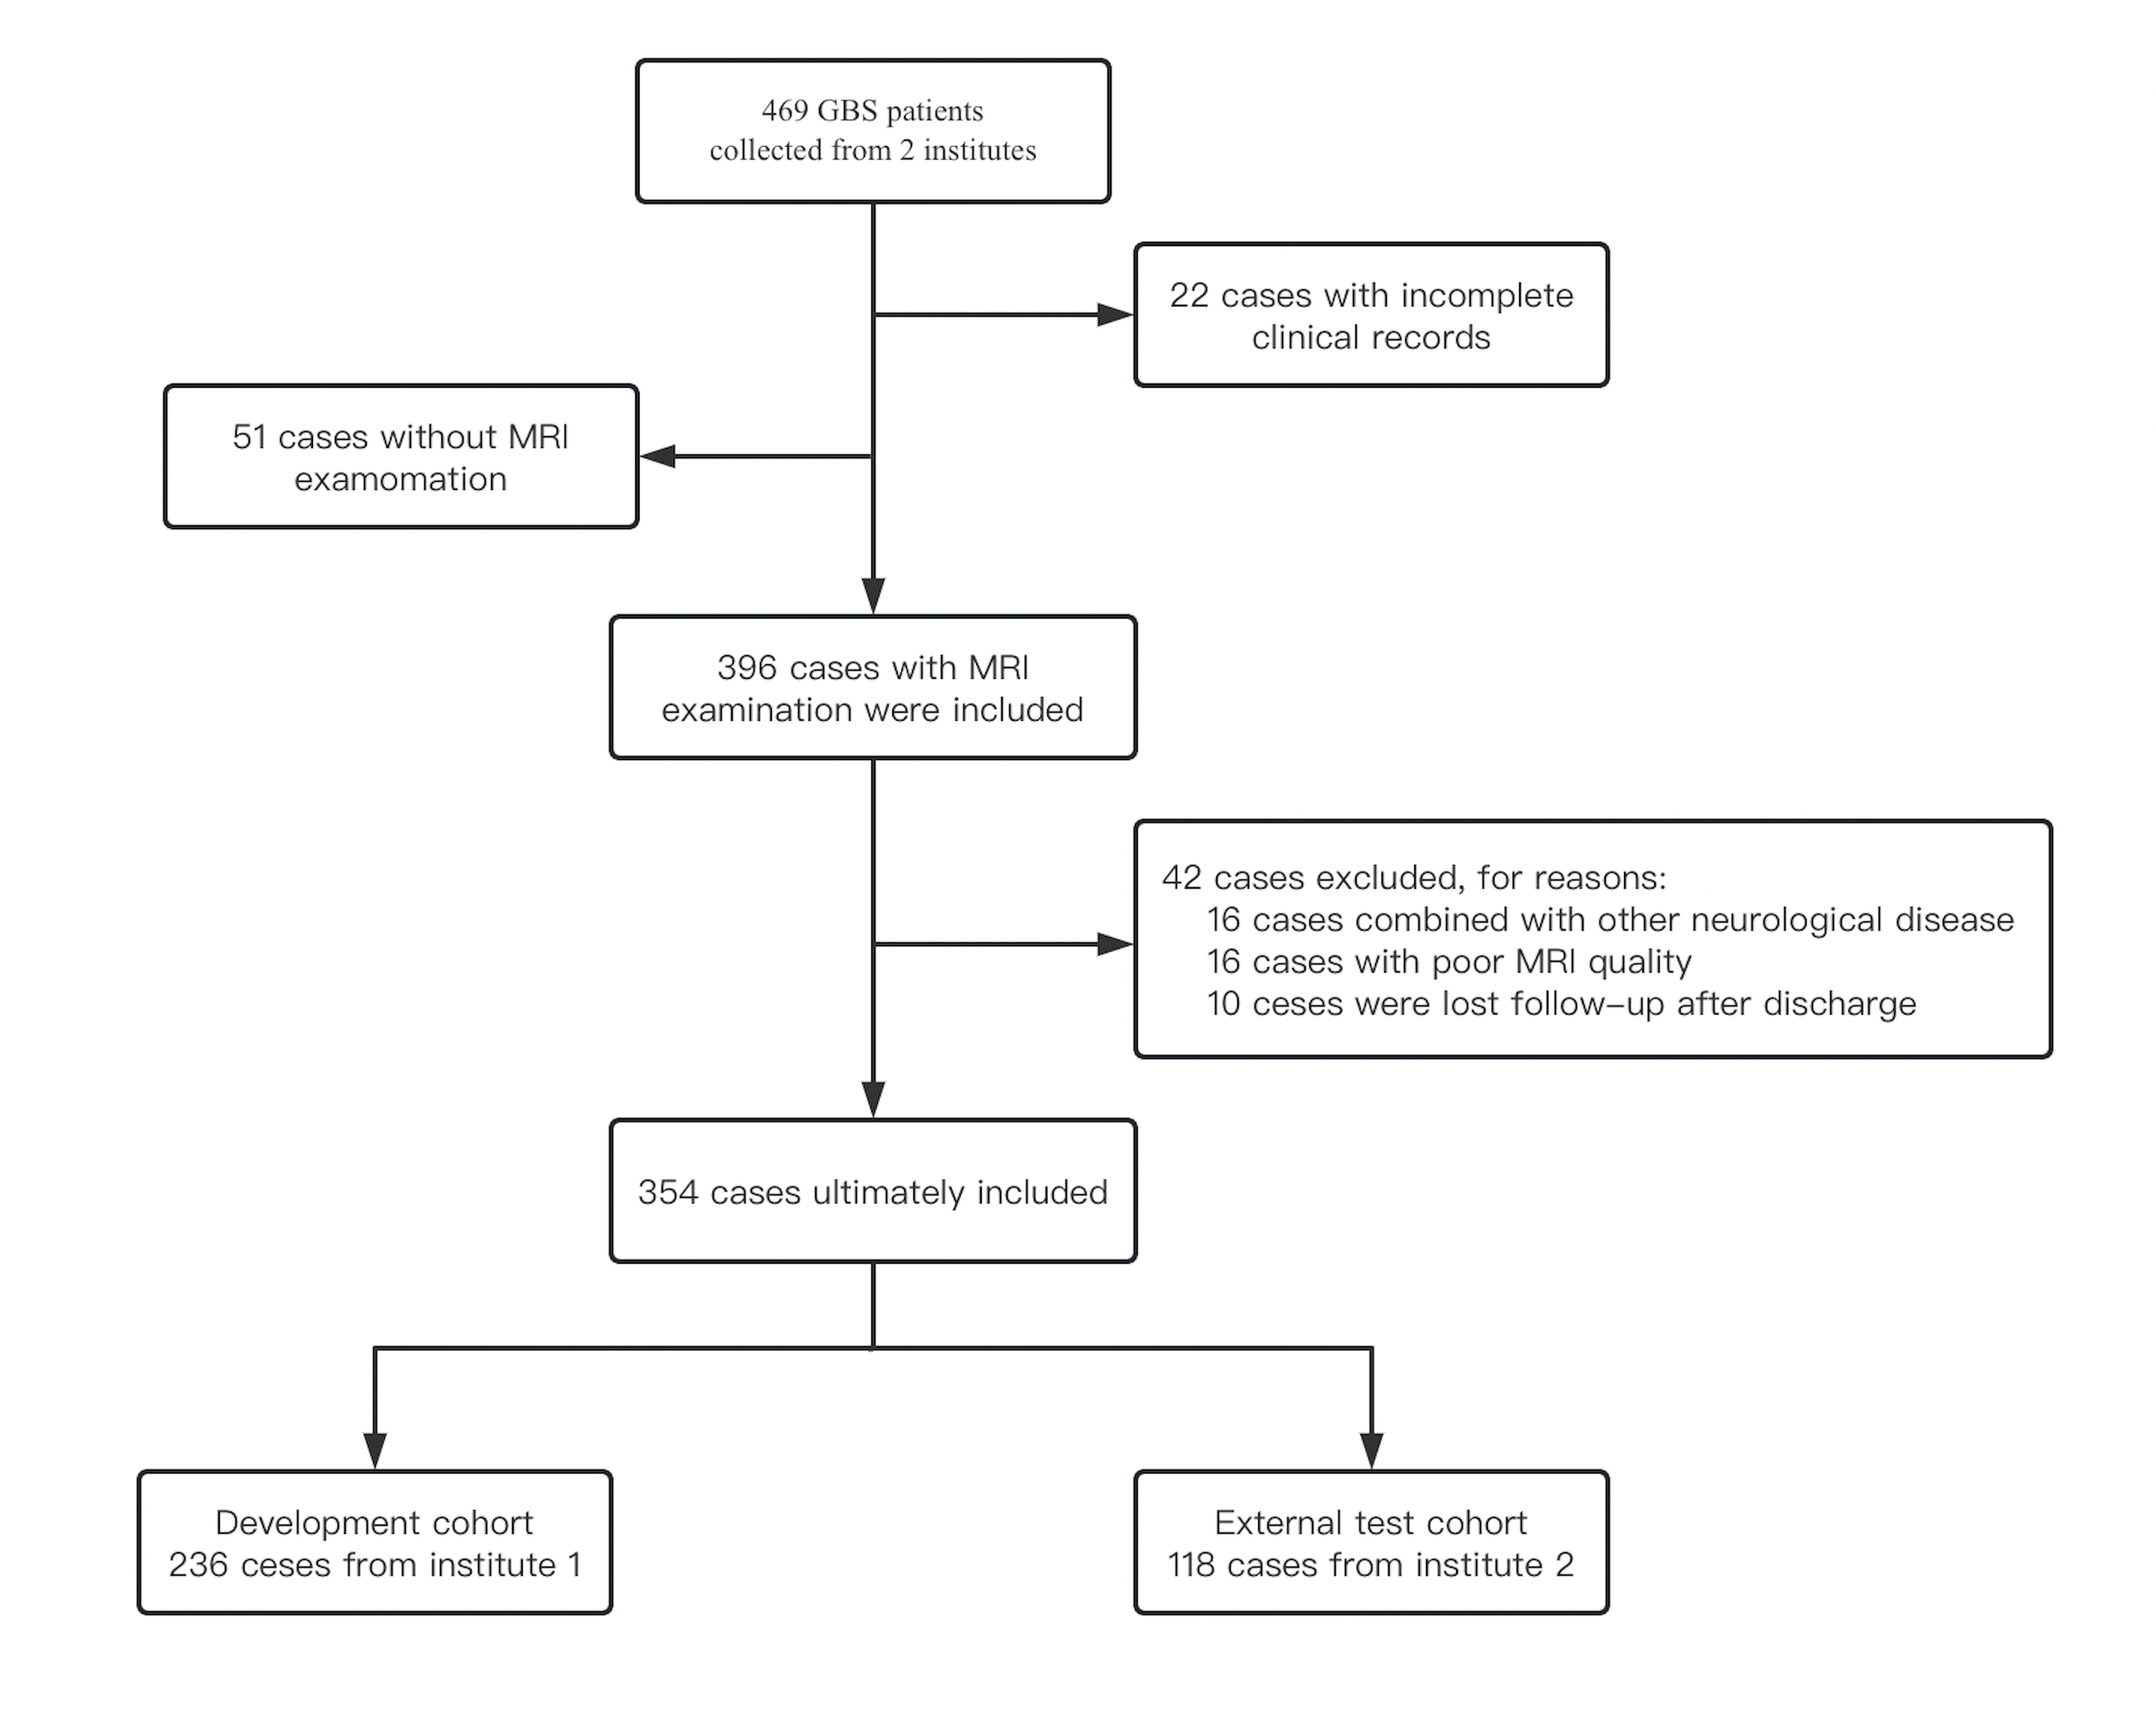
Patients: A retrospective review of 469 GBS patients from two institutions, conducted between January 2018 and December 2022, followed the diagnostic criteria of Asbury and Cornblath (1990) and Sejvar et al. (2011), employed standardized treatment, and ensured a minimum of six months of post-discharge follow-up. Patients were excluded for inadequate MRI, concurrent neurological diseases, previous GBS diagnosis, or loss to follow-up. How the study sample was collected is shown in Figure 1.MRI Protocols: MRI evaluations were performed at Institute 1 using a 1.5-T Siemens Magnetom Aera and at Institute 2 using a 3.0-T GE Discovery750. Patients underwent scanning in a supine position, utilizing gadopentamide (0.2 ml/kg, 2.0 ml/s), with imaging began two minutes after contrast agent administration.
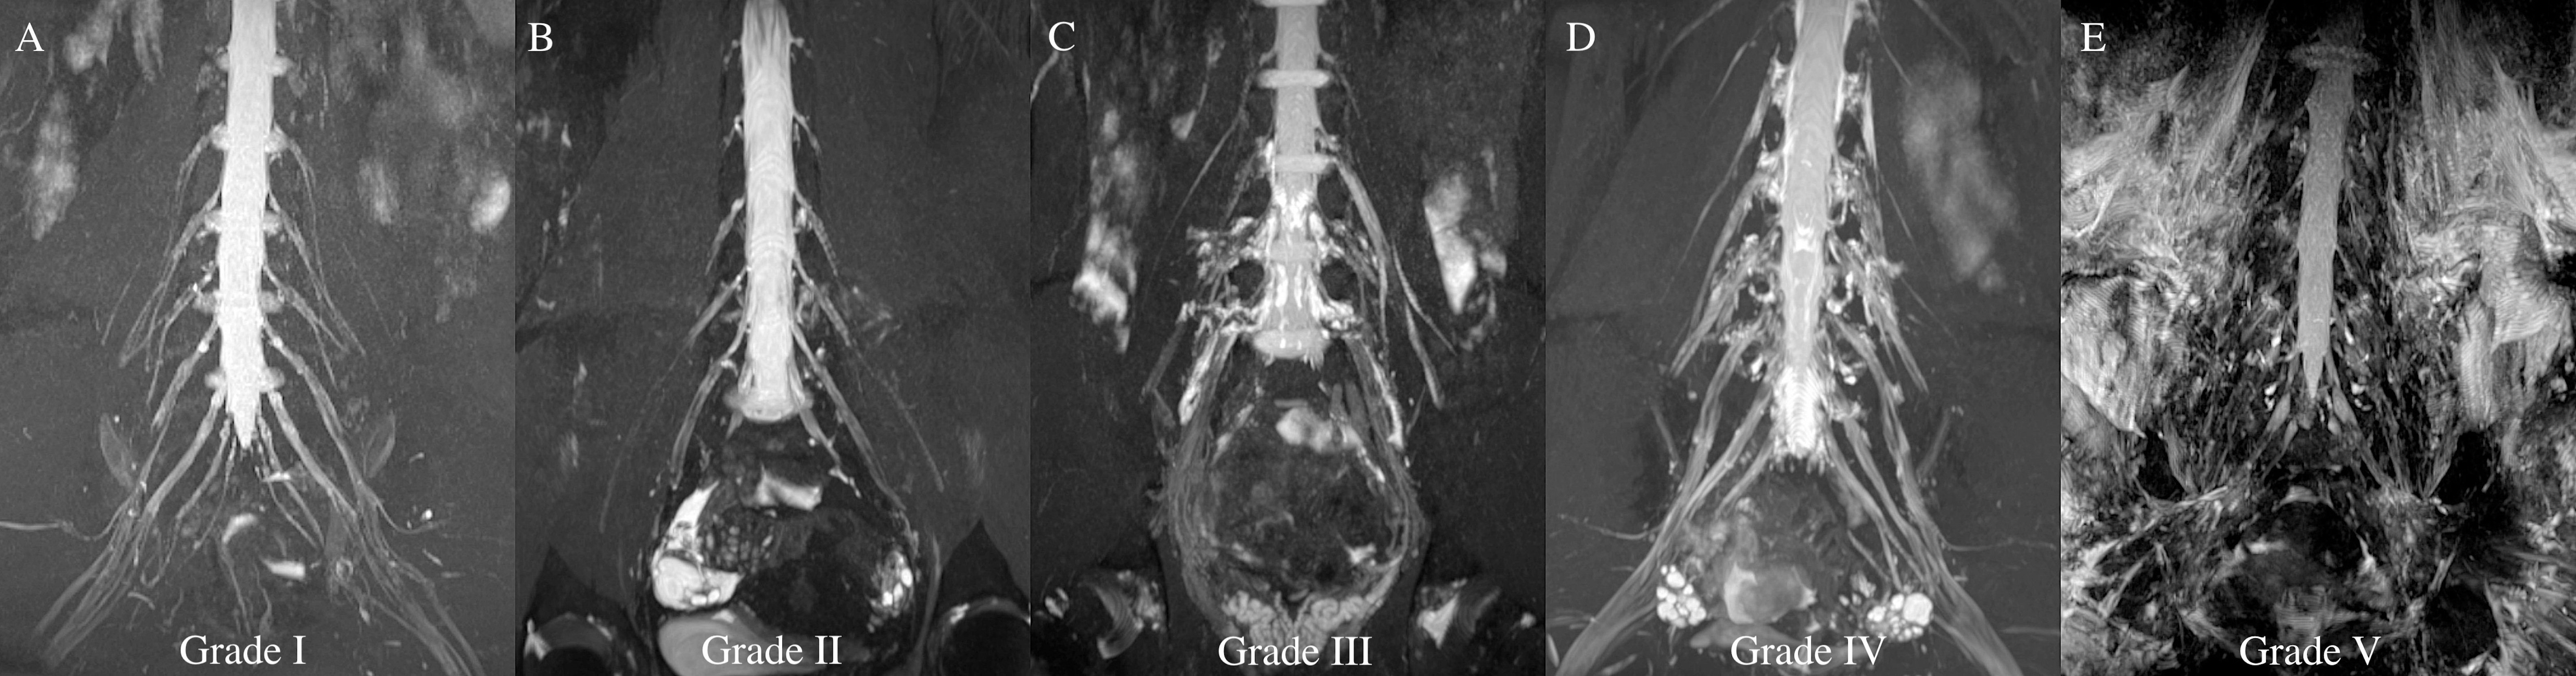
Evaluations on MRI grading scores: Lumbosacral nerve roots and cauda equina were evaluated for thickening, enhancement, and adjacent muscle edema on fat-suppressed T2-weighted sequences, with edema graded on a five-point scale. Intra- and inter-observer agreement was quantified at four-week intervals using the intraclass correlation coefficient (ICC). Representative MRI images for each grade are provided in Figure 2.
Clinical factors and MRI factors selection: Clinical and MRI factors were initially screened by univariate analysis, including demographic, seasonal, and clinical variables, and stepwise regression was applied to identify independent predictors.
Models training, validation and external test: Machine learning models were subjected to 5-fold cross-validation to ascertain performance robustness and generalization error.
Statistical Analysis: Statistical analyses employed the Kolmogorov-Smirnov test for normality, t-tests for normally distributed variables, and the Mann-Whitney U test for non-normal variables. Model distinction was assessed using the DeLong test, with significance set at p<0.05. Analyses were performed using MATLAB (2021a) and GraphPad Prism (9.5.0).
Results
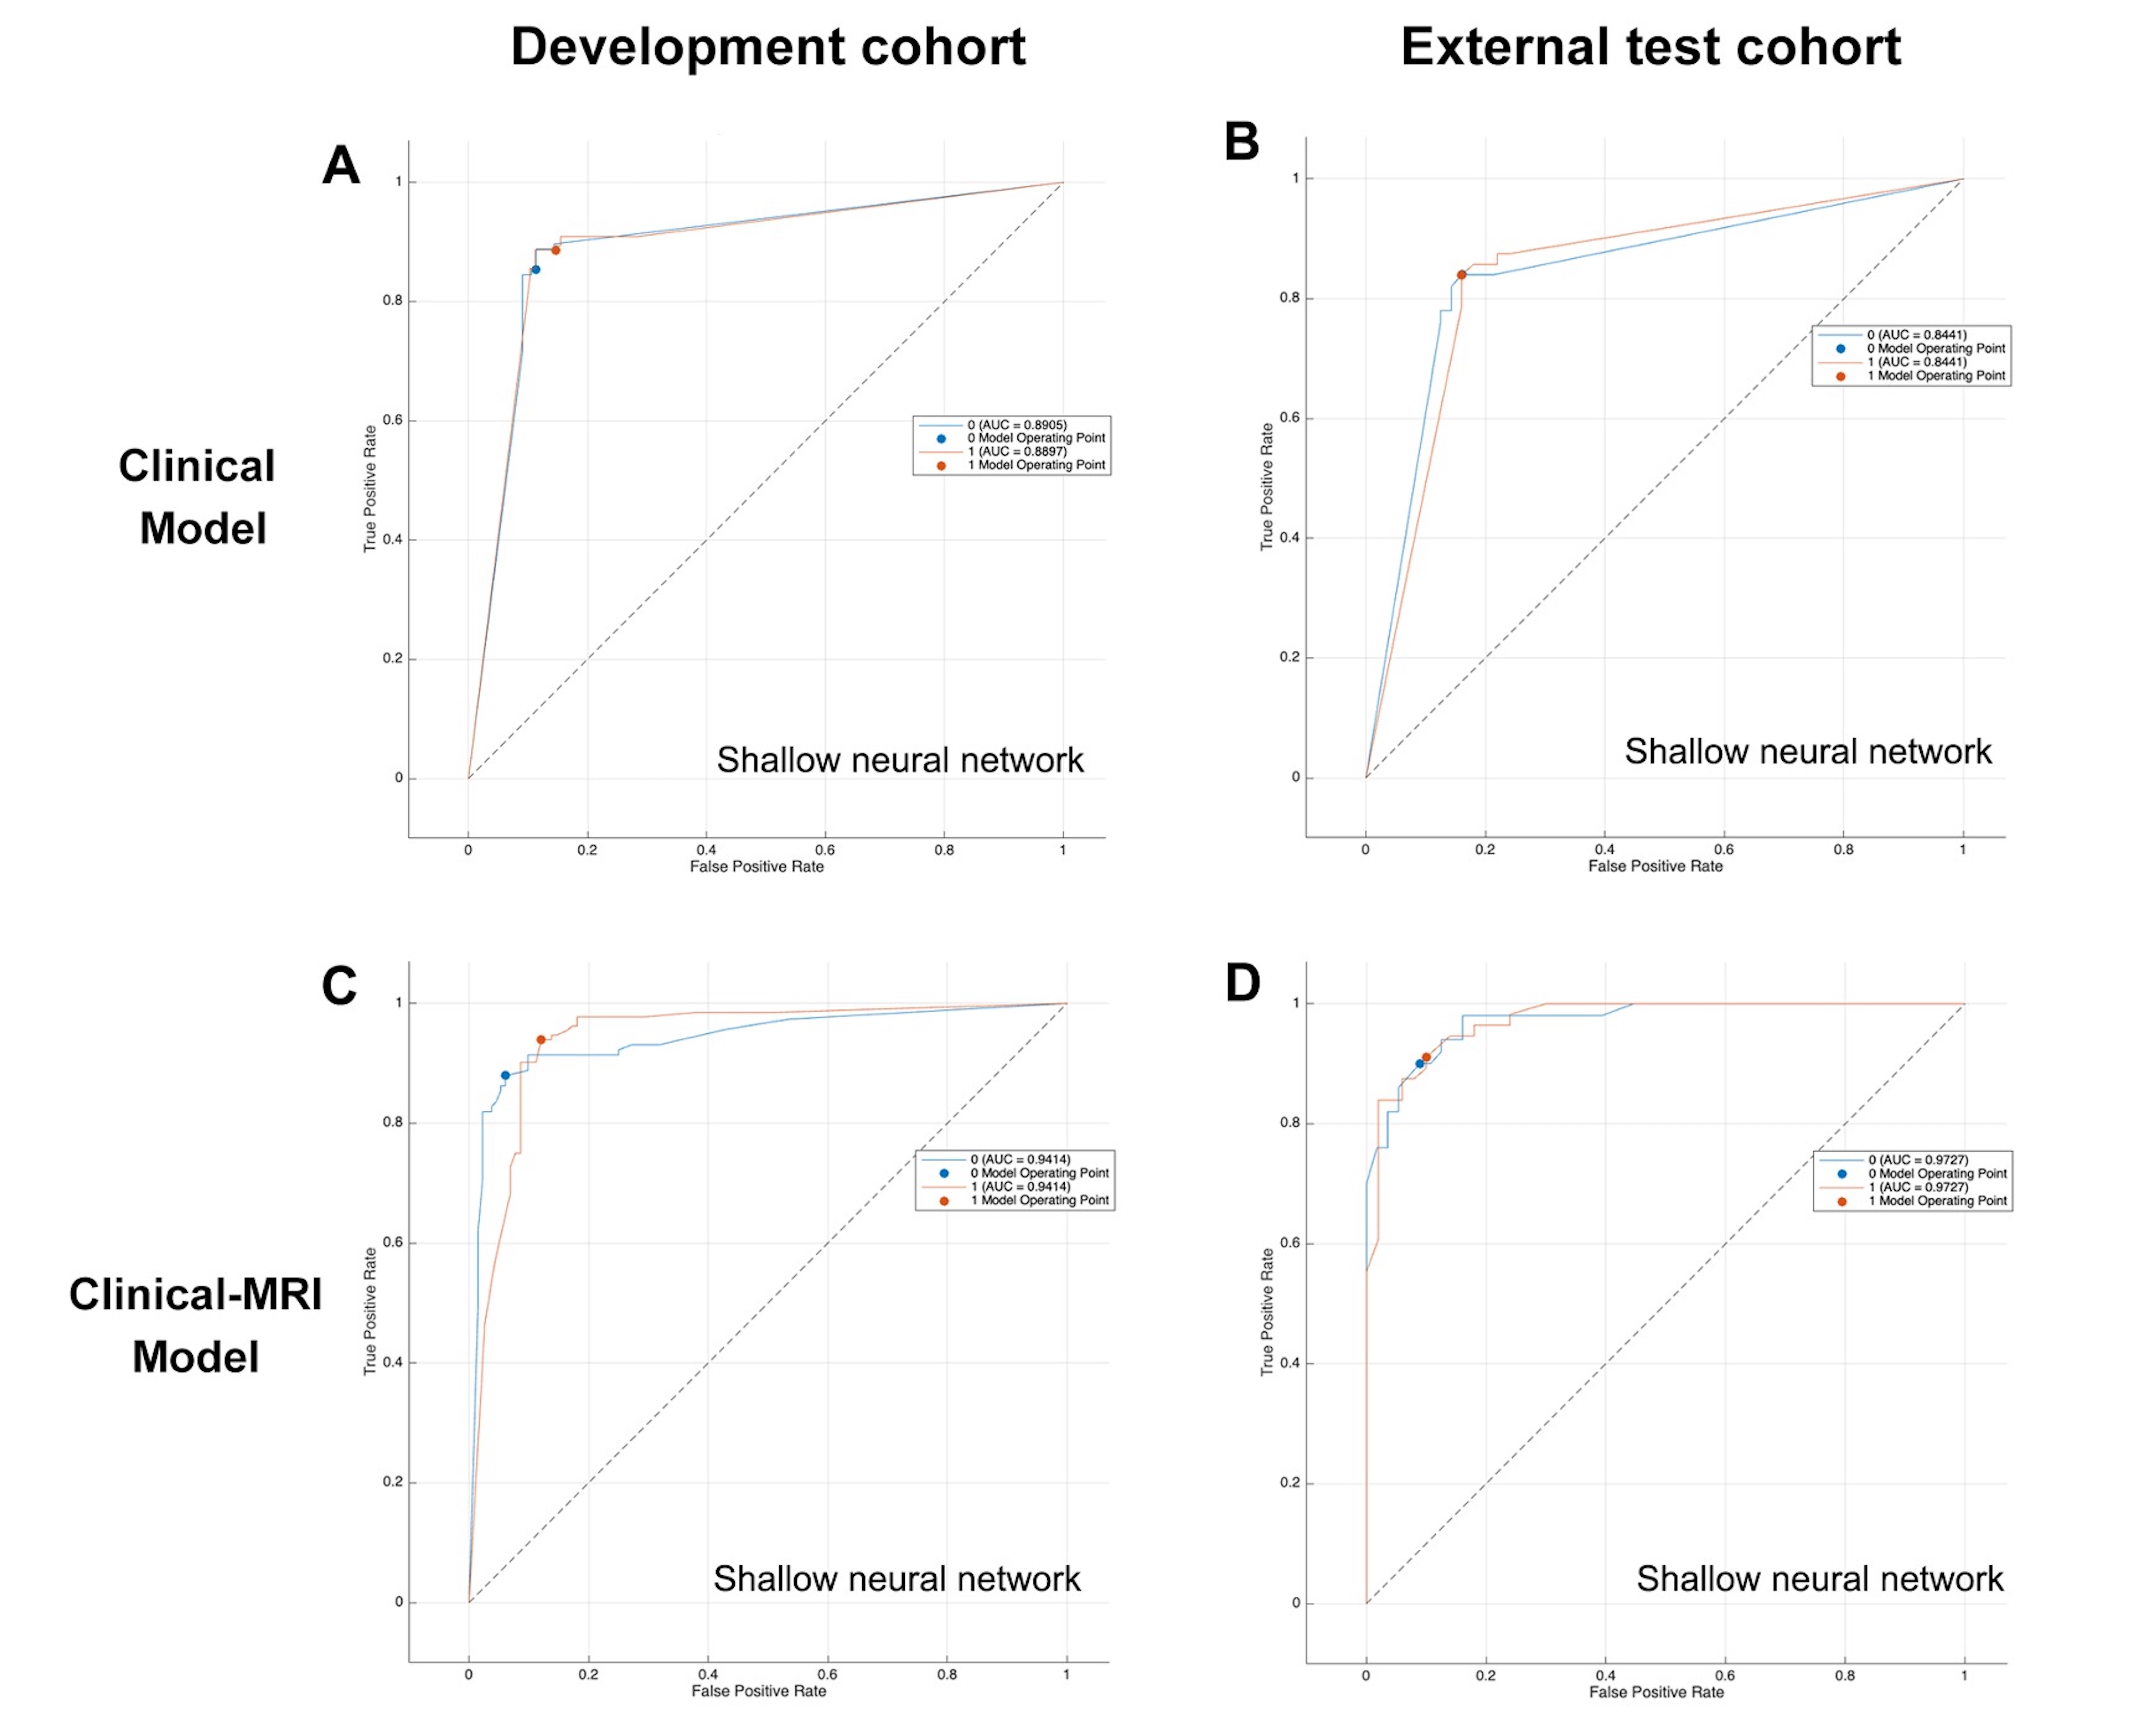
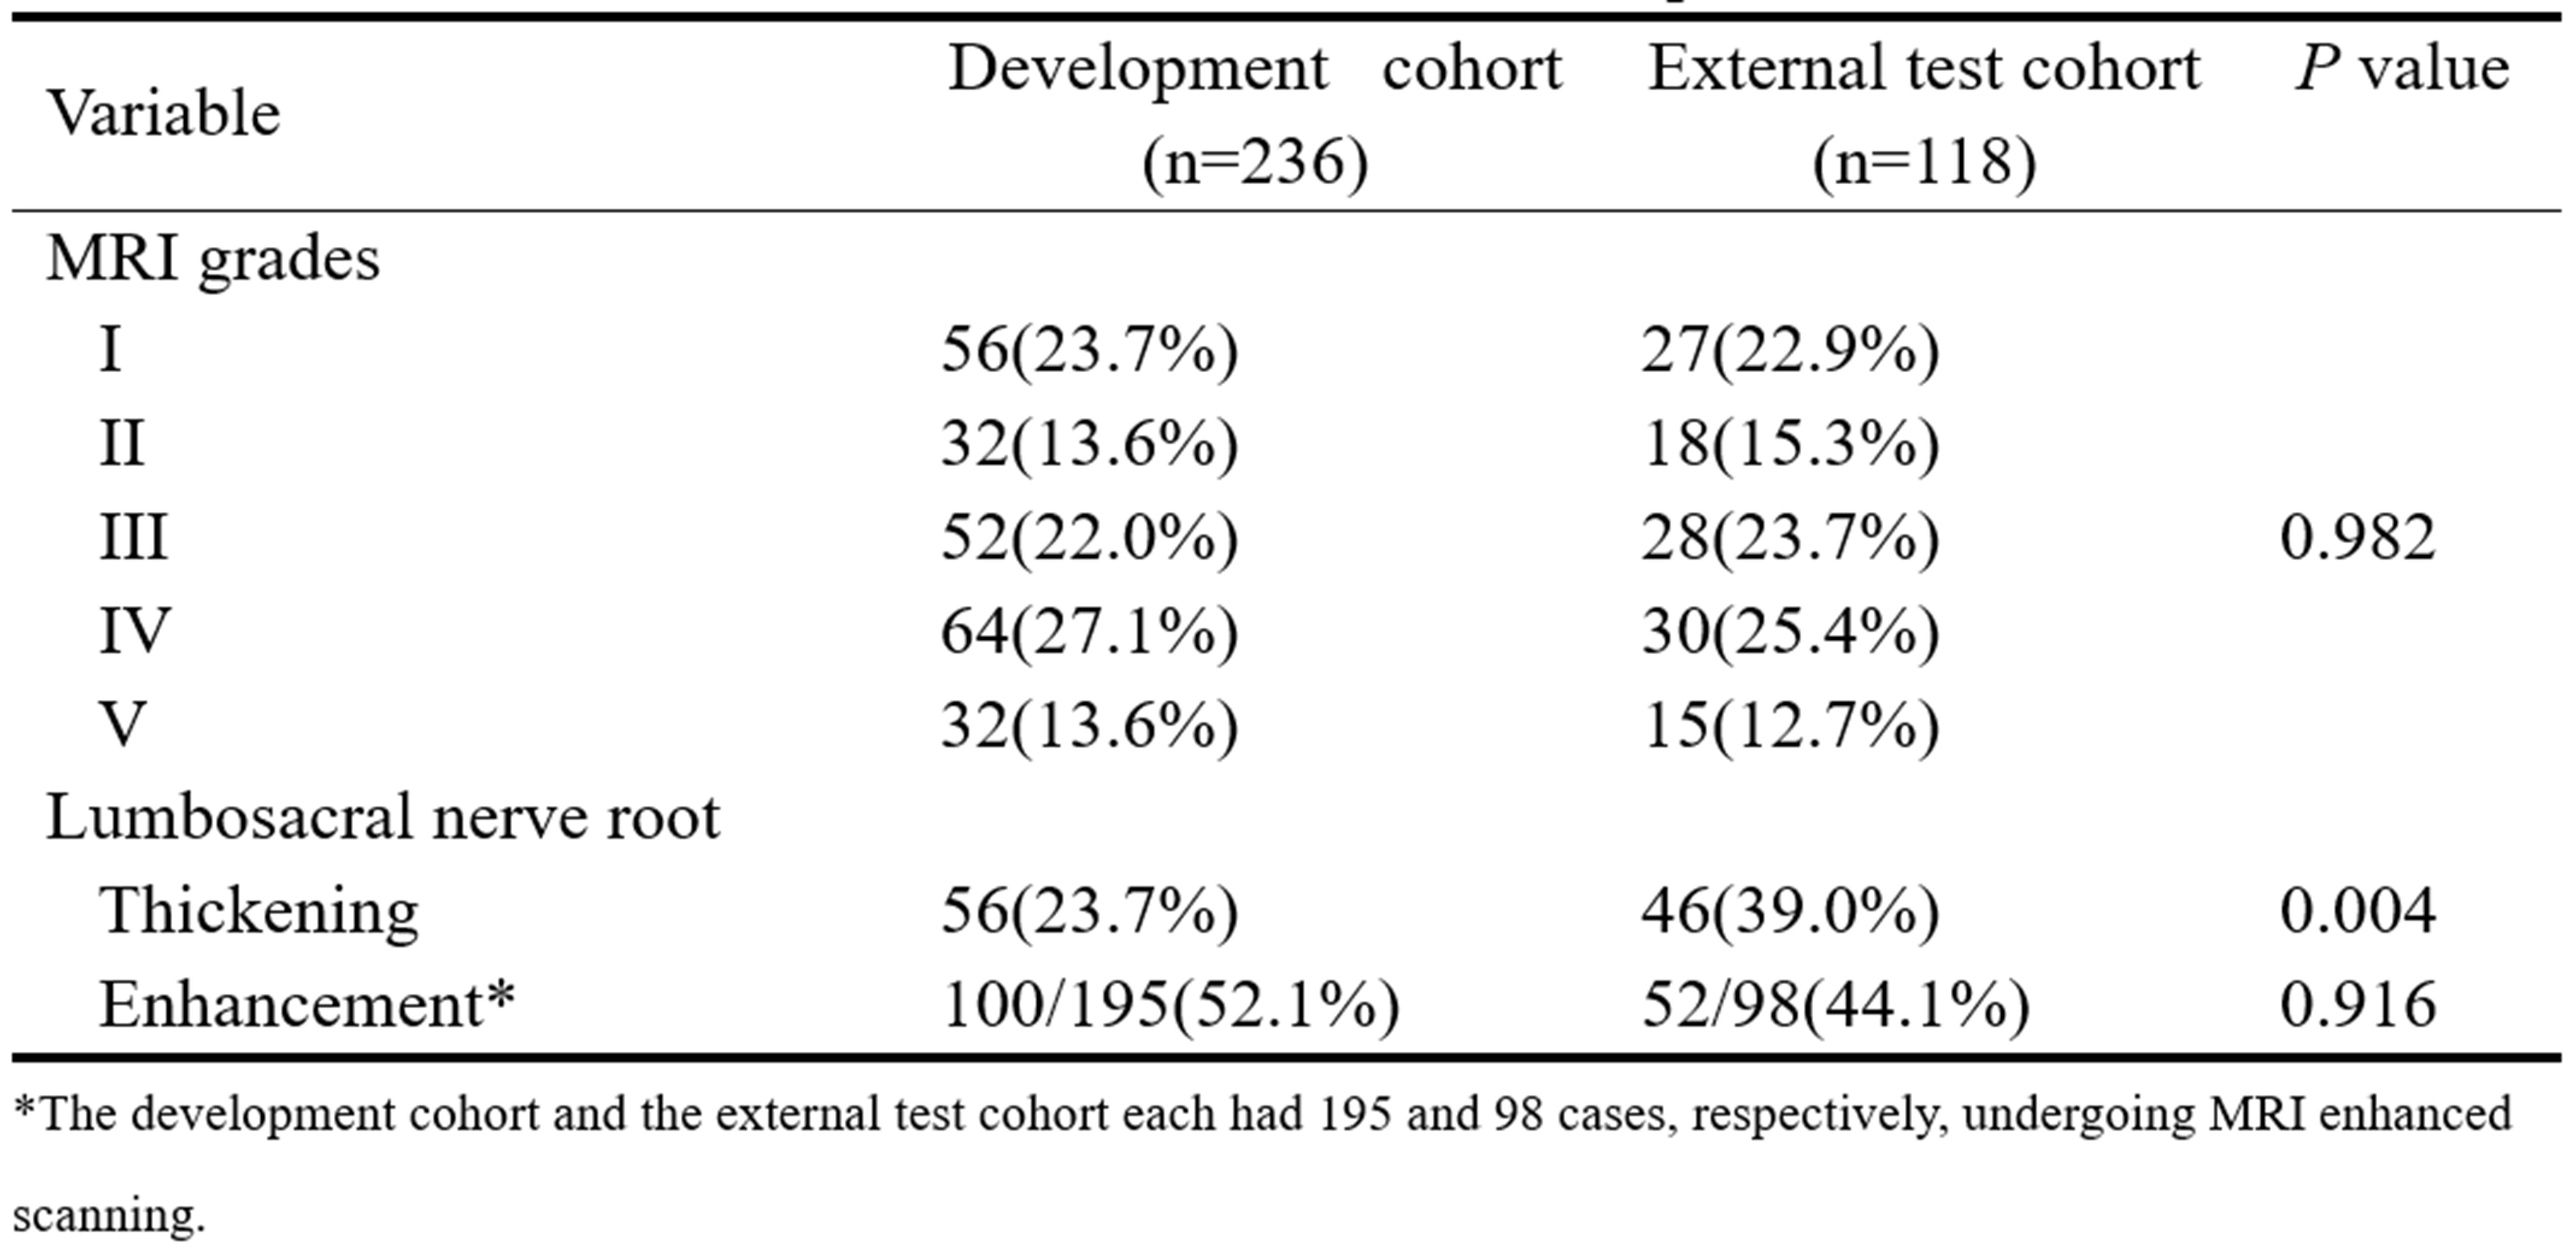
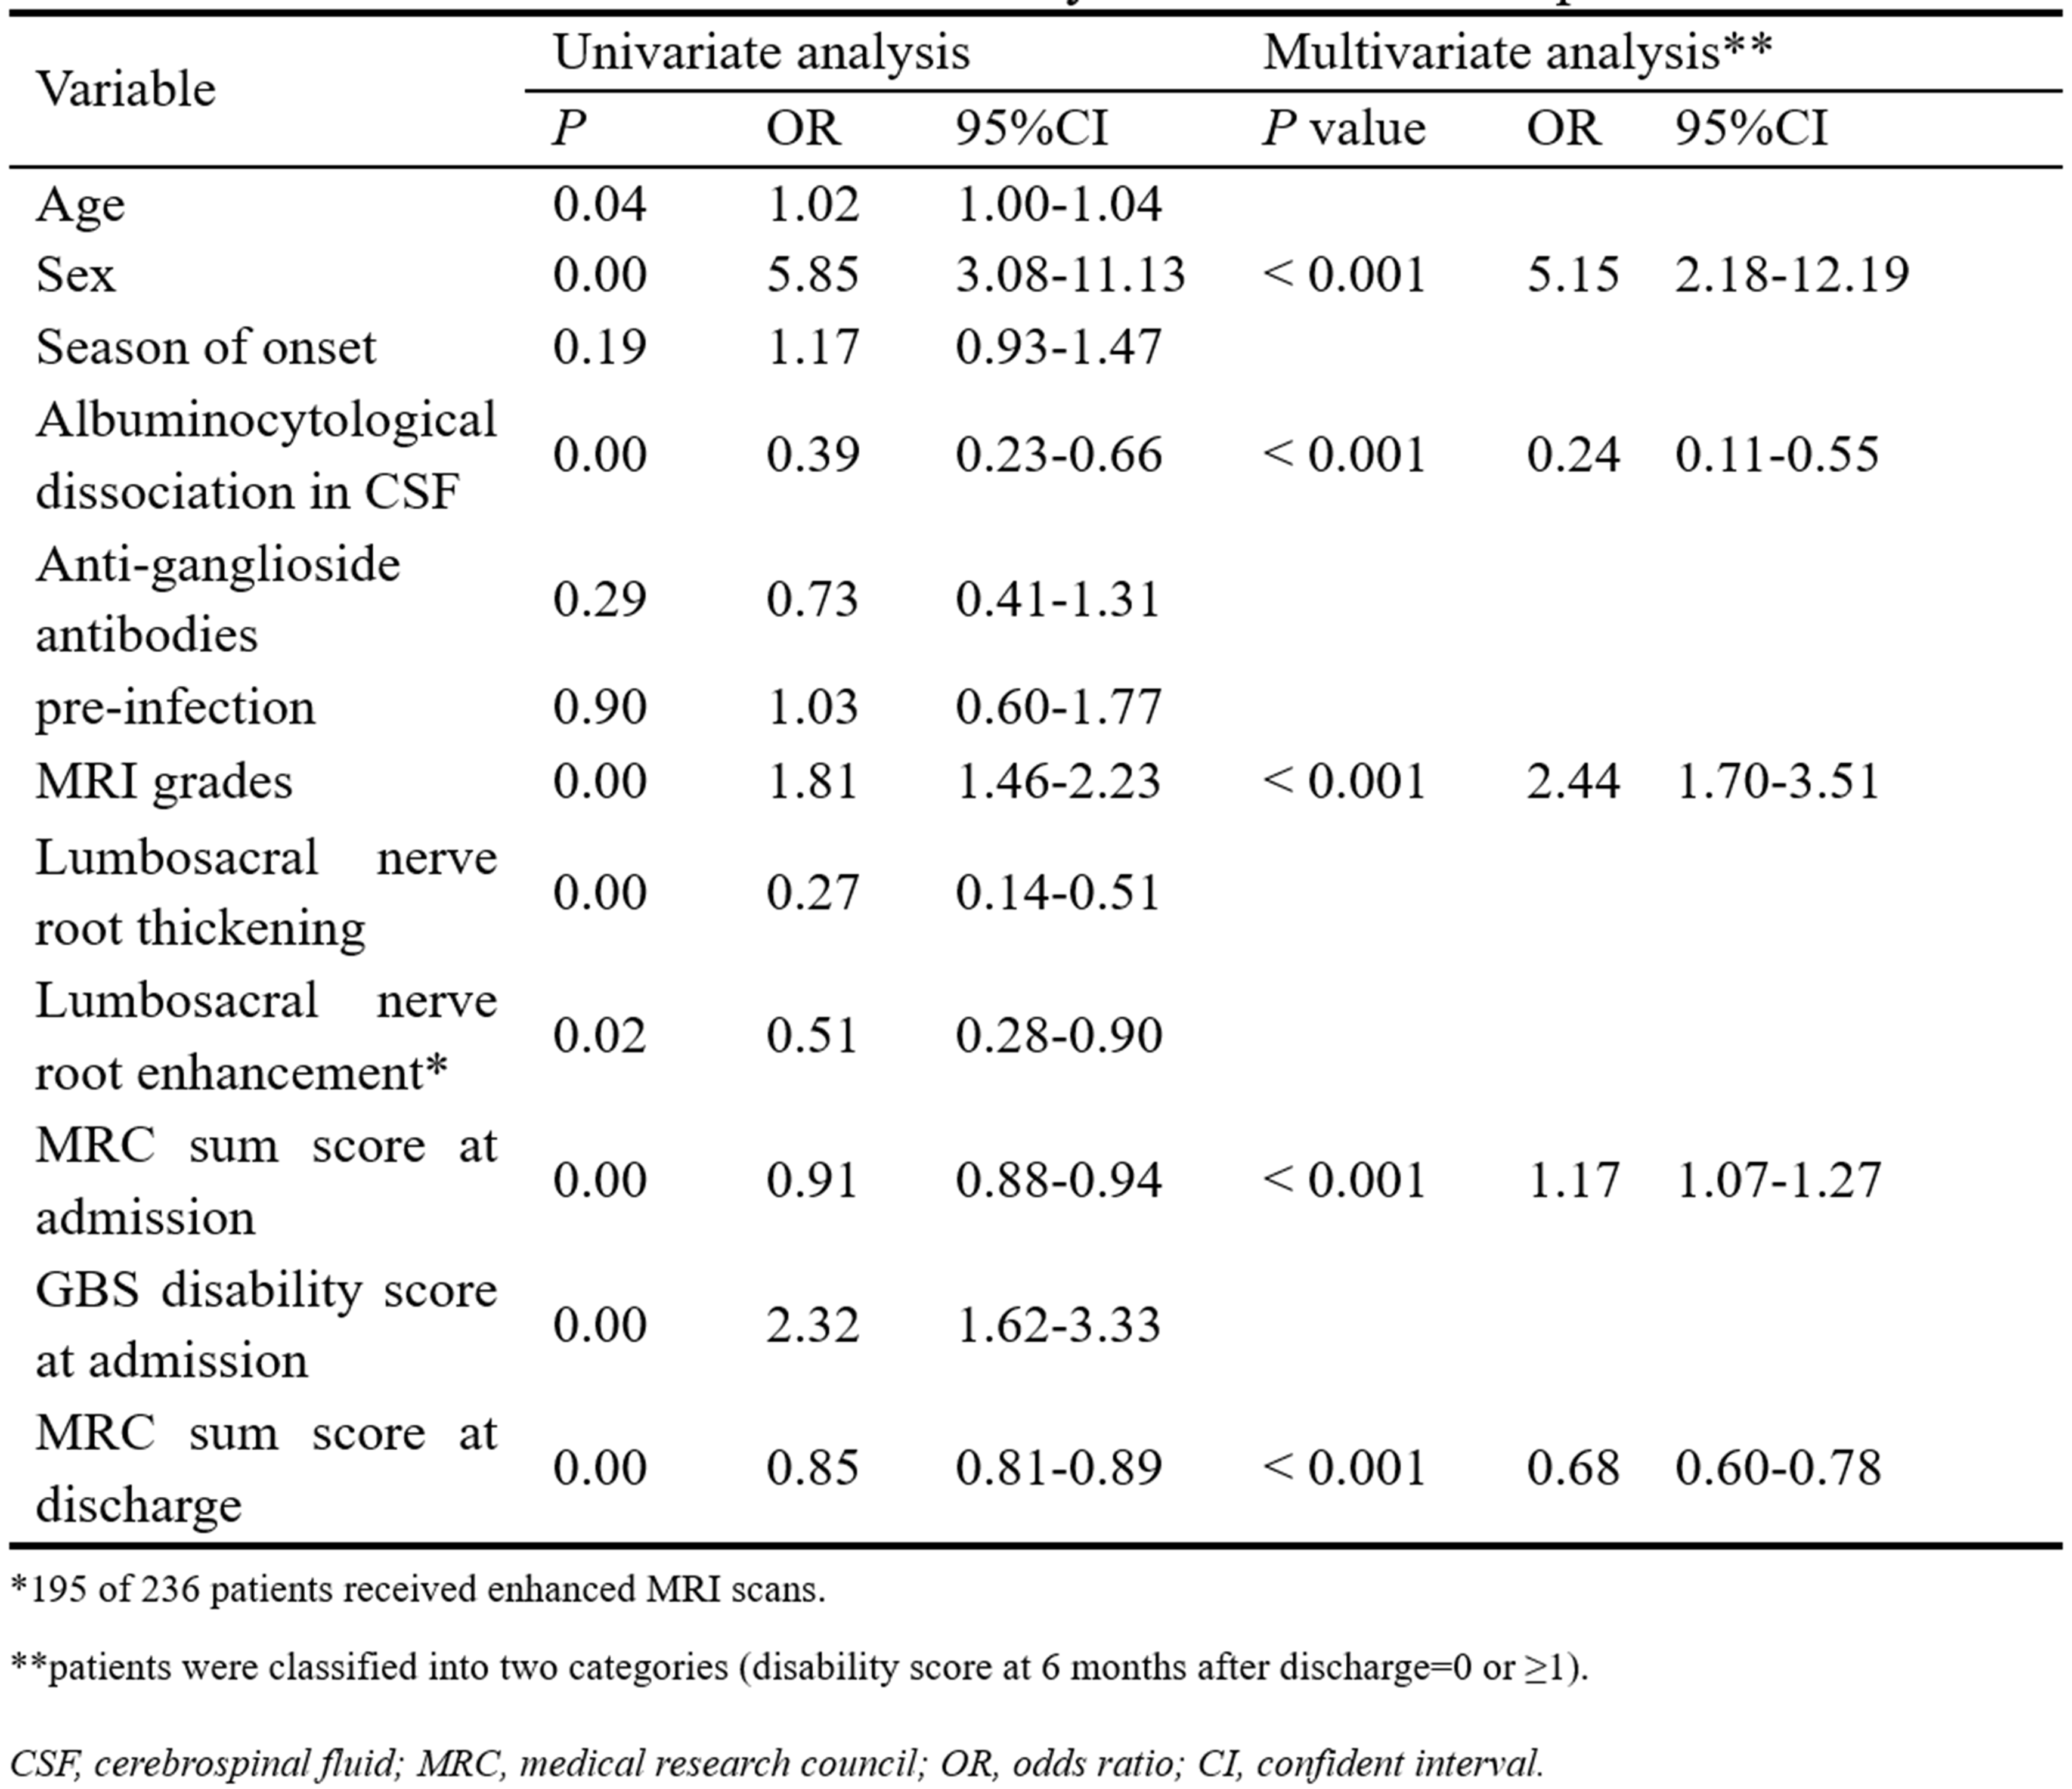
In the study of 354 patients with GBS, two cohorts—Institute 1's development cohort (n=236) and Institute 2's external test cohort (n=118)—demonstrated improved mobility from 39.5% initially non-ambulatory to 3.1% at six months, and 46.9% were fully recovered. MRI scans revealed lumbosacral nerve root enhancement in 52.1% and 44.1% and thickening in 23.7% and 39.0% of the development and test cohorts, respectively. The intra- and inter-observer consistency was high (ICC :0.937 and 0.892). The distribution of patients in each grade according to the established MRI edema grading criteria for the development cohort and external test cohort is shown in Table 1.Multivariable analysis demonstrated five prognostic factors: gender, CSF albumin-cytological dissociation, MRI grading score, and MRC sum scores at admission and discharge. The logistic regression analysis results are summarized in Table 2. The clinical-MRI model including MRI grading was more accurate (development: 91.13%, test: 90.56%) than the clinical model (development: 87.1%, test: 83.96%) with superior AUC (development: 0.94 vs 0.89, test: 0.97 vs 0.84), emphasizing the predictive value of integrated MRI grading scores. The results are shown in Figure 3.
Discussion and conclusions
In this retrospective study, MRI grading scores were identified as significant independent prognostic factors for GBS outcomes (odds ratio 2.44, p<0.001). They notably improved the prognostic accuracy of a clinical model, with an area under the receiver operating curve of 0.97, compared with 0.84 for the clinical model alone. The inclusion of MRI findings, specifically thickening and contrast enhancement of spinal nerve roots and cauda equina, alongside grading of muscle denervation edema, delineates our model. Our MRI grading criteria are based on the extent of muscle denervation edema, providing a simpler and faster diagnostic alternative to contrast-enhanced MRI with a higher positive rate than nerve root findings.The MRI grading scores of muscle denervation edema in the lumbosacral region could be a potential prognostic risk factor for GBS and significantly improve the prognostic performance of independent clinical model in predicting GBS prognosis.
Acknowledgements
None
References
1. Sejvar, James J., Katrin S. Kohl, Jane Gidudu, Anthony Amato, Nandini Bakshi, Roger Baxter, Dale R. Burwen, et al. 2011. “Guillain–Barré Syndrome and Fisher Syndrome: Case Definitions and Guidelines for Collection, Analysis, and Presentation of Immunization Safety Data.” Vaccine 29 (3): 599–612. https://doi.org/10.1016/j.vaccine.2010.06.003.
2. Shahrizaila, Nortina, Helmar C Lehmann, and Satoshi Kuwabara. 2021. “Guillain-Barré Syndrome.” The Lancet 397 (10280): 1214–28. https://doi.org/10.1016/S0140-6736(21)00517-1.
3. Soysal, A., F. Aysal, B. Calıskan, P. Dogan Ak, B. Mutluay, N. Sakallı, S. Baybas, and B. Arpacı. 2011. “Clinico-Electrophysiological Findings and Prognosis of Guillain-Barré Syndrome - 10 Years’ Experience: Guillain-Barré Syndrome-10 Years’ Experience.” Acta Neurologica Scandinavica 123 (3): 181–86. https://doi.org/10.1111/j.1600-0404.2010.01366.x.
4. Willison, Hugh J, Bart C Jacobs, and Pieter A Van Doorn. 2016. “Guillain-Barré Syndrome.” The Lancet 388 (10045): 717–27. https://doi.org/10.1016/S0140-6736(16)00339-1.
5. Van Koningsveld, Rinske, Ewout W Steyerberg, Richard Ac Hughes, Anthony V Swan, Pieter A Van Doorn, and Bart C Jacobs. 2007. “A Clinical Prognostic Scoring System for Guillain-Barré Syndrome.” The Lancet Neurology 6 (7): 589–94. https://doi.org/10.1016/S1474-4422(07)70130-8.
6. Yikilmaz, Ali, Selim Doganay, Hakan Gumus, Huseyin Per, Sefer Kumandas, and Abdulhakim Coskun. 2010. “Magnetic Resonance Imaging of Childhood Guillain–Barre Syndrome.” Child’s Nervous System 26 (8): 1103–8. https://doi.org/10.1007/s00381-010-1197-8.
Figures