2335
4D PC-MRI for CSF dynamics of the cervical, thoracic and lumbar spine: a feasibility study1Invicro, London, United Kingdom, 2Eli Lilly and Company, Cambridge, MA, United States, 3Invicro, Needham, MA, United States, 4Invicro, Needham, MA, United Kingdom
Synopsis
Keywords: Spinal Cord, Velocity & Flow, CSF
Motivation: Understanding the fluid mechanics of the cerebrospinal (CSF) flow is important for creating more accurate models of flow dynamics in intrathecal drug delivery systems.
Goal(s): We assess the feasibility of measuring with high-temporal resolution 3-directional CSF flow across all sections of the spine in healthy volunteers.
Approach: We report peak-to-peak velocity, peak velocity, flow rate, total displacement, and display velocity vector fields for the CSF across the three spinal sections.
Results: 3-directional CSF flow of the full spine can be measured with MRI. Our observations revealed varying CSF velocity profiles across three sections of the spine, indicating distinct pressure mechanisms along its length.
Impact: Recent research have focused on the development of novel therapeutic strategies for CNS drug delivery though intrathecal space modelling. To achieve this and establish better boundary conditions, more precise measurements of spinal CSF flow through MRI are required.
Introduction
Measuring changes in cerebrospinal fluid (CSF) flow and volume are important in diseases such as normal pressure hydrocephalus or Chiari I malformation, but also to create more accurate models of flow dynamics for intrathecal drug delivery. Flow-sensitive MRI using phase-contrast techniques (PC-MRI) can be applied to measure the CSF flow in the spine1–3.According to the conventional Monro-Kellie doctrine4, CSF flows upwards in the cranial direction and downwards to caudal compartments of the spine within each cardiac cycle in a closed system. However, more recent investigations5 revealed that the CSF pulsatile flow maybe generated by a number of mechanisms distinct across different segments of the spine, in which there is increasing downward flow from the thoracic spine, local production, and production or resorption from the cord below.
4D PC-MRI has increasingly been appreciated for its potential to analyze complex flow phenomena within the heart and blood vessels, but only with a few applications for CSF flow patterns in the cervical spinal canal6,7. Here we apply PC-MRI with high temporal resolution for measuring CSF velocity in three cartesian directions across the spine (cervical, thoracic, and lumbar sections) on healthy individuals and report peak-to-peak velocity amplitude, peak velocity, flow-rate, total displacement, and display velocity vector fields for the CSF across the three spinal sections.
Materials and Methods
Four healthy controls, HC, (2 male, 35±5 y.o.) with similar body structure (weight=72.2±11.4kg; height=1.71±0.08m) were scanned on a 3T scanner (Trio, Siemens). Transverse, ECG-triggered, PC-MRI was acquired at the middle of the C2, T8 and L4 spinal vertebrae, with velocity encoding set to foot-head, right-left and anterior-posterior directions (C2&T8 stations: vENC=10cm/s; L4 station: vENC=5cm/s), TE/TR=5.68-7.72/21-35ms, flip-angle=15⁰, slices=2, resolution=0.94x0.94x5mm3, iPAT=3, and approximately 40 phases per heart-beat. For subjects HC2-HC4, 3-directional PC-MRI on the L4 station was also acquired with vENC=10cm/s. T2 scans matching parameters with the PC-MRI was collected for CSF segmentation.Data was analyzed with custom-made Matlab.v2022a scripts. Phase data was converted to velocity, corrected for phase drifts5,8 and temporally smoothed (gaussian kernel, sigma=2). Peak-to-peak amplitude (PTP-amp), peak velocity (Vmax) and total displacement (D) were measured as described in2. Flow-rate was determined as the PTP-amp in the average cross-sectional area. 3D velocity vector fields were plotted for visualization of the CSF flow patterns.
Results
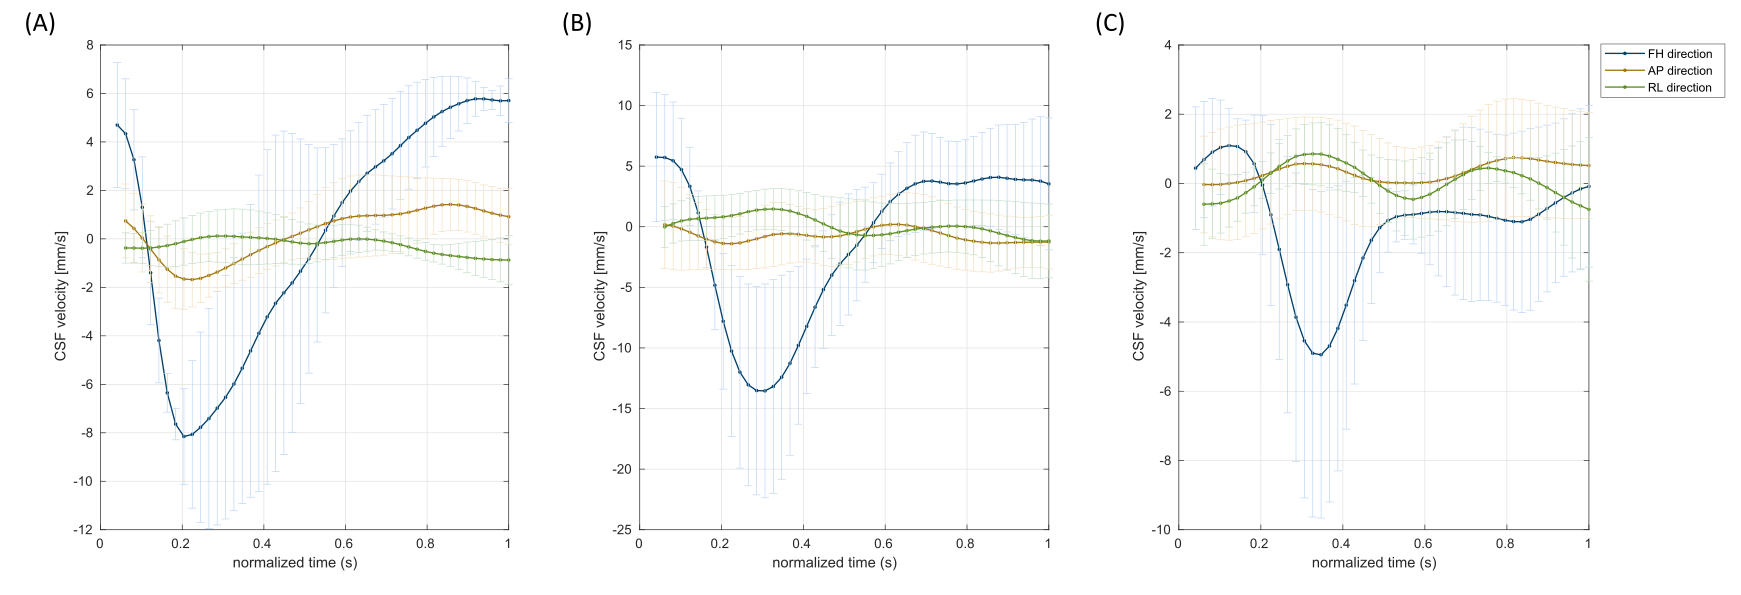
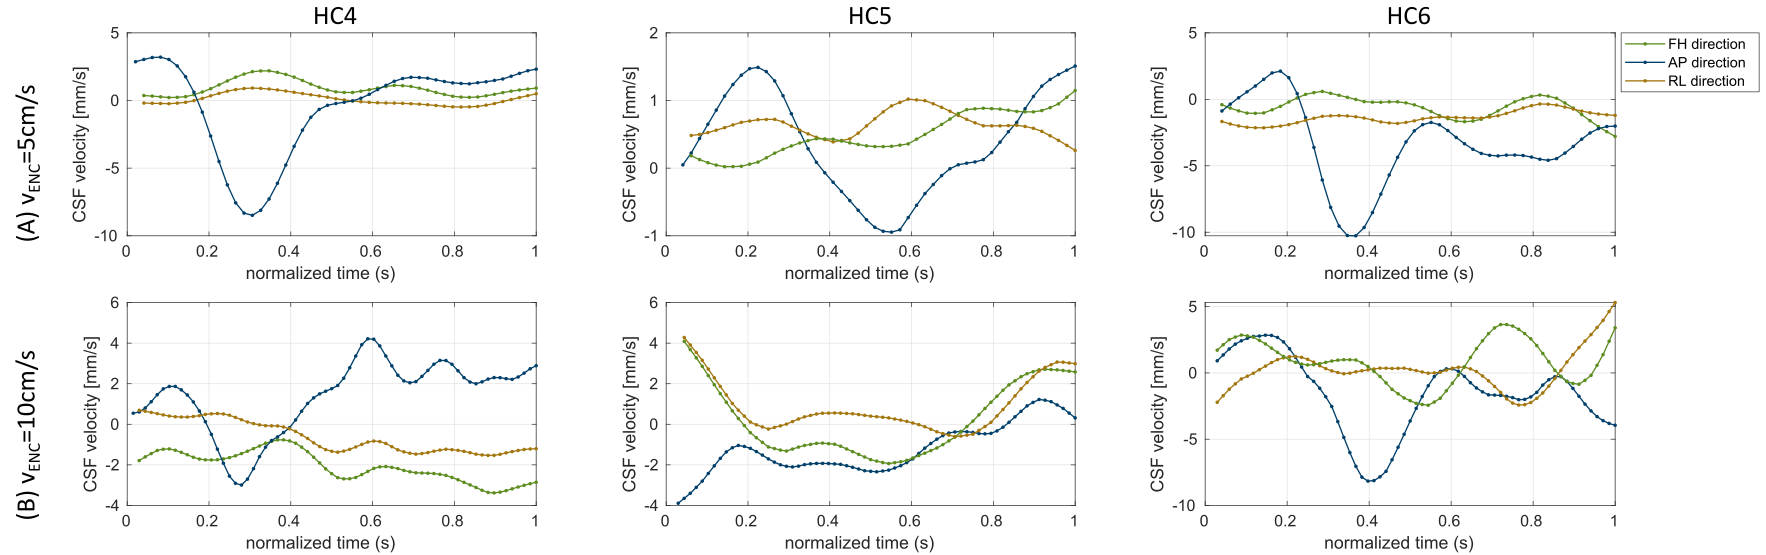
Figure 1 displays the average CSF velocity curves for all subjects for the three spine sections, and Table 1 shows the average measurements of flow-rate, Vmax, PTP-amp and D. PTP-amp was 1.2-fold and 3.3-fold higher at T8 compared to C2 and L4, respectively. However, because of the larger cross-sectional area (approximately 2-times higher) flow-rate was higher at C2 (0.81±0.12cm3/s) compared to T8 (0.52±0.35cm3/s). Flow-rate was lowest at L4 (0.22±0.13cm3/s). For all vertebrae, D was significantly higher for the foot-head direction compared to radial (average DFH=0.43mm vs average DAP&RL=0.16mm; Wilcoxon-test, p=0.0014).When comparing the lumbar measurements with the two vENC values (Figure 2), CSF velocity profiles were more consistent with vENC=5cm/s showing lower standard-deviation across all subjects in all metrics (e.g. PTP-amp at vENC=10cm/s was 0.79±3.80cm/s, and with vENC=5cm/s 2.94±1.25cm/s).
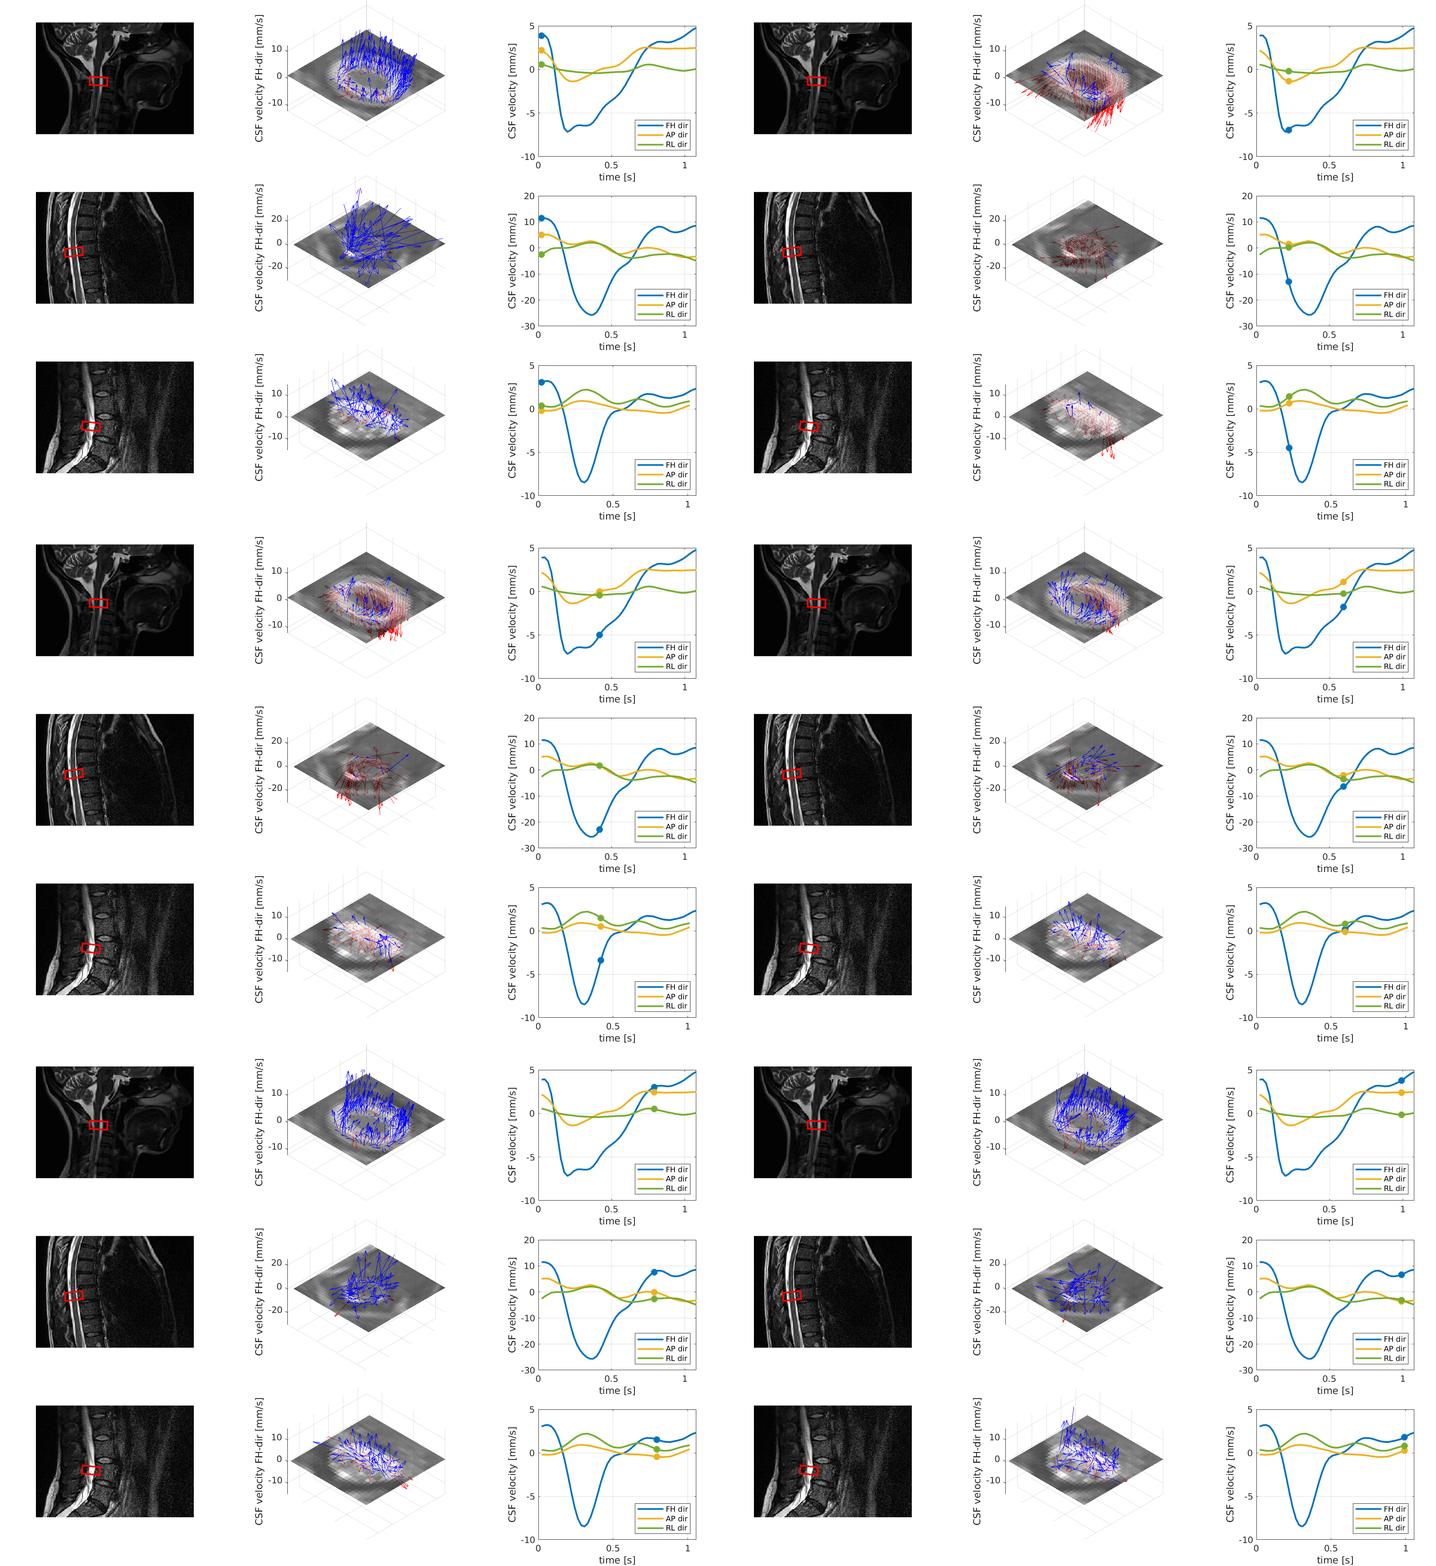
Velocity vector fields show dominant foot-head flow, but also a significant anterior-posterior velocity on the systolic phase for C2 and T8 sections (Figure 3). The velocity vector field for the lumbar section shows significant foot-head flow, but a less defined radial flow.
Discussion and COncusion
In this work we assessed the feasibility of phase-contrast MRI in healthy volunteers for evaluating the 3-directional flow of CSF across the spine. Measurements in the cervical spine were in line with literature2 with the exception of total displacement. This might be due to analysis, particularly the offset correction used in this study, compared to Wolf et al. Flow was maximal in the foot-head/through-plane direction, with a large negative velocity peak in the systolic phase and positive velocity in the diastolic phase for both cervical, thoracic and lumbar measurements. For radial profiles, a negative anterior-posterior velocity was also observed on the cervical and thoracic, with minimal right-left velocity during the systolic phase for all subjects. The lumbar section shows smaller peak velocities with non-dominant radial profile. On the lumbar region, encoding of smaller velocities with a lower vENC improved velocity time courses.3-directional CSF flow of the full spine can be measured with MRI. Our observations revealed varying CSF velocity profiles across three sections of the spine, indicating distinct pressure mechanisms along its length. Our future work will focus on expanding our subject pool, with addition of test-retest reliability measurements, for a better understanding of the varying 3-directional curve profiles across the spine.
Acknowledgements
The authors would like to thank the volunteers who gave their time to participate in this study.References
1. Wymer, D. T., Patel, K. P., Burke, W. F. & Bhatia, V. K. Phase-contrast MRI: Physics, techniques, and clinical applications. Radiographics 40, 122–140 (2020).
2. Wolf, K. et al. Focal cervical spinal stenosis causes mechanical strain on the entire cervical spinal cord tissue – A prospective controlled, matched-pair analysis based on phase-contrast MRI. NeuroImage Clin. 30, (2021).
3. Beltrán, S. et al. Spinal cord motion and CSF flow in the cervical spine of 70 healthy participants. NMR Biomed. e5013 (2023) doi:10.1002/nbm.5013.
4. Benson, J. C., Madhavan, A. A., Cutsforth-Gregory, J. K., Johnson, D. R. & Carr, C. M. The Monro-Kellie Doctrine: A Review and Call for Revision. Am. J. Neuroradiol. 44, 2–6 (2023).
5. Bert, R. J. et al. The relationships among spinal CSF flows, spinal cord geometry, and vascular correlations: evidence of intrathecal sources and sinks. Am. J. Physiol. - Regul. Integr. Comp. Physiol. 317, R470–R484 (2019).
6. Bunck, A. C. et al. Magnetic resonance 4D flow characteristics of cerebrospinal fluid at the craniocervical junction and the cervical spinal canal. Eur. Radiol. 21, 1788–1796 (2011).
7. Heidari Pahlavian, S. et al. Accuracy of 4D Flow Measurement of Cerebrospinal Fluid Dynamics in the Cervical Spine: An In Vitro Verification Against Numerical Simulation. Ann. Biomed. Eng. 44, 3202–3214 (2016).
8. Gatehouse, P. D. et al. A
multi-center inter-manufacturer study of the temporal stability of
phase-contrast velocity mapping background offset errors. J. Cardiovasc.
Magn. Reson. 14, 1–7 (2012).
Figures