2331
Quantitative CEST and qMT MRI as Biomarkers of Response to Anti-Inflammatory Therapy in Rat Contusion Spinal Cord Injury1Biomedical Engineering, Vanderbilt University, Nashville, TN, United States, 2Vanderbilt University Institute of Imaging Science, Vanderbilt University Medical Center, Nashville, TN, United States
Synopsis
Keywords: Spinal Cord, Spinal Cord, CEST, qMT
Motivation: To evaluate quantitative MRI metrics as biomarkers of spinal cord injury treatment effects in a rat contusion model.
Goal(s): Determine the efficacy of Riluzole on SCI inflammation and myelination and quantify concomitant changes in MRI parameters longitudinally in treated and control animals.
Approach: We acquired CEST and qMT MR images in anesthetized rats after a lumbar contusion injury, and quantified longitudinal changes associated with neuroinflammation and demyelination for 8 weeks in Riluzole treatment and controls animals.
Results: Increase in CEST (3.5 ppm) APT concentration and PSR values were correlated with Riluzole effect, indicating their utility as biomarkers for treatment response.
Impact: The use of quantitative MRI imaging can be used to non-invasively probe SCI treatment efficacy in pre-clinical studies. This will improve and further the development of novel SCI treatments.
Introduction
Spinal cord injury (SCI) severity and recovery progression are influenced by post-injury neuroinflammation, which is consequently the target of therapeutic drugs. The neuroprotective drug Riluzole1 has been shown in pre-clinical studies to reduce neurotoxic glutamate concentrations post-injury, and improve motor function recovery. We applied multi-parametric quantitative chemical exchange saturation transfer imaging (CEST) and quantitative Magnetization Transfer (qMT) to monitor myelin and other molecular changes in SCI rats treated with Riluzole, in order to determine the efficacy of Riluzole on spinal cord inflammation and myelination status and validate the utility of MRI metrics as biomarkers of treatment responses.Methods
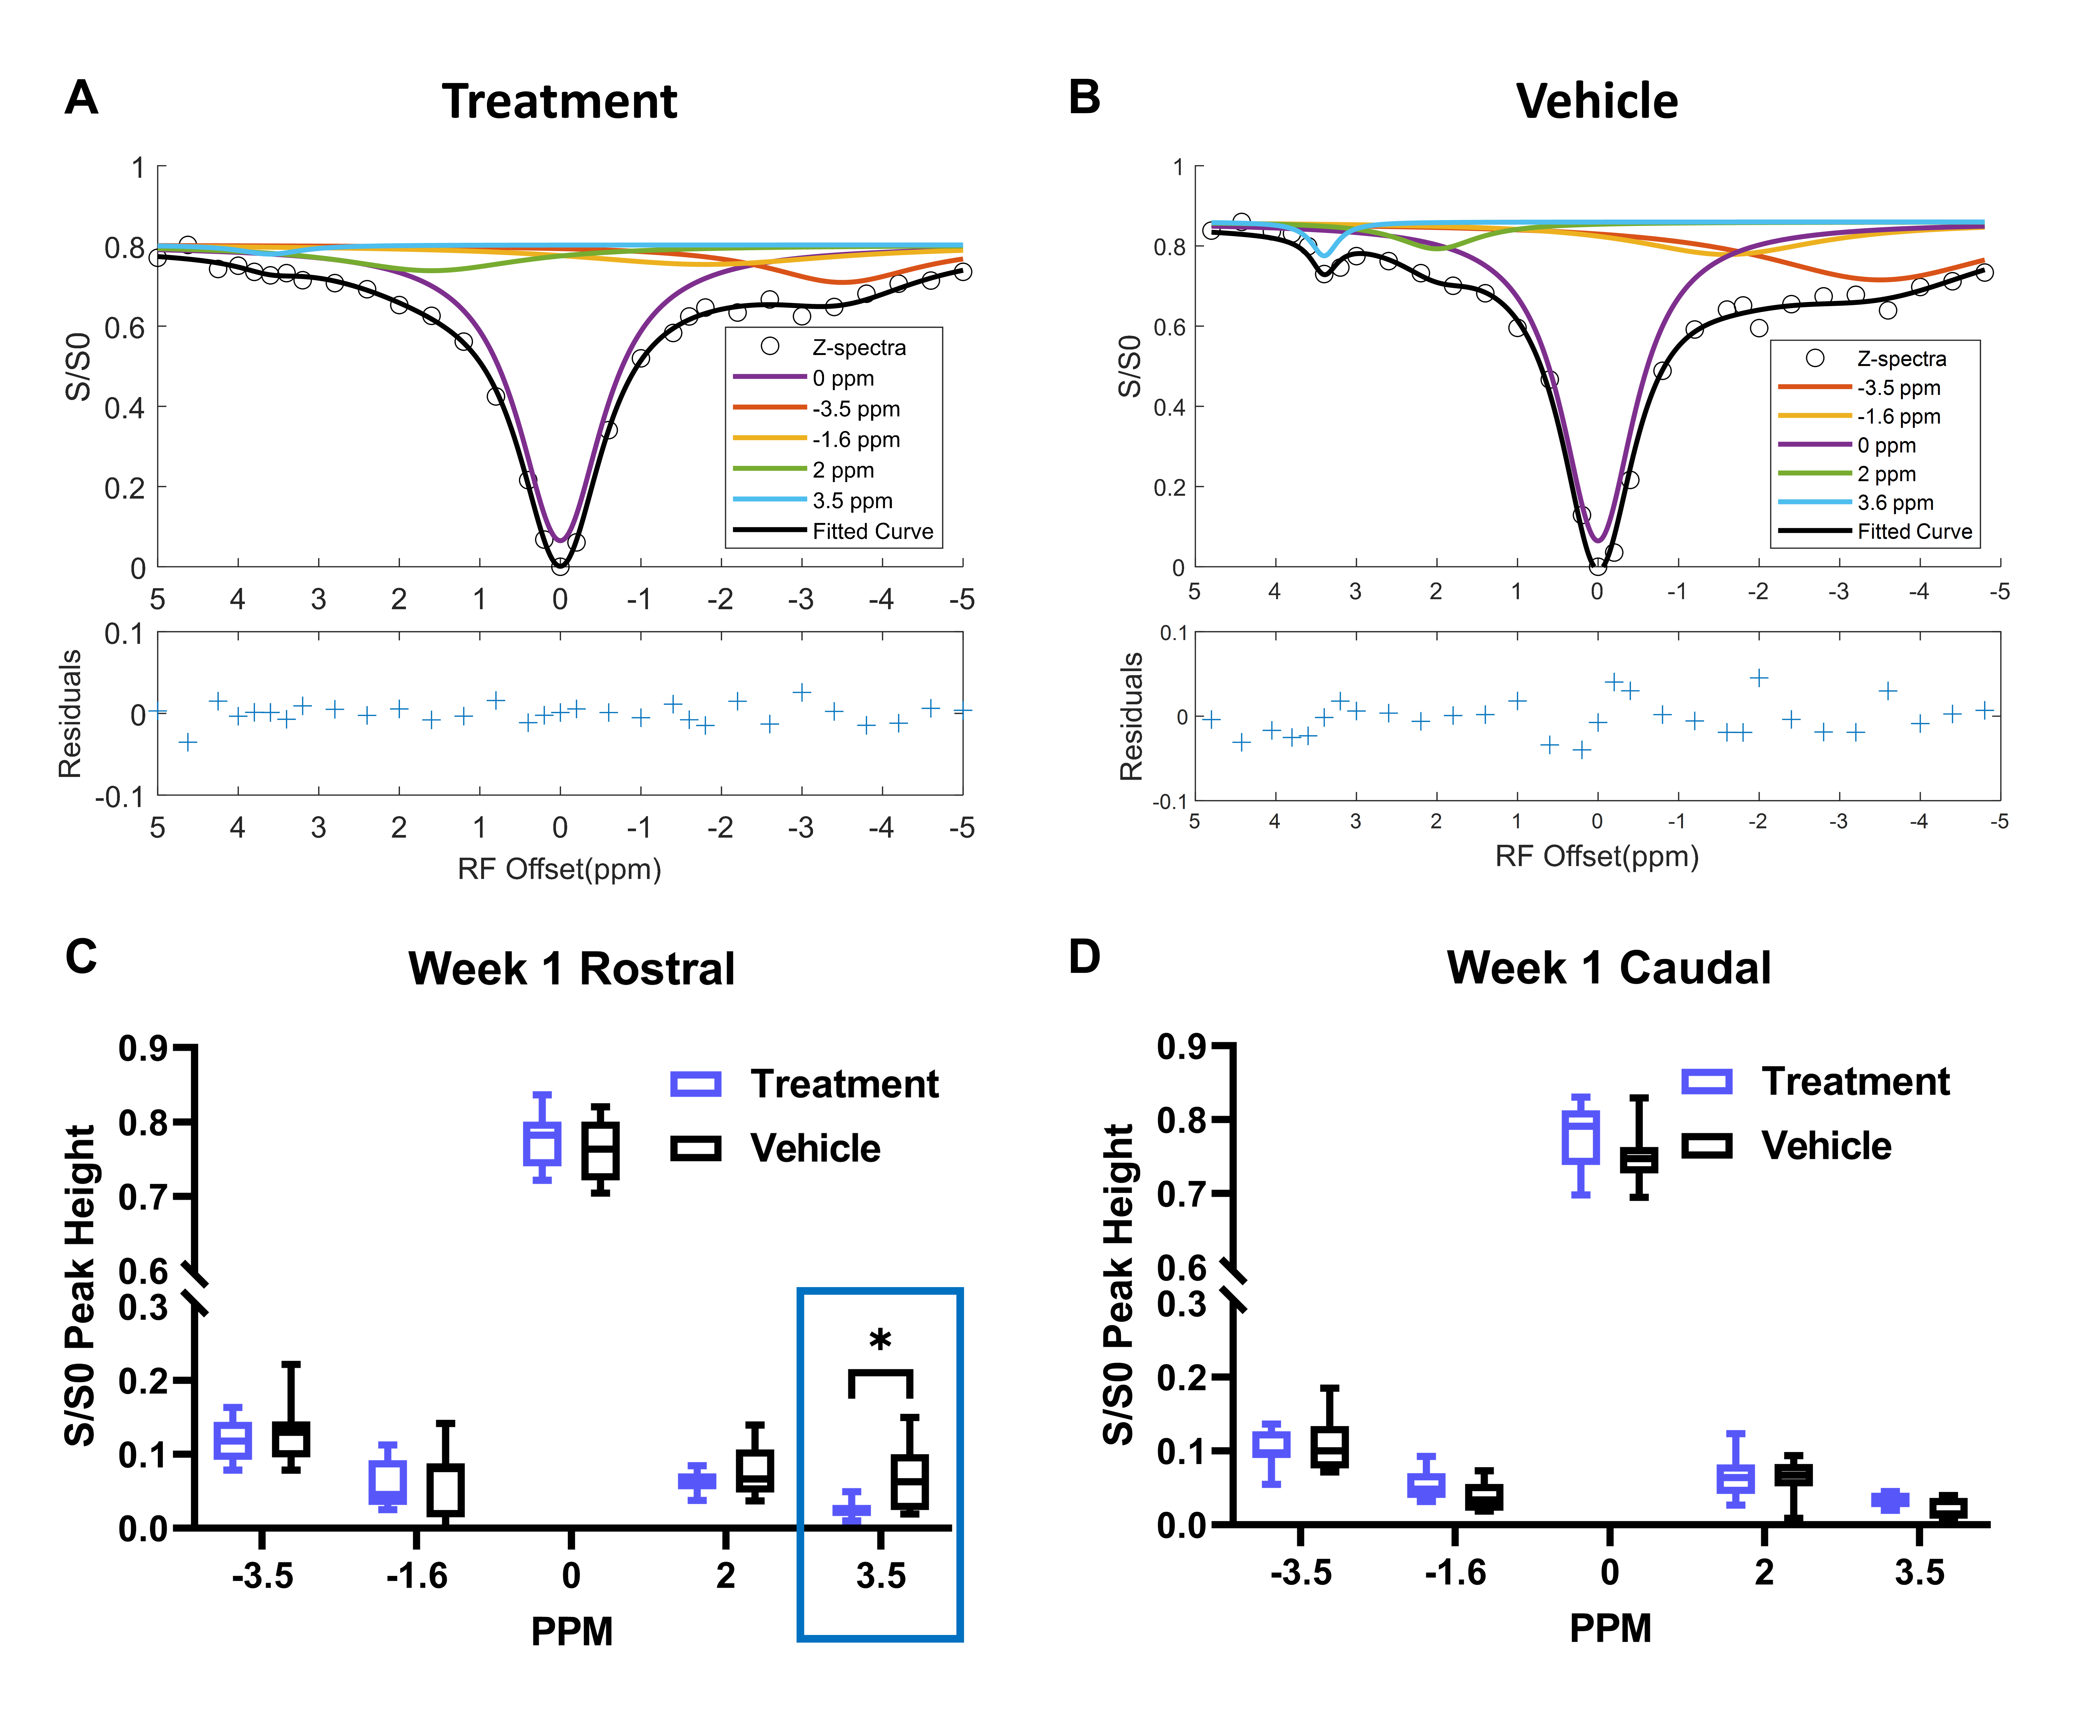
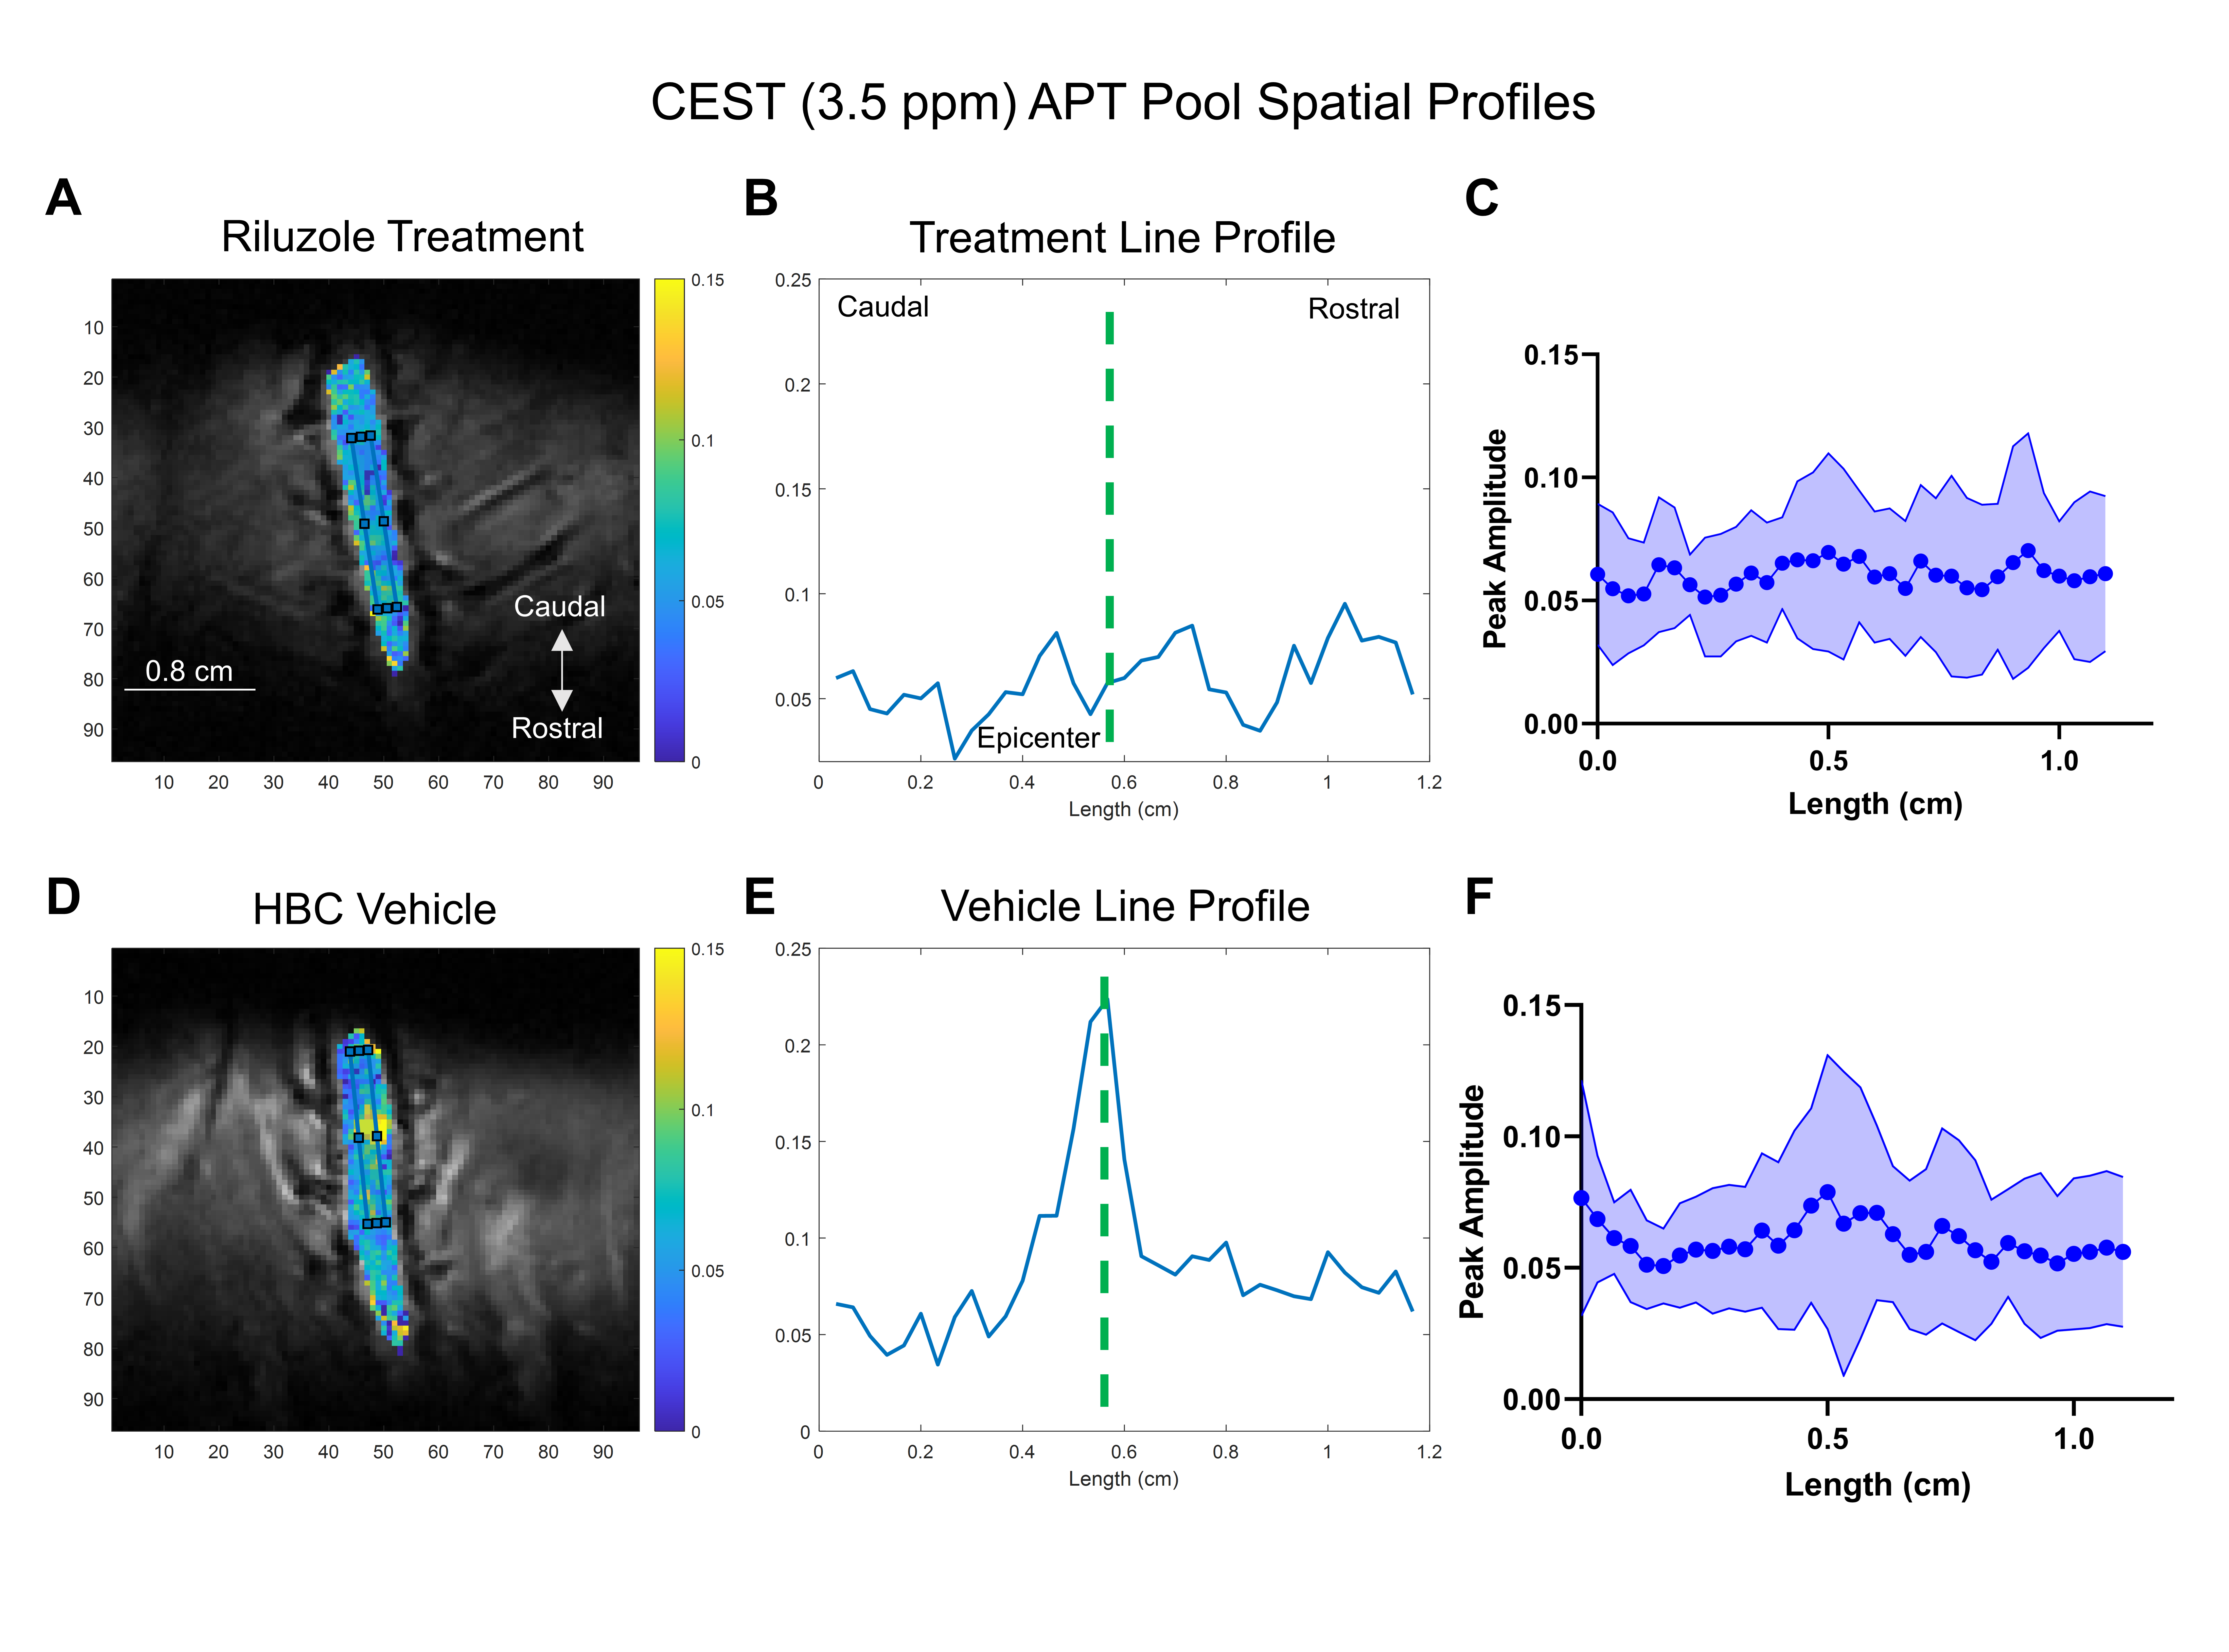
We used CEST and qMT to quantify longitudinal changes associated with neuroinflammation and demyelination in a contusion lumbar (L1) SCI rodent model over 8 weeks post-injury. Two groups of rats were compared: a treatment group (N=8) receiving intraperitoneal injections of Riluzole, and a vehicle group (N=7) treated with 2-hydroxypropyl-β-cyclodextrin (HBC), a solubilizer used to dissolve Riluzole into solution form, as described in Wu et. al1.Quantitative CEST and qMT imaging data were collected on a Magnex horizontal 9.4T magnet using a BrukerTM console. We used a standard CEST sequence with a 2s rectangular irradiation pulse, followed by a 2-shot spin-echo echo-planar readout (TR/TE = 3000/30ms; FOV = 32×32mm2; Matrix size = 96x96; Slice thickness = 3mm (axial), 0.8mm (coronal)). 33 RF offsets were chosen to densely sample around specific pools of interest between -5.0 to 5.0 ppm (-2000 to 2000 Hz). Two axial slices were chosen, one rostral and one caudal to the injury, and 1 coronal slice. Axial image ROIs were drawn in spinal cord gray matter to generate Z-spectra that were subsequently fit to a 5-pool Lorentzian peak model, corresponding to molecular pools at -3.5 and -1.6 ppm (NOE), 0 ppm (free water), 2.0 ppm (amine), and 3.5 ppm (amide proton transfer APT) RF Offsets. Coronal orientation CEST images were used to generate spatial maps for each molecular pool. Spatial profile comparisons were performed by drawing a 1.2 cm length rectangular ROI with the injury epicenter at the ROI midpoint, to generate line profiles of CEST molecular pool maps.

The qMT axial orientation images were acquired using Gaussian saturation pulses at two saturation powers (flip angle = 820°, 220°), and 8 logarithmically scaled RF offsets from 1000 - 80000 Hz, and an additional at 6000 Hz. The MRI parameters used were: TR/TE=28/2.97ms, NEX=8, FOV=32×32mm2; Matrix size=128x128; Slice thickness = 3mm (axial). qMT imaging data were fit using the Henkelman-Ramani2 two-pool model, to calculate pool size ratio (PSR), the ratio of macromolecular and free water pools. ROI-based analysis was used to calculate average PSR values in SCI white matter voxels.
Results
The axial orientation CEST Z-spectra fitting results indicated a significant decrease in the CEST (3.5 ppm) APT pool amplitude at Week 1 post-SCI for the Riluzole treatment group, rostral to the injury site, compared to the vehicle group (Figure 1). Week 1 CEST (3.5 ppm) APT maps in the coronal orientation (Figure 2) also indicate increased peak amplitude at the injury epicenter for vehicle rats, which is not observed in treatment rats. Week 1 qMT PSR maps acquired from Riluzole treatment rats showed significantly increased PSR values at the injury epicenter for treatment rats compared to vehicle (Figure 3). The vehicle group PSR maps also highlighted decreased gray matter/white matter boundary integrity, indicated by lack of contrast between tissue types, as opposed to the treatment rat PSR maps, where distinction between gray/white matter boundaries is evident.Discussion
The Riluzole-treated SCI rats showed decreased APT pool amplitude at the injury region, compared to the vehicle group. The CEST APT pool likely reflects small peptides and molecules related to the neuroinflammatory processes3. Neurotoxic glutamate activity may lead to breakdown of membrane proteins, causing increased APT pool concentration measured using CEST, and is reduced by the use of Riluzole. The macromolecular pool content measured using PSR values quantifies relative spinal cord myelin content in white matter4. The Riluzole treatment group had increased PSR values at the injury epicenter compared to the vehicle group. This suggests that Riluzole may reduce post-SCI demyelination. Together, changes in CEST APT concentration and PSR were correlated with effects of Riluzole, indicating their utility as biomarkers for responses to treatments.Conclusion
The results show that quantitative MR can provide structural and molecular biomarkers of neuroinflammation and demyelination that differentiate between animals treated with and without Riluzole. The application of non-invasive multi-parametric MRI can be used for quantifying SCI treatment efficacy and further the development of SCI treatments.Acknowledgements
One DoD grant (SC190134) funded the study. We thank Zou Yue and Chaohui Tang for their help in creating the injury model and assisting MRI scans.References
1. Wu, Y. et al. Delayed post-injury administration of riluzole is neuroprotective in a preclinical rodent model of cervical spinal cord injury. J. Neurotrauma 30, 441–452 (2013).
2. Ramani, A., Dalton, C., Miller, D. H., Tofts, P. S. & Barker, G. J. Precise estimate of fundamental in-vivo MT parameters in human brain in clinically feasible times. Magn. Reson. Imaging 20, 721–731 (2002).
3. By, S. et al. Amide proton transfer CEST of the cervical spinal cord in multiple sclerosis patients at 3T. Magn. Reson. Med. 79, 806–814 (2018).
4. Laule, C. et al. Magnetic Resonance Imaging of Myelin. Neurotherapeutics 4, 460–484 (2007).
Figures