2329
Right-left asymmetry in the cervical spinal cord using T1 mapping at 7T1Aix Marseille Univ, CNRS, CRMBM, Marseille, France, 2APHM, CHU Timone, Pôle d’Imagerie Médicale, CEMEREM, Marseille, France, 3iLab-Spine, International Associated Laboratory, Marseille-Montreal, France, 4NeuroPoly Lab, Institute of Biomedical Engineering, Polytechnique Montreal, Montréal, QC, Canada, 5Mila - Quebec AI Institute, Montréal, QC, Canada, 6Functional Neuroimaging Unit, CRIUGM, Université de Montréal, Montréal, QC, Canada, 7Centre de Recherche du CHU Sainte-Justine, Université de Montréal, Montréal, QC, Canada
Synopsis
Keywords: Spinal Cord, Quantitative Imaging, Spinal cord, T1map, Segmentation, Template, 7T
Motivation: Right-left differences in MR metrics can help identify pathological or specific regions of abnormalities. However, this requires investigating them first on a healthy population
Goal(s): To Investigate whether right-left spinal cord (SC) asymmetry can be identified in vivo and, if yes, determine in which specific regions
Approach: Right-left SC asymmetry was investigated based on cross-sectional area measurements and T1mapping derived from high-resolution 7T MRI and atlas-based segmentation with the AMU7T quantitative template
Results: Right-left T1 asymmetry in the cervical cord was evidenced in one-third of the AMU7T parcels, mostly in motor tracts, but not in lateral corticospinal tracts
Impact: High-resolution quantitative 7T MR imaging and dedicated template may help identify microstructural asymmetry in the spinal cord. Such findings may have to be considered in the future when investigating pathological cohorts
INTRODUCTION
Morphological, structural and functional right-left asymmetry in the brain has been reported, together with the existence of a cerebral asymmetry when comparing right-handed and left-handed subjects [1-3]. In the spinal cord (SC), an unbalance of corticospinal fiber count has been demonstrated postmortem with more fibers on the right and no direct relationship to handedness [4-5]. A morphological asymmetry of the spinal motor neuron cells innervating the upper limbs, with larger cells on the right [6] and a lateralization of motor neuron synaptic activity demonstrated by electromyographic measurements [7] have been reported as well. Handedness and laterality in vivo studies mostly relied on MRI , approached with different imaging modalities in the brain, including 1.5T anatomical [8], 3T functional [9], or 3T diffusion [10-11] MRI. In the SC, right-left asymmetry has been described using 3T fMRI, showing an ipsilateral relationship with handedness [12-13], while other studies relying on quantitative 3T MRI did not observe right-left differences [14-15], possibly because of a lack of sensitivity, or partial volume effect (PVE) contamination. In this context, ultra-high-field (UHF) SC MRI, which provides improved SNR, greater spatial resolution [16-18], and better delineation of gray/white matter (GM/WM) SC substructures [19-20], may open new perspectives, as recently demonstrated using the MP2RAGE sequence [20-21]. Quantitative T1, which is well-suited for in-vivo observation of microstructures [22], may be of particular interest to elucidate the myelin content [23-24]. Combined with AMU7T [25], a 3D quantitative template aligned in the PAM50[26] space recently build from high-resolution 7T images, based on precedent atlases[27-31], new possibilities are thus offered to conduct atlas-based segmentation analyses with refined parcels. The main objective of this study is to take advantage of these methodologies to investigate right-left asymmetry (morphological and/or microstructural) in the SC.MATERIALS AND METHODS
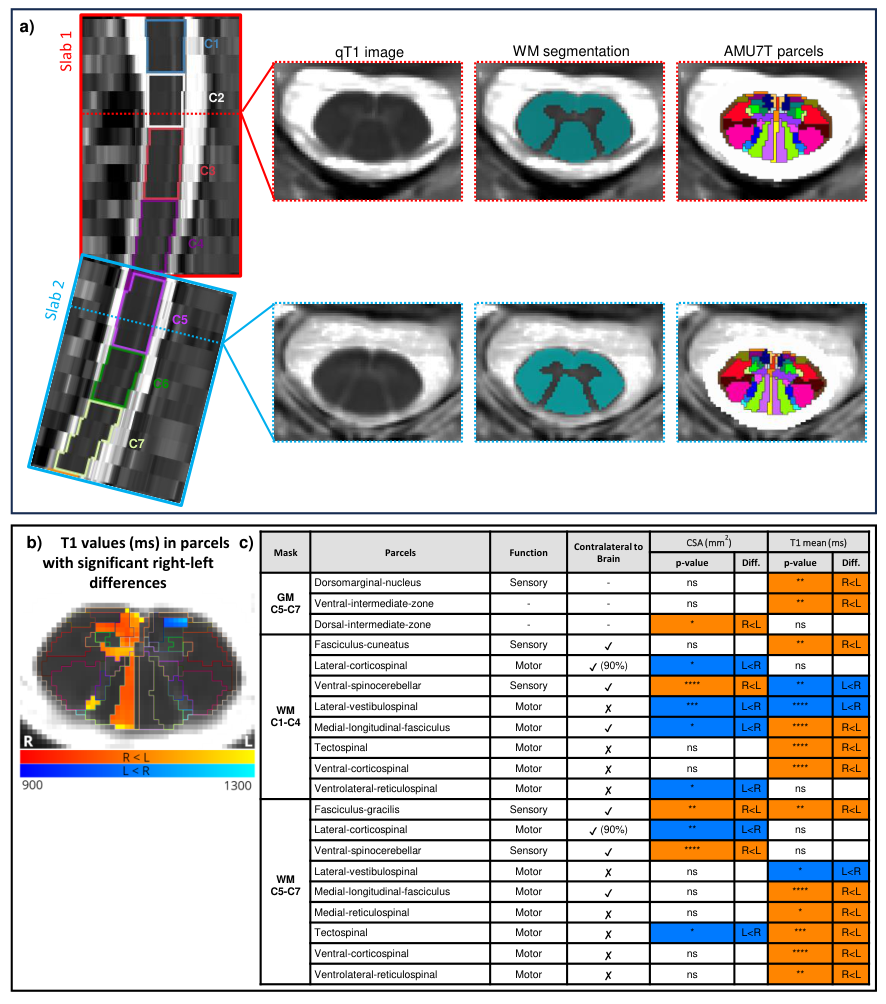
MR protocol:Twenty-three healthy volunteers (10 men, 13 women; age 41.2 ± 13.3 y.o., right-handed) were scanned at 7T using an 8Tx/8Rx neck coil array used in CP mode.A 3D T1-MP2RAGE sequence with high in-plane spatial resolution (0.3x0.3x4 mm3) was acquired as in [20]. (See Fig.1a) . A B1+ map was additionally acquired to correct the quantitative T1map for imperfect radiofrequency excitation [32].
Image processing:
- GM and SC automatic segmentations were performed using the sct_deepseg_sc [33] and sct_deepseg_gm [34] functions of SCT [35]. Masks were manually corrected if required. The WM mask was obtained by subtraction of SC and GM.
- In order to extract metrics in various parcels of WM and GM, the AMU7T template [25] was registered to the subject space, through commands sct_register_to_template and sct_warp_template.
- Left / right T1values and cross-sectional-area (CSA) were calculated per slice in large and refined parcels using the sct_extract_metric command, through its weighted-average (wa) approach.
RESULTS
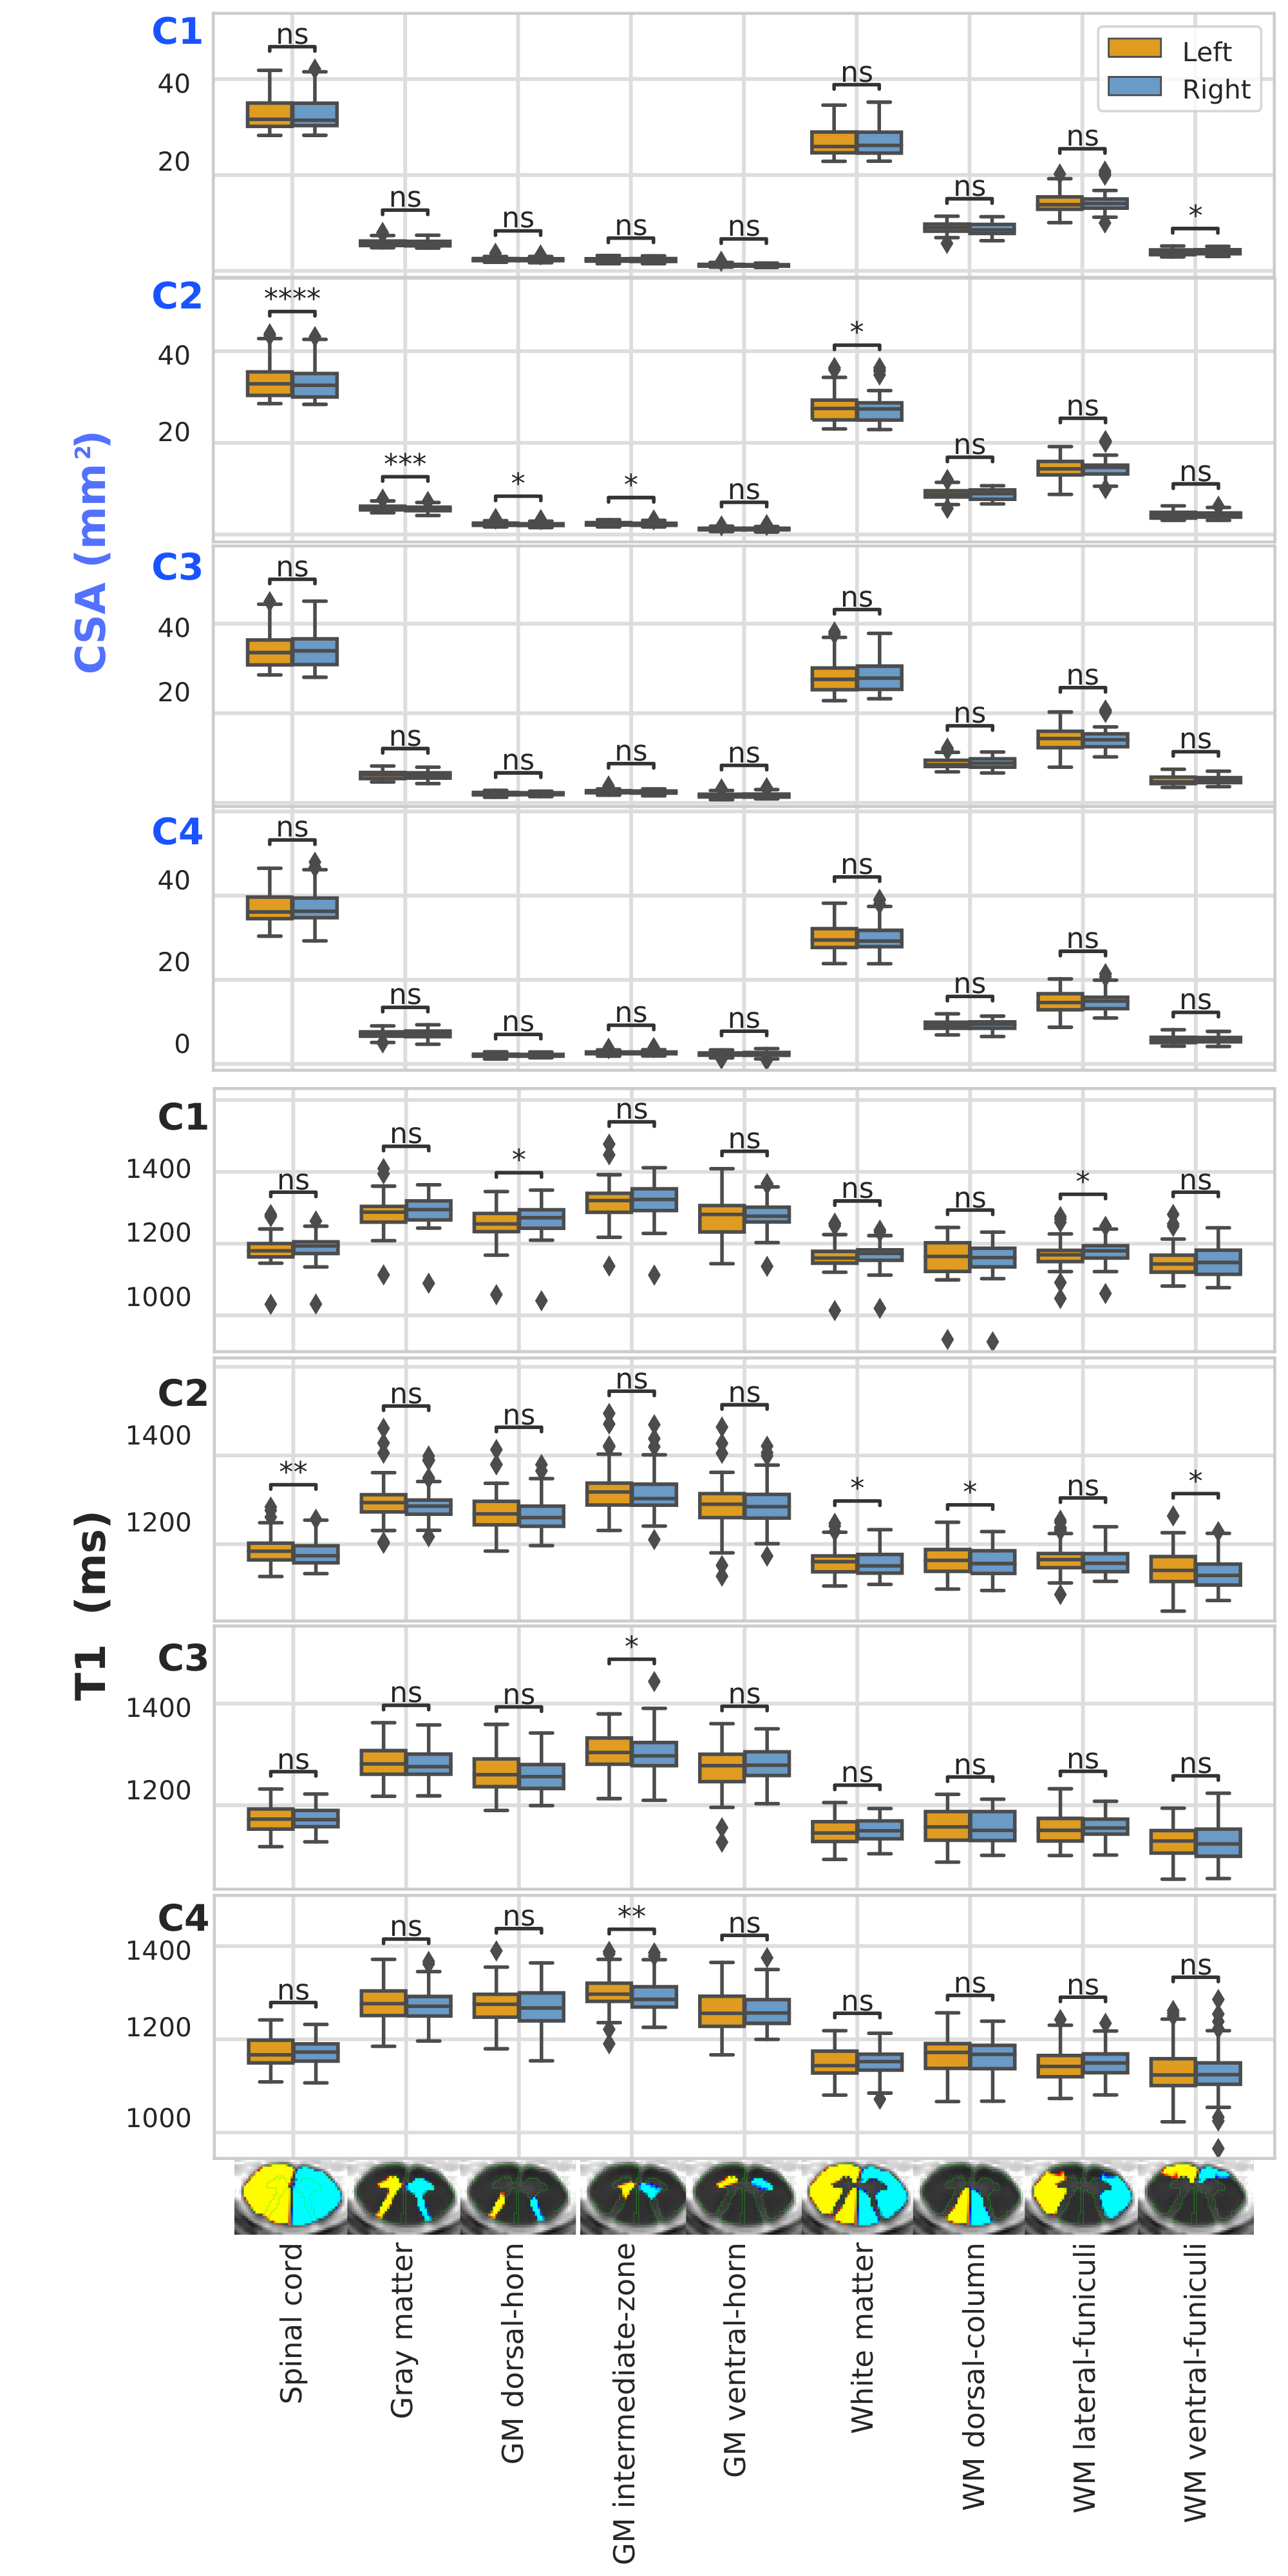
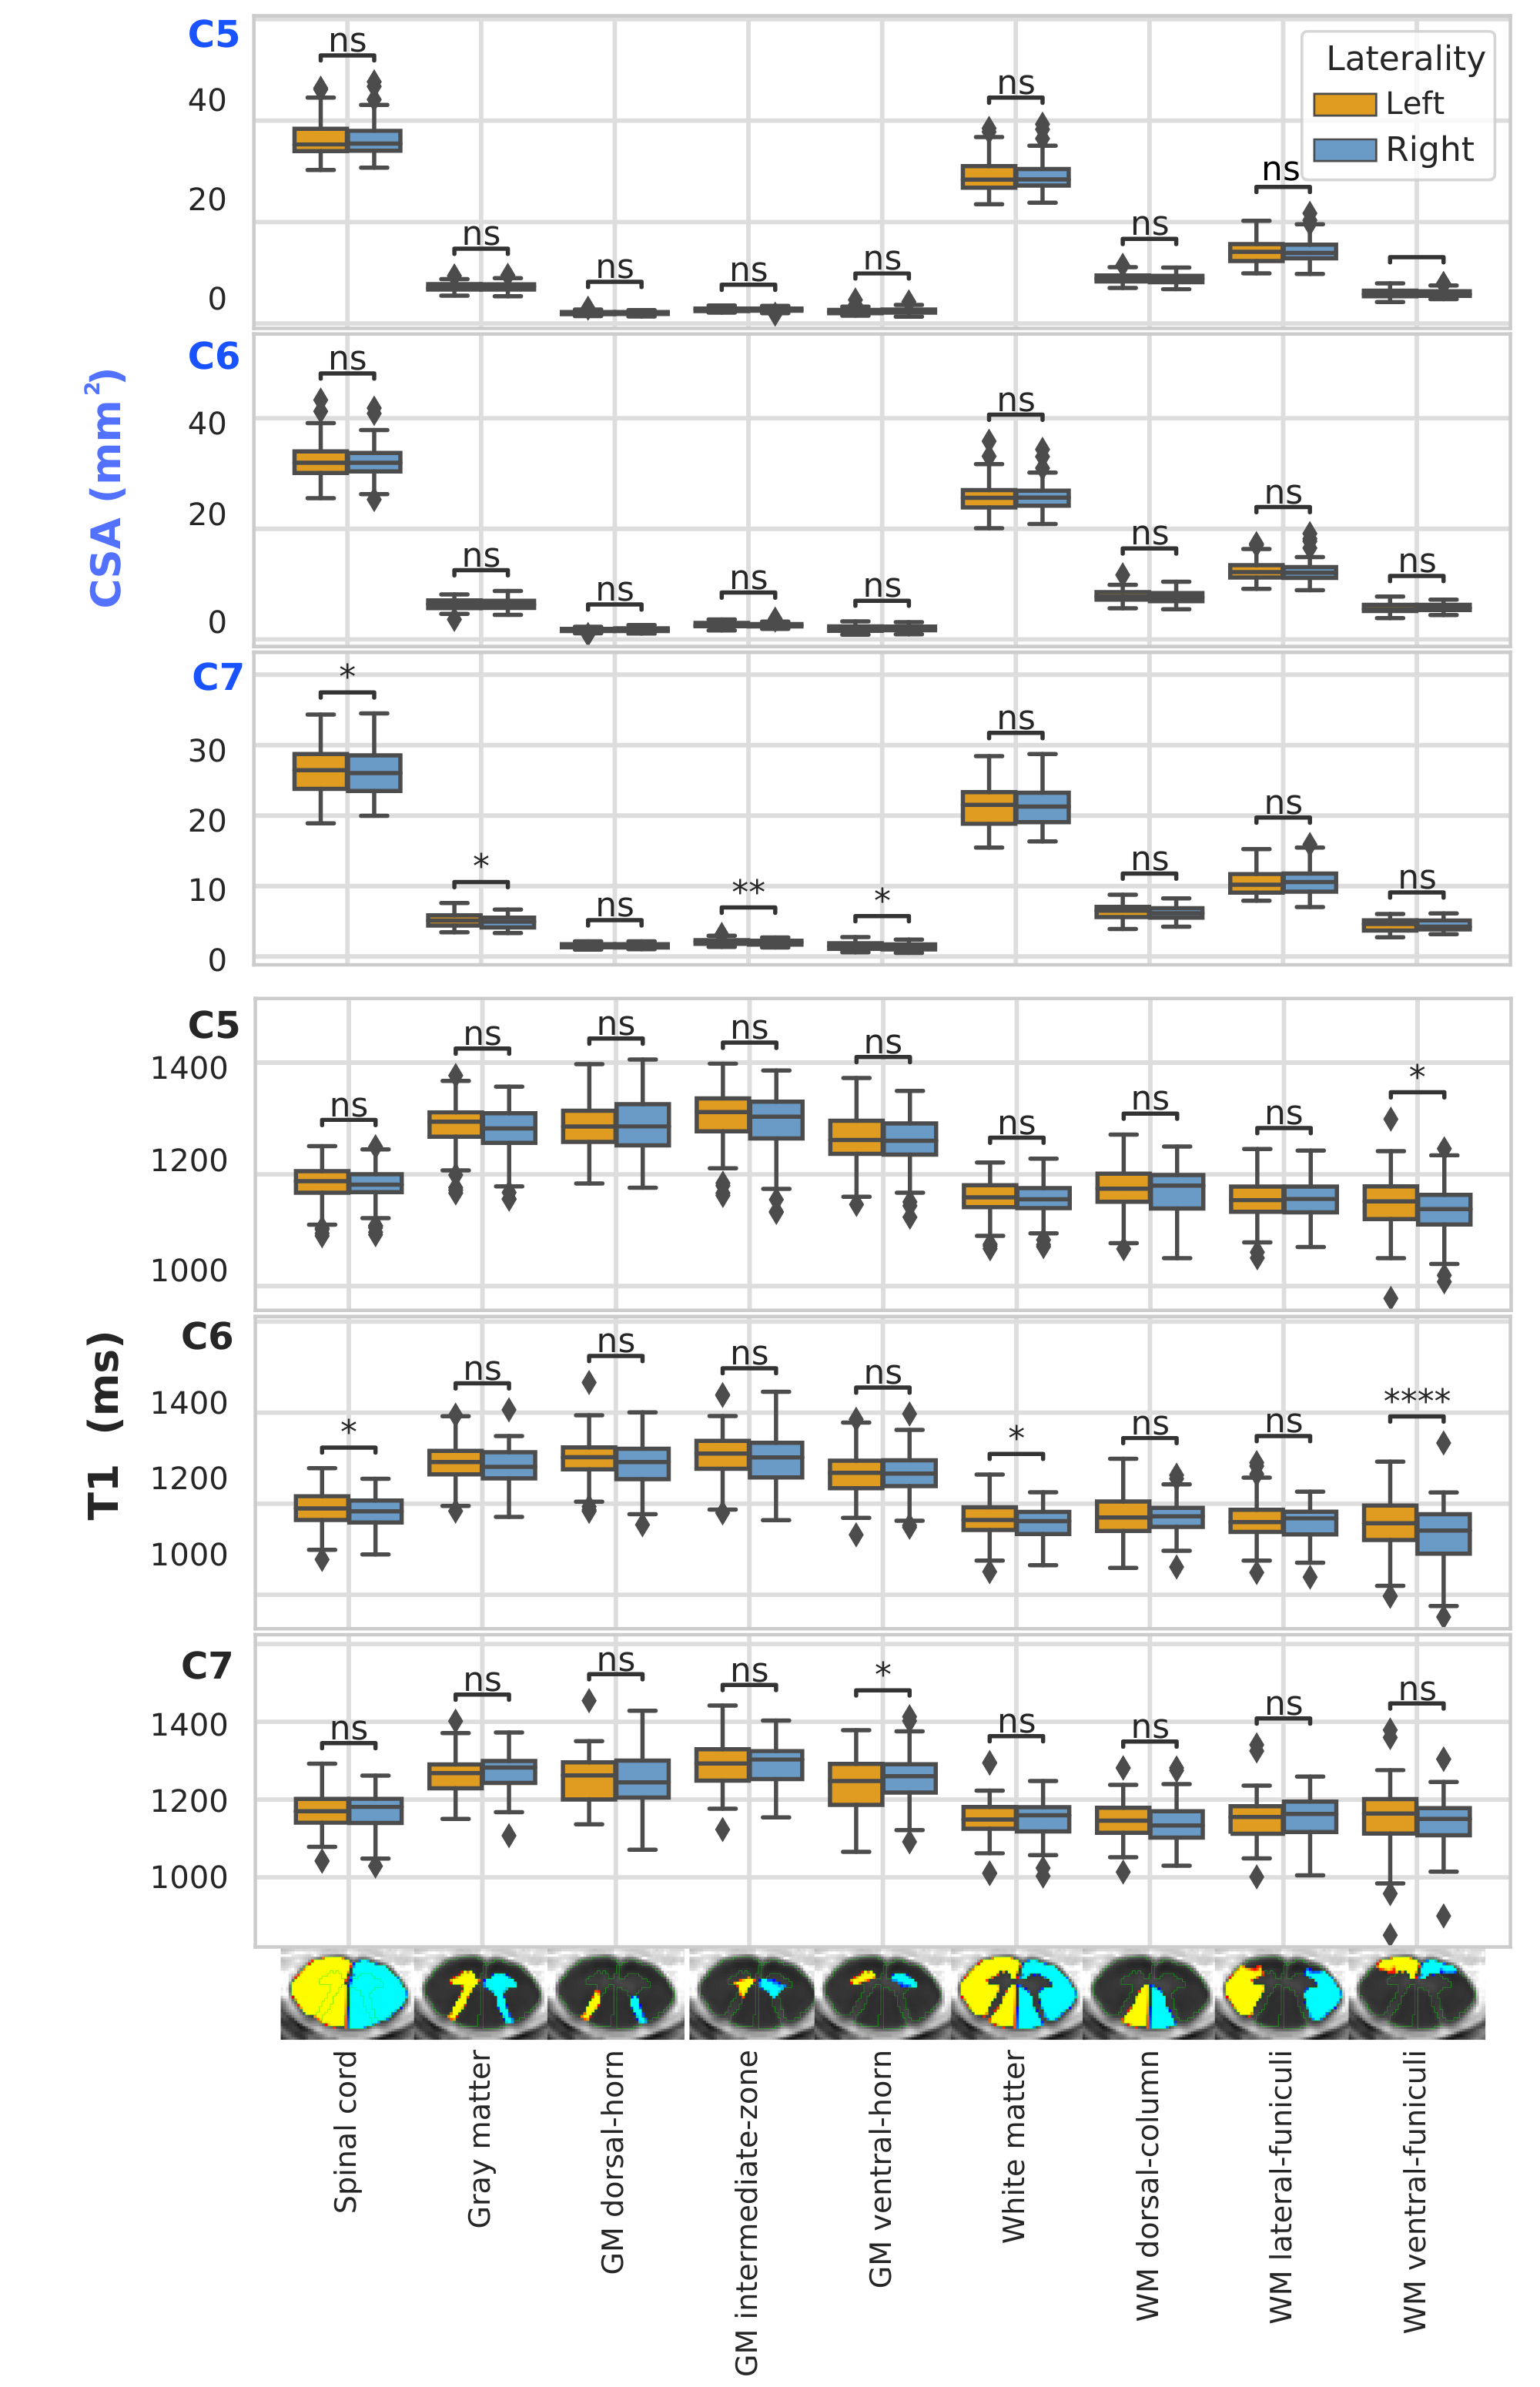
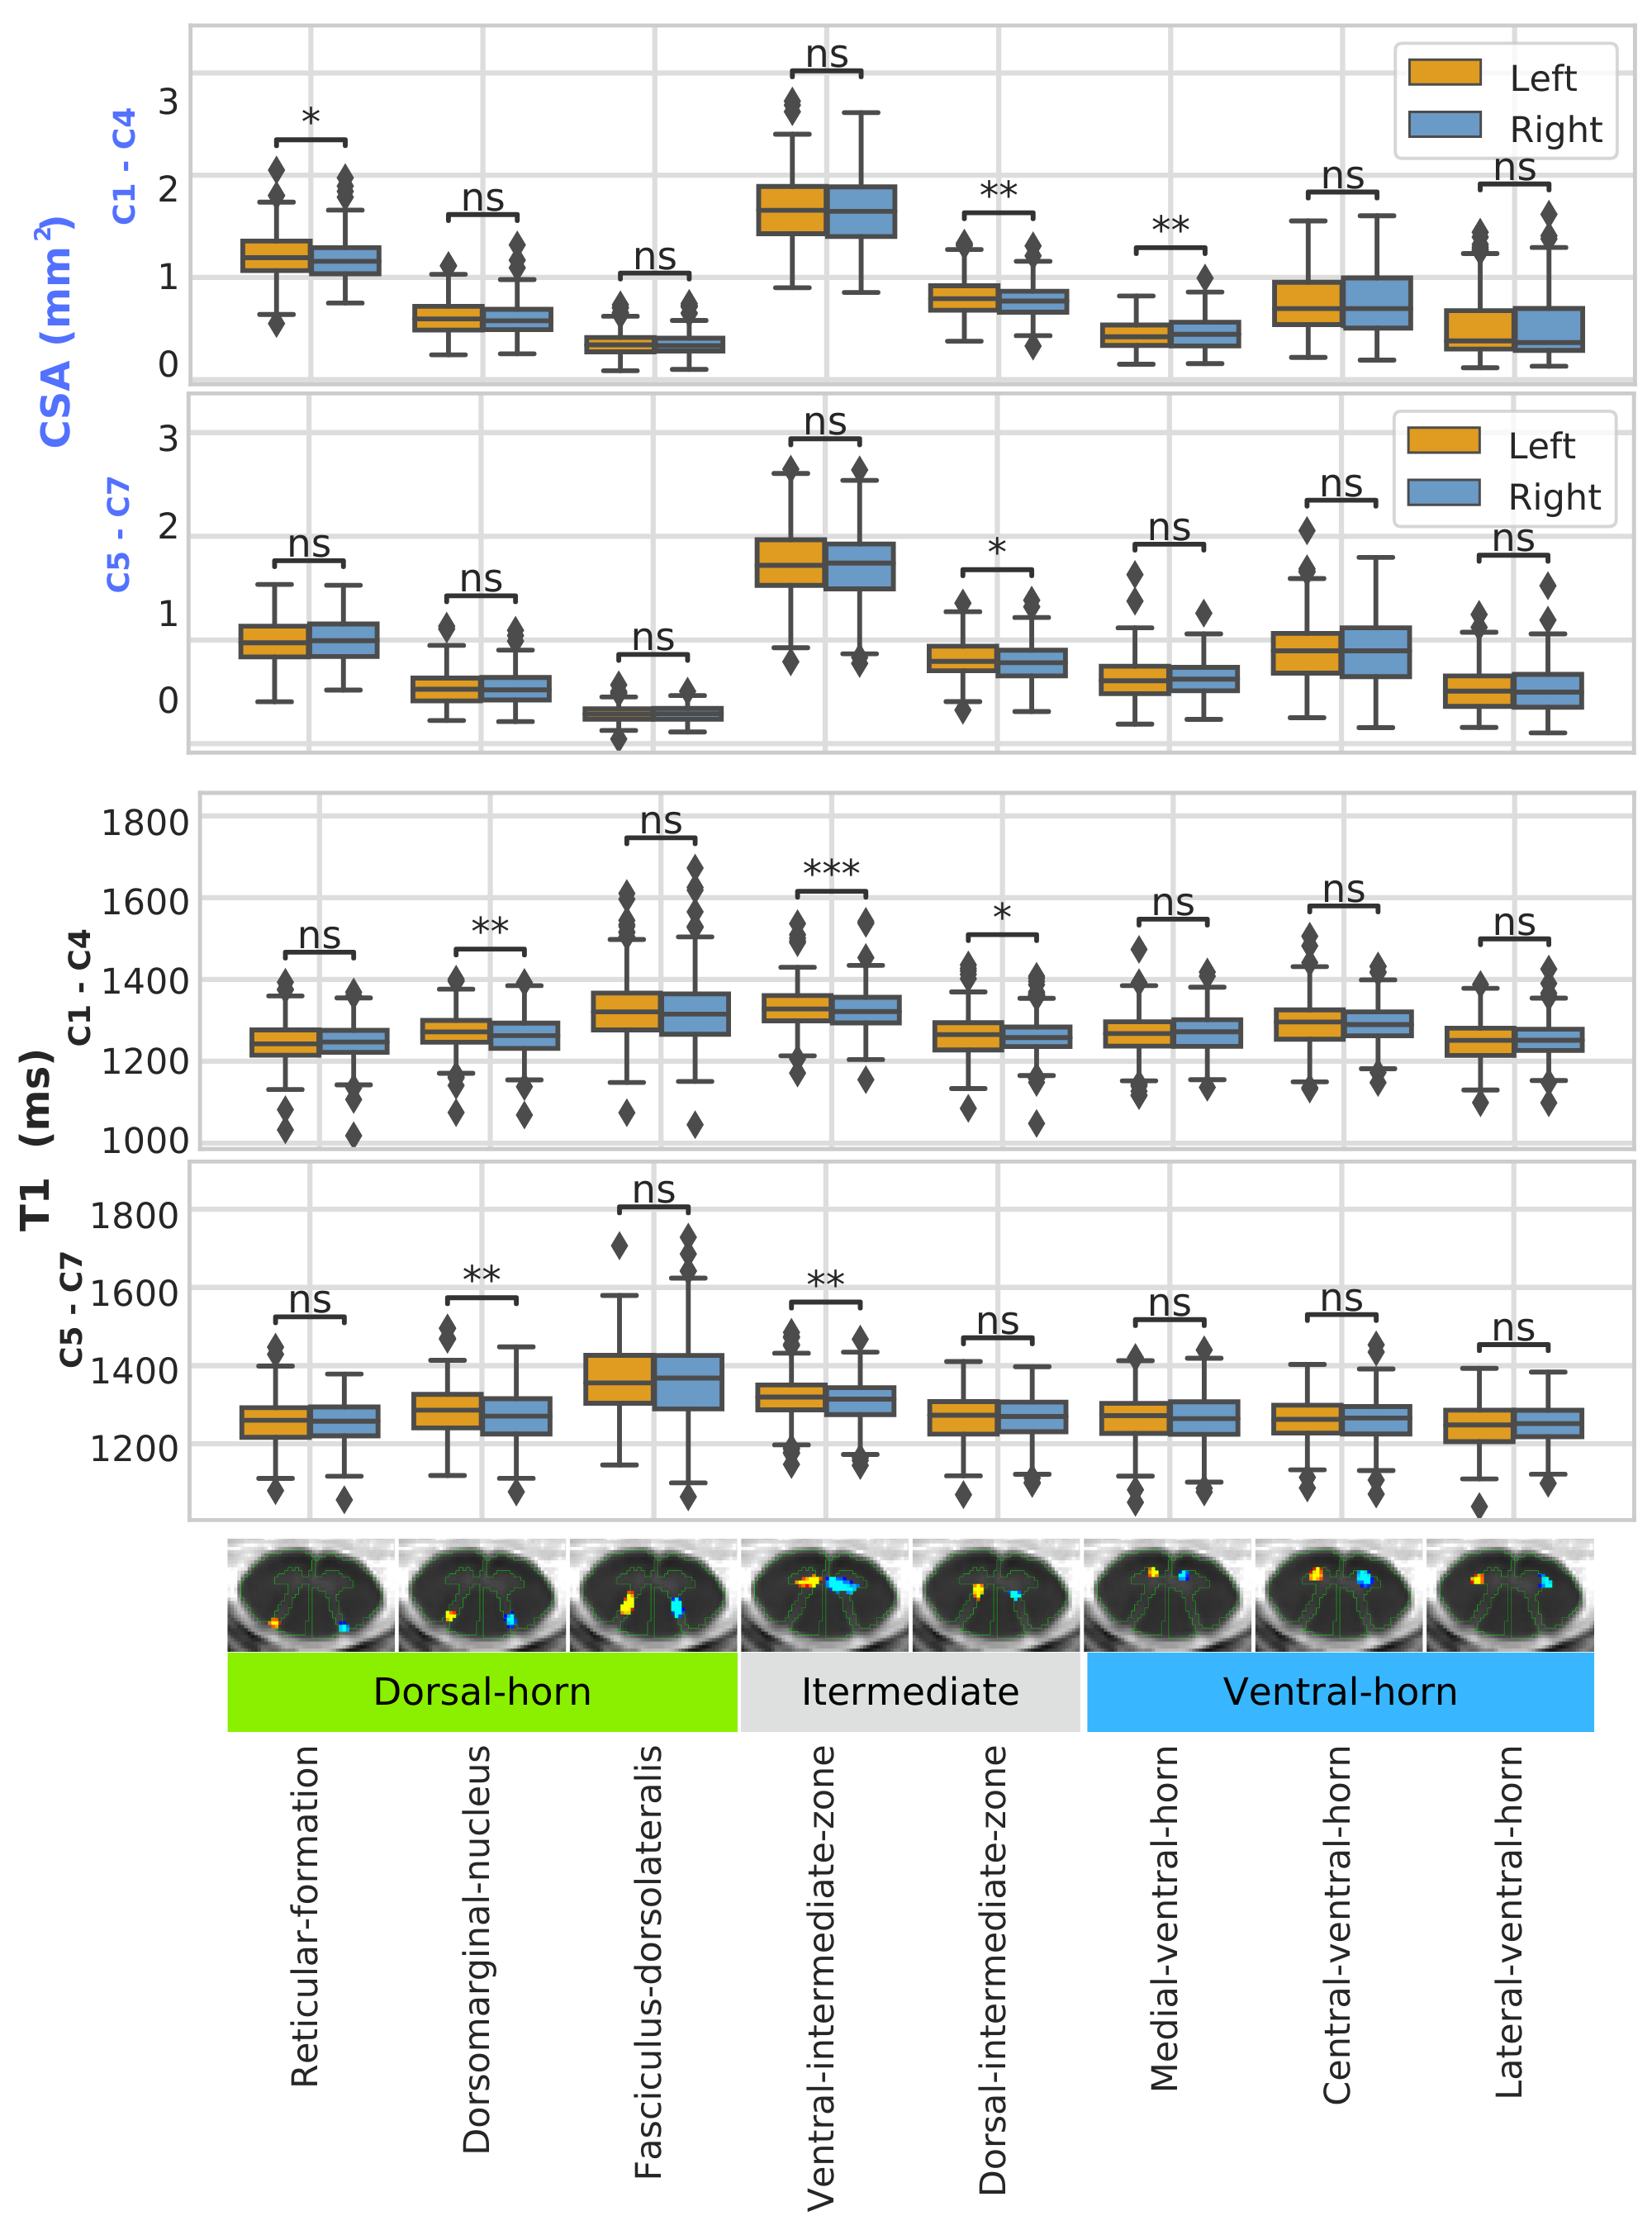
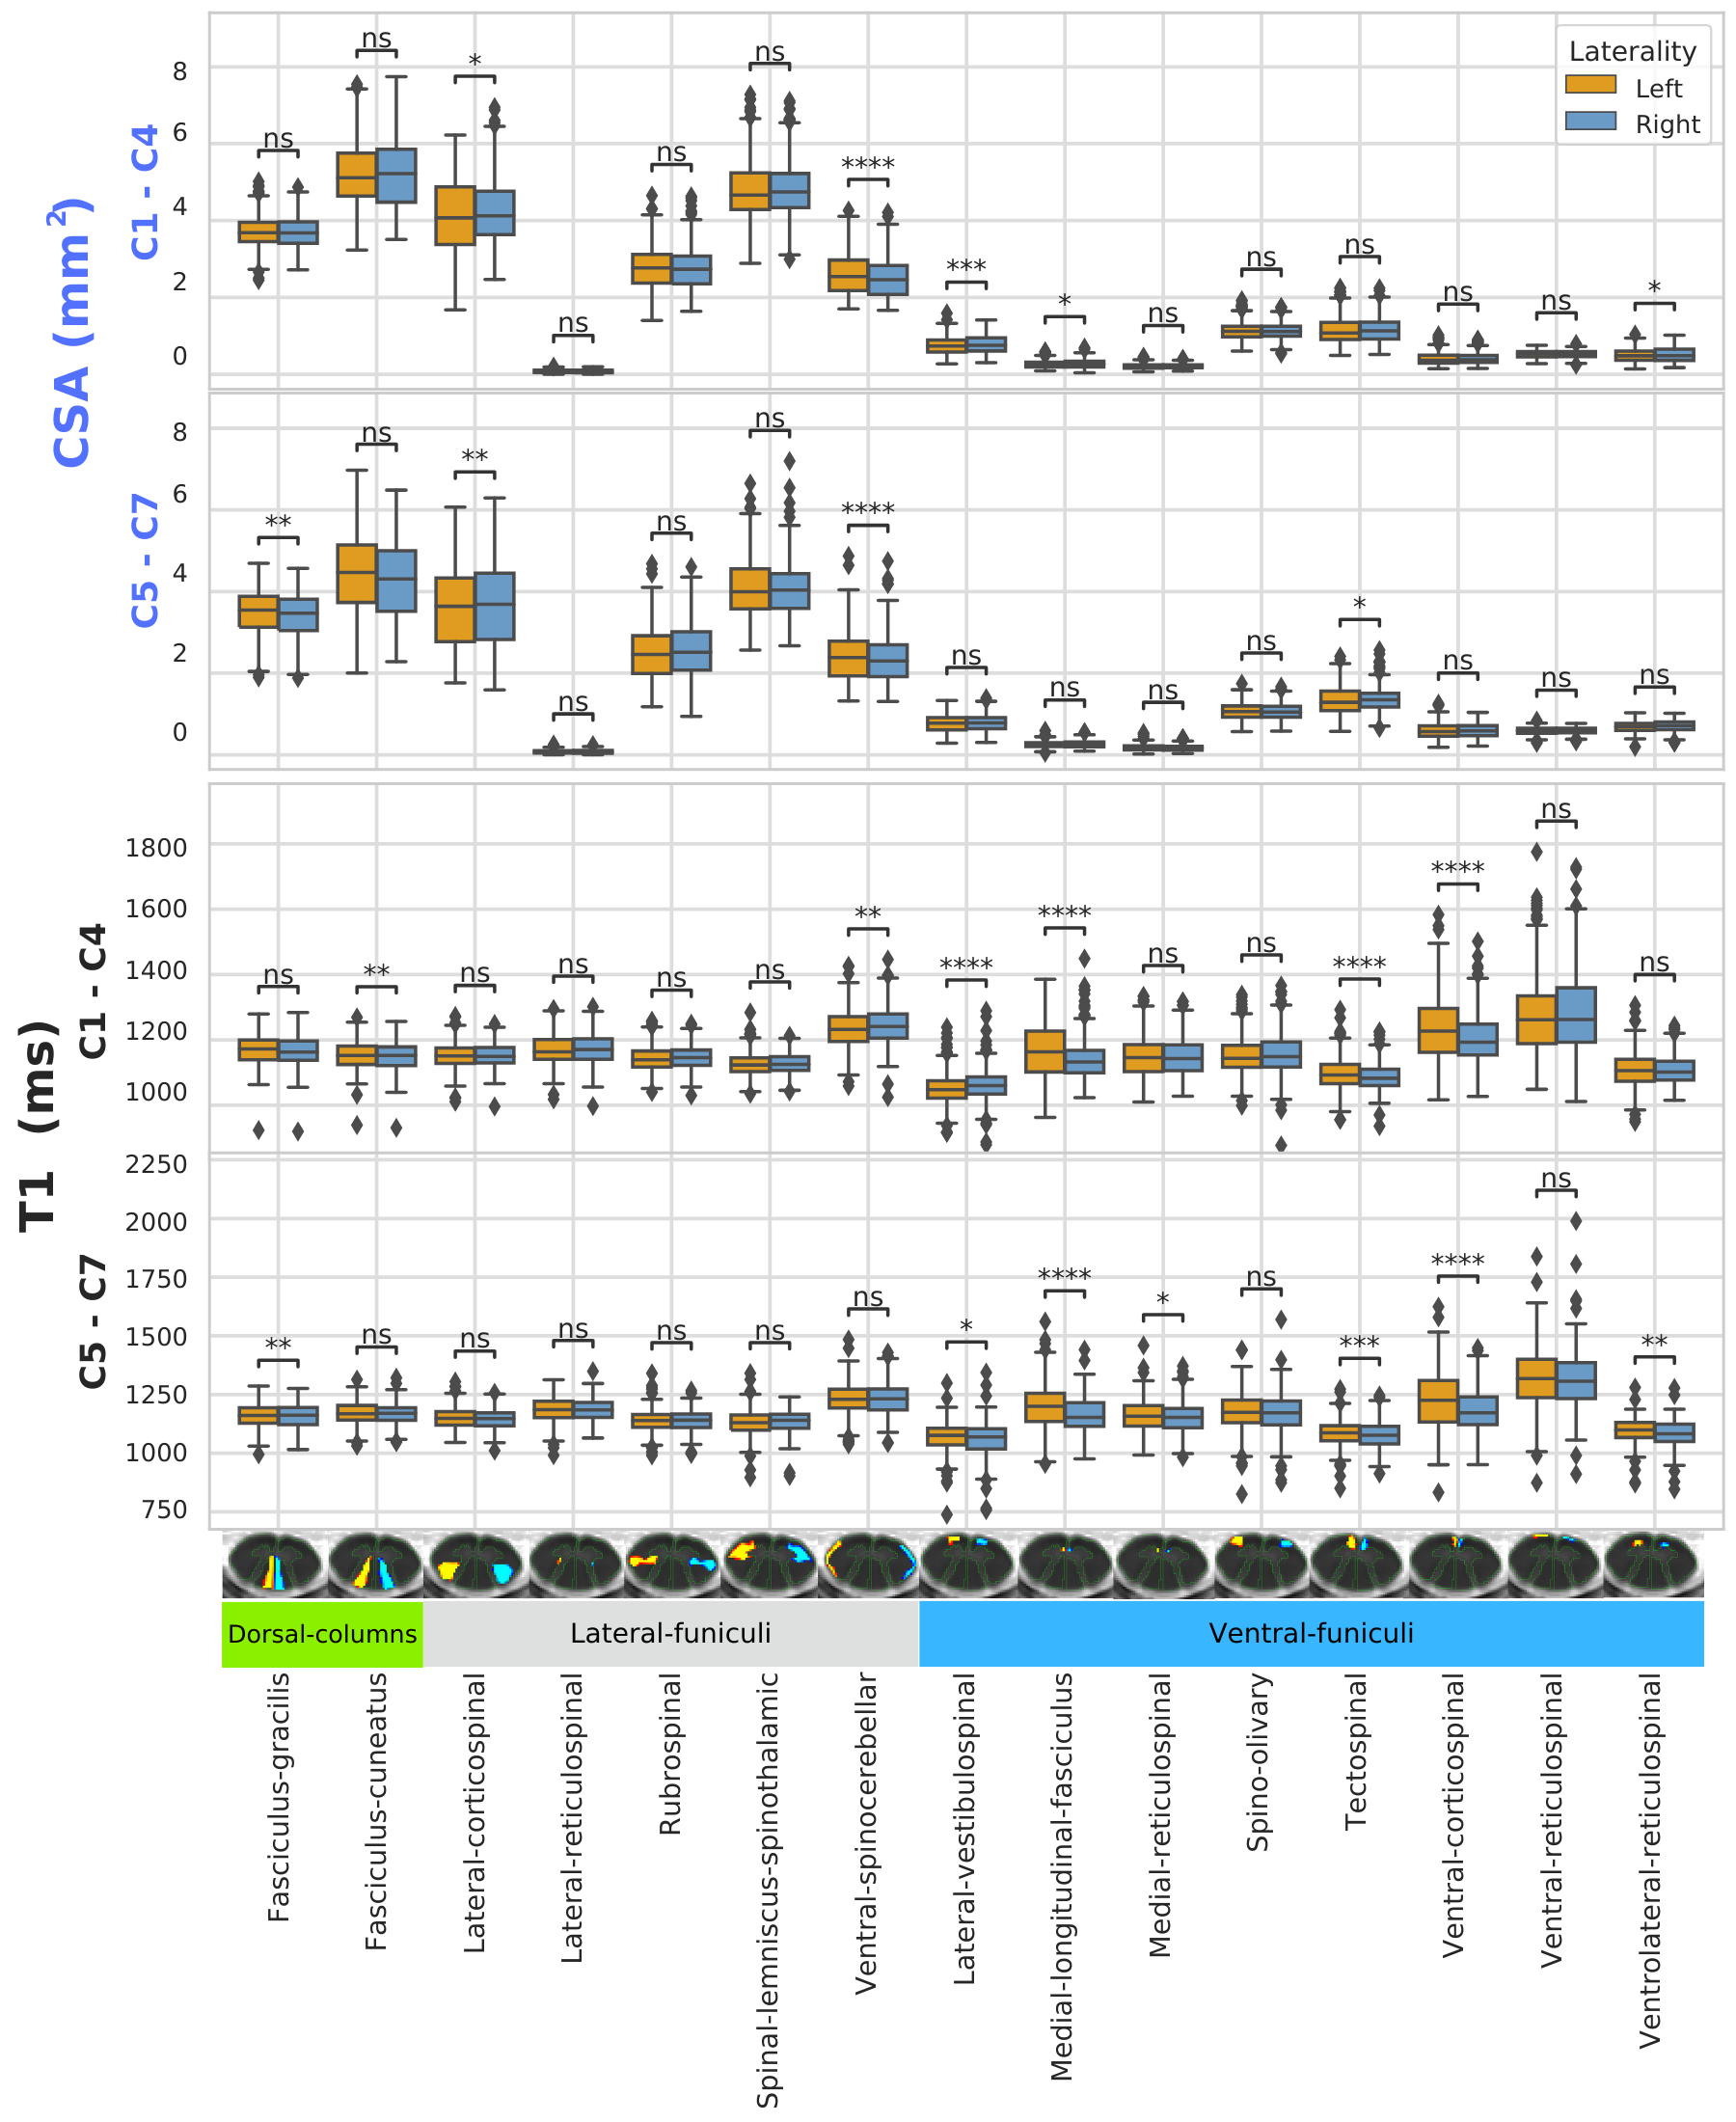
In the large regions (Fig.2-3), no significant differences were observed for CSA except for hemi-cord*** (p≤0.001), GM*** and WM** (p≤0.01) in C2, and hemi-cord** and GM** in C7, where the left had a higher CSA. For T1, no significant differences were observed except for hemi-cord** and WM* (p≤0.05) in C2 and hemi-cord* and WM* in C6, where the right had a lower T1value.In the refined parcels in lower levels (Fig.4-5), significant differences were observed for CSA in dorsal-intermediate-zone*, fasciculus-gracilis**, and ventral-spinocerebellar**** (p≤0.0001) where the left had a higher CSA, and lateral-corticospinal** and tecto-spinal* where the right had a higher CSA. Significant differences were observed for mean T1 in dorsomarginal-nucleus** and ventral-intermediate-zone** , as well as fasciculus-gracilis** and most of the motor tracts (medial-longitudinal-fasciculus**, medial-reticulospinal* , tecto-spinal*** , ventral-corticospinal***, ventrolateral-reticulospinal**), where the right was associated with lower T1values except for the right lateral-vestibulospinal* which had higher T1.Fig.1b and c summarize the main findings along with the main substructures and their functions.
DISCUSSION & CONCLUSION
In this preliminary study, thanks to high-resolution 7T quantitative T1 MRI and analyses in 23 refined parcels with AMU7T, right-left asymmetry in the cervical cord were evidenced, with lower T1 in 8 right and 1 left parcels on C5-C7 and 4 (and 2 resp.) on C1-C4.Results from some small tracts (1-4 pixels per slice), close to the central canal, may be affected by PVE, and should thus be taken with caution.More importantly, this preliminary study only included right-handed participants so far. Left-handed subjects should now be included to disentangled structural asymmetry (as in [4] from manual laterality (handedness). Larger cohorts should also be considered to study the effect of age and sex.
Acknowledgements
This work was supported by ARSEP (Fondation pour l’Aide à la Recherche sur la Sclérose en Plaques), ANR (Agence Nationale de la Recherche), Fondation Latran, and A*midex.NLM received support from NeuroSchool and Institut Marseille Imaging, Canada Research Chair in Quantitative Magnetic Resonance Imaging [CRC-2020-00179], the Canadian Institute of Health Research [PJT-190258], the Canada Foundation for Innovation [32454, 34824], the Fonds de Recherche du Québec - Santé [322736, 324636], the Natural Sciences and Engineering Research Council of Canada [RGPIN-2019-07244], the Canada First Research Excellence Fund (IVADO and TransMedTech), the Courtois NeuroMod project, the Quebec BioImaging Network [5886, 35450], INSPIRED (Spinal Research, UK; Wings for Life, Austria; Craig H. Neilsen Foundation, USA), Mila - Tech Transfer Funding Program.
References
[1] A. M. Galaburda, G. D. Rosen, and G. F. Sherman, “Individual variability in cortical organization: its relationship to brain laterality and implications to function,” Neuropsychologia, vol. 28, no. 6, pp. 529–546, 1990, doi: 10.1016/0028-3932(90)90032-j SMASH.
[2] M. LeMay, “Morphological cerebral asymmetries of modern man, fossil man, and nonhuman primate,” Ann. N. Y. Acad. Sci., vol. 280, pp. 349–366, 1976, doi: 10.1111/j.1749-6632.1976.tb25499.x SMASH.
[3] V. Duboc, P. Dufourcq, P. Blader, and M. Roussigné, “Asymmetry of the Brain: Development and Implications,” Annu. Rev. Genet., vol. 49, pp. 647–672, Oct. 2015, doi: 10.1146/annurev-genet-112414-055322 SMASH.
[4] P. W. Nathan, M. C. Smith, and P. Deacon, “The corticospinal tracts in man. Course and location of fibres at different segmental levels,” Brain, vol. 113 ( Pt 2), pp. 303–324, Apr. 1990, doi: 10.1093/brain/113.2.303 SMASH.
[5] A. Kertesz and N. Geschwind, “Patterns of pyramidal decussation and their relationship to handedness,” Arch. Neurol., vol. 24, no. 4, pp. 326–332, Apr. 1971, doi: 10.1001/archneur.1971.00480340058006 SMASH.
[6] G. Melsbach, A. Wohlschläger, M. Spiess, and O. Güntürkün, “Morphological asymmetries of motoneurons innervating upper extremities: clues to the anatomical foundations of handedness?,” Int. J. Neurosci., vol. 86, no. 3–4, pp. 217–224, Sep. 1996, doi: 10.3109/00207459608986712 SMASH.
[7] A. Schmied, J. P. Vedel, and S. Pagni, “Human spinal lateralization assessed from motoneurone synchronization: dependence on handedness and motor unit type,” J. Physiol., vol. 480 ( Pt 2), no. Pt 2, pp. 369–387, Oct. 1994, doi: 10.1113/jphysiol.1994.sp020367 SMASH.
[8] N. Oka, M. Sakoh, M. Hirayama, M. Niiyama, and A. Gjedde, “Relationship between manual dexterity and left-right asymmetry of anatomical and functional properties of corticofugal tracts revealed by T2-weighted brain images,” Sci. Rep., vol. 13, no. 1, p. 2738, Feb. 2023, doi: 10.1038/s41598-023-29557-1 SMASH.
[9] M. Crotti, K. Koschutnig, and S. C. Wriessnegger, “Handedness impacts the neural correlates of kinesthetic motor imagery and execution: A FMRI study,” J. Neurosci. Res., vol. 100, no. 3, pp. 798–826, Mar. 2022, doi: 10.1002/jnr.25003 SMASH.
[10] S. Angstmann, K. S. Madsen, A. Skimminge, T. L. Jernigan, W. F. C. Baaré, and H. R. Siebner, “Microstructural asymmetry of the corticospinal tracts predicts right–left differences in circle drawing skill in right-handed adolescents,” Brain Struct. Funct., vol. 221, no. 9, pp. 4475–4489, Dec. 2016, doi: 10.1007/s00429-015-1178-5 SMASH.
[11] R. Seizeur, E. Magro, S. Prima, N. Wiest-Daesslé, C. Maumet, and X. Morandi, “Corticospinal tract asymmetry and handedness in right- and left-handers by diffusion tensor tractography,” Surg. Radiol. Anat., vol. 36, no. 2, pp. 111–124, Mar. 2014, doi: 10.1007/s00276-013-1156-7 SMASH.
[12] K. A. Weber 2nd, Y. Chen, X. Wang, T. Kahnt, and T. B. Parrish, “Lateralization of cervical spinal cord activity during an isometric upper extremity motor task with functional magnetic resonance imaging,” Neuroimage, vol. 125, pp. 233–243, Jan. 2016, doi: 10.1016/j.neuroimage.2015.10.014 SMASH.
[13] K. A. Weber 2nd et al., “Assessing the spatial distribution of cervical spinal cord activity during tactile stimulation of the upper extremity in humans with functional magnetic resonance imaging,” Neuroimage, vol. 217, p. 116905, Aug. 2020, doi: 10.1016/j.neuroimage.2020.116905 SMASH.
[14] S. Lévy et al., “Test-retest reliability of myelin imaging in the human spinal cord: Measurement errors versus region- and aging-induced variations,” PLoS One, vol. 13, no. 1, p. e0189944, Jan. 2018, doi: 10.1371/journal.pone.0189944 SMASH.
[15] T. Duval et al., “g-Ratio weighted imaging of the human spinal cord in vivo,” Neuroimage, vol. 145, no. Pt A, pp. 11–23, Jan. 2017, doi: 10.1016/j.neuroimage.2016.09.018 SMASH.
[16] V. Callot, A. J. E. Combes, A. Destruel, and S. A. Smith, “Ultra-high field spinal cord MRI,” in Advances in Magnetic Resonance Technology and Applications, Elsevier, 2023, pp. 301–318. doi: 10.1016/b978-0-323-99898-7.00032-8 SMASH.
[17] R. L. Barry, S. J. Vannesjo, S. By, J. C. Gore, and S. A. Smith, “Spinal cord MRI at 7T,” Neuroimage, vol. 168, pp. 437–451, Mar. 2018, doi: 10.1016/j.neuroimage.2017.07.003 SMASH.
[18] O. Geldschläger, D. Bosch, N. I. Avdievich, and A. Henning, “Ultrahigh-resolution quantitative spinal cord MRI at 9.4T,” Magn. Reson. Med., vol. 85, no. 2, pp. 1013–1027, Feb. 2021, doi: 10.1002/mrm.28455 SMASH.
[19] N. J. Laines Medina, C. Gros, J. Cohen-Adad, V. Callot, and A. Le Troter, “2D Multi-Class Model for Gray and White Matter Segmentation of the Cervical Spinal Cord at 7T,” arXiv [eess.IV], Oct. 13, 2021. [Online]. Available: http://arxiv.org/abs/2110.06516
[20] A. Massire, H. Rasoanandrianina, M. Guye, and V. Callot, “Anterior fissure, central canal, posterior septum and more: New insights into the cervical spinal cord gray and white matter regional organization using T1 mapping at 7T,” Neuroimage, vol. 205, p. 116275, Jan. 2020, doi: 10.1016/j.neuroimage.2019.116275 SMASH.
[21] B. Testud et al., “Contribution of the MP2RAGE 7T Sequence in MS Lesions of the Cervical Spinal Cord,” AJNR Am. J. Neuroradiol., vol. 44, no. 9, pp. 1101–1107, Sep. 2023, doi: 10.3174/ajnr.A7964 SMASH.
[22] R. Mathur-De Vré, “Biomedical implications of the relaxation behaviour of water related to NMR imaging,” Br. J. Radiol., vol. 57, no. 683, pp. 955–976, Nov. 1984, doi: 10.1259/0007-1285-57-683-955 SMASH.
[23] M. R. Raman, Y. Shu, T. G. Lesnick, C. R. Jack, and K. Kantarci, “Regional T1 relaxation time constants in Ex vivo human brain: Longitudinal effects of formalin exposure,” Magn. Reson. Med., vol. 77, no. 2, pp. 774–778, Feb. 2017, doi: 10.1002/mrm.26140 SMASH.
[24] A. Lutti, F. Dick, M. I. Sereno, and N. Weiskopf, “Using high-resolution quantitative mapping of R1 as an index of cortical myelination,” Neuroimage, vol. 93 Pt 2, pp. 176–188, Jun. 2014, doi: 10.1016/j.neuroimage.2013.06.005 SMASH.
[25] A. Le Troter, N. J. Laines Medina, S. Mchinda, J. Cohen-Adad, and V. Callot, “AMU7T : a 3D qT1 and T2*w high-resolution in vivo template with refined white and gray matter parcellation dedicated to 7T spinal cord MR analyses,” presented at the ISMRM & ISMRT annual Meeting & Exhibition, 2023. Accessed: Sep. 28, 2023. [Online]. Available: https://publications.polymtl.ca/53914/
[26] B. De Leener, V. S. Fonov, D. L. Collins, V. Callot, N. Stikov, and J. Cohen-Adad, “PAM50: Unbiased multimodal template of the brainstem and spinal cord aligned with the ICBM152 space,” Neuroimage, vol. 165, pp. 170–179, Jan. 2018, doi: 10.1016/j.neuroimage.2017.10.041 SMASH.
[27] S. Lévy, M. Benhamou, C. Naaman, P. Rainville, V. Callot, and J. Cohen-Adad, “White matter atlas of the human spinal cord with estimation of partial volume effect,” Neuroimage, vol. 119, pp. 262–271, Oct. 2015, doi: 10.1016/j.neuroimage.2015.06.040 SMASH.
[28] C. Gros et al., “Ex vivo MRI template of the human cervical cord at 80μm isotropic resolution,” in Proceedings of the 28th Annual Meeting of ISMRM, Sydney, Australia, 2020. [Online]. Available: https://archive.ismrm.org/2020/1171.html
[29] V. S. Fonov et al., “Framework for integrated MRI average of the spinal cord white and gray matter: The MNI–Poly–AMU template,” Neuroimage, vol. 102, pp. 817–827, Nov. 2014, doi: 10.1016/j.neuroimage.2014.08.057 SMASH.
[30] L. Hausman, Atlases of the Spinal Cord and Brainstem and the Forebrain: Atlas 1. Thomas, 1951. [Online]. Available: https://play.google.com/store/books/details?id=nzNcswEACAAJ
[31] S. Susan, “Gray’s anatomy: the anatomical basis of clinical practice,” 2015, [Online]. Available: http://125.212.201.8:6008/handle/DHKTYTHD_123/1297
[32] A. Massire, M. Taso, P. Besson, M. Guye, J.-P. Ranjeva, and V. Callot, “High-resolution multi-parametric quantitative magnetic resonance imaging of the human cervical spinal cord at 7T,” Neuroimage, vol. 143, pp. 58–69, Dec. 2016, doi: 10.1016/j.neuroimage.2016.08.055 SMASH.
[33] C. Gros et al., “Automatic segmentation of the spinal cord and intramedullary multiple sclerosis lesions with convolutional neural networks,” Neuroimage, vol. 184, pp. 901–915, Jan. 2019, doi: 10.1016/j.neuroimage.2018.09.081 SMASH.
[34] C. S. Perone, E. Calabrese, and J. Cohen-Adad, “Spinal cord gray matter segmentation using deep dilated convolutions,” Sci. Rep., vol. 8, no. 1, p. 5966, Apr. 2018, doi: 10.1038/s41598-018-24304-3 SMASH.
[35] B. De Leener et al., “SCT: Spinal Cord Toolbox, an open-source software for processing spinal cord MRI data,” Neuroimage, vol. 145, no. Pt A, pp. 24–43, Jan. 2017, doi: 10.1016/j.neuroimage.2016.10.009 SMASH.
[36] E. R. Kandel, Principles of Neural Science, Fifth Edition. McGraw Hill Professional, 2013. [Online]. Available: https://play.google.com/store/books/details?id=s64z-LdAIsEC
Figures