2328
Interactive database of spinal cord morphometry1NeuroPoly Lab, Institute of Biomedical Engineering, Polytechnique Montreal, Montreal, QC, Canada, 2Mila - Quebec AI Institute, Montreal, QC, Canada, 3Department of Neurosurgery, Faculty of Medicine and Dentistry, Palacký University Olomouc, Olomouc, Czech Republic, 4Department of Neurology, Faculty of Medicine and Dentistry, Palacký University Olomouc, Olomouc, Czech Republic, 5Department of Radiology and Nuclear Medicine, University Hospital Brno and Masaryk University, Brno, Czech Republic, 6Functional Neuroimaging Unit, CRIUGM, Université de Montréal, Montreal, QC, Canada, 7Centre de Recherche du CHU Sainte-Justine, Université de Montréal, Montreal, QC, Canada
Synopsis
Keywords: Spinal Cord, Spinal Cord, Morphometric Measures; Normalization; Normative Values
Motivation: Spinal cord morphometric measures are commonly used to evaluate spinal cord pathologies. Yet, their interpretation is challenged by considerable intra- and inter-subject variability.
Goal(s): Develop a method for automatic normalization relative to a healthy cohort to reduce inter-subject variability.
Approach: Morphometric measures computed from an open-access dataset (N=203) were linearly interpolated using a newly proposed approach into the spinal cord template to build a normative database.
Results: The methodology is open-source and allows normalization based on sex, MRI vendors, and age decades, thereby minimizing inter-subject variability associated with demographic and biological factors.
Impact: This new morphometric database will allow researchers to normalize based on sex, MRI vendors, and age decades, thereby minimizing inter-subject variability associated with demographic and biological factors. The method is open-source and available in Spinal Cord Toolbox.
Introduction
Spinal cord morphometric measures, such as cross-sectional area (CSA) and anteroposterior (AP) diameter, are commonly used to evaluate spinal cord atrophy and the severity of spinal cord compressions1,2. However, the interpretation of these measures is challenged by considerable inter-subject variability and the changes in spinal cord anatomy across spinal levels.In this work, we present: i) a new fully-automatic normalization approach based on the PAM50 spinal cord template3, and ii) an interactive database of healthy normative values allowing filtering per sex, age, and MRI vendors. The proposed methodology is part of the open-source Spinal Cord Toolbox (SCT)4 and can be used in future multi-subject studies to mitigate inter-subject variability.
Methods
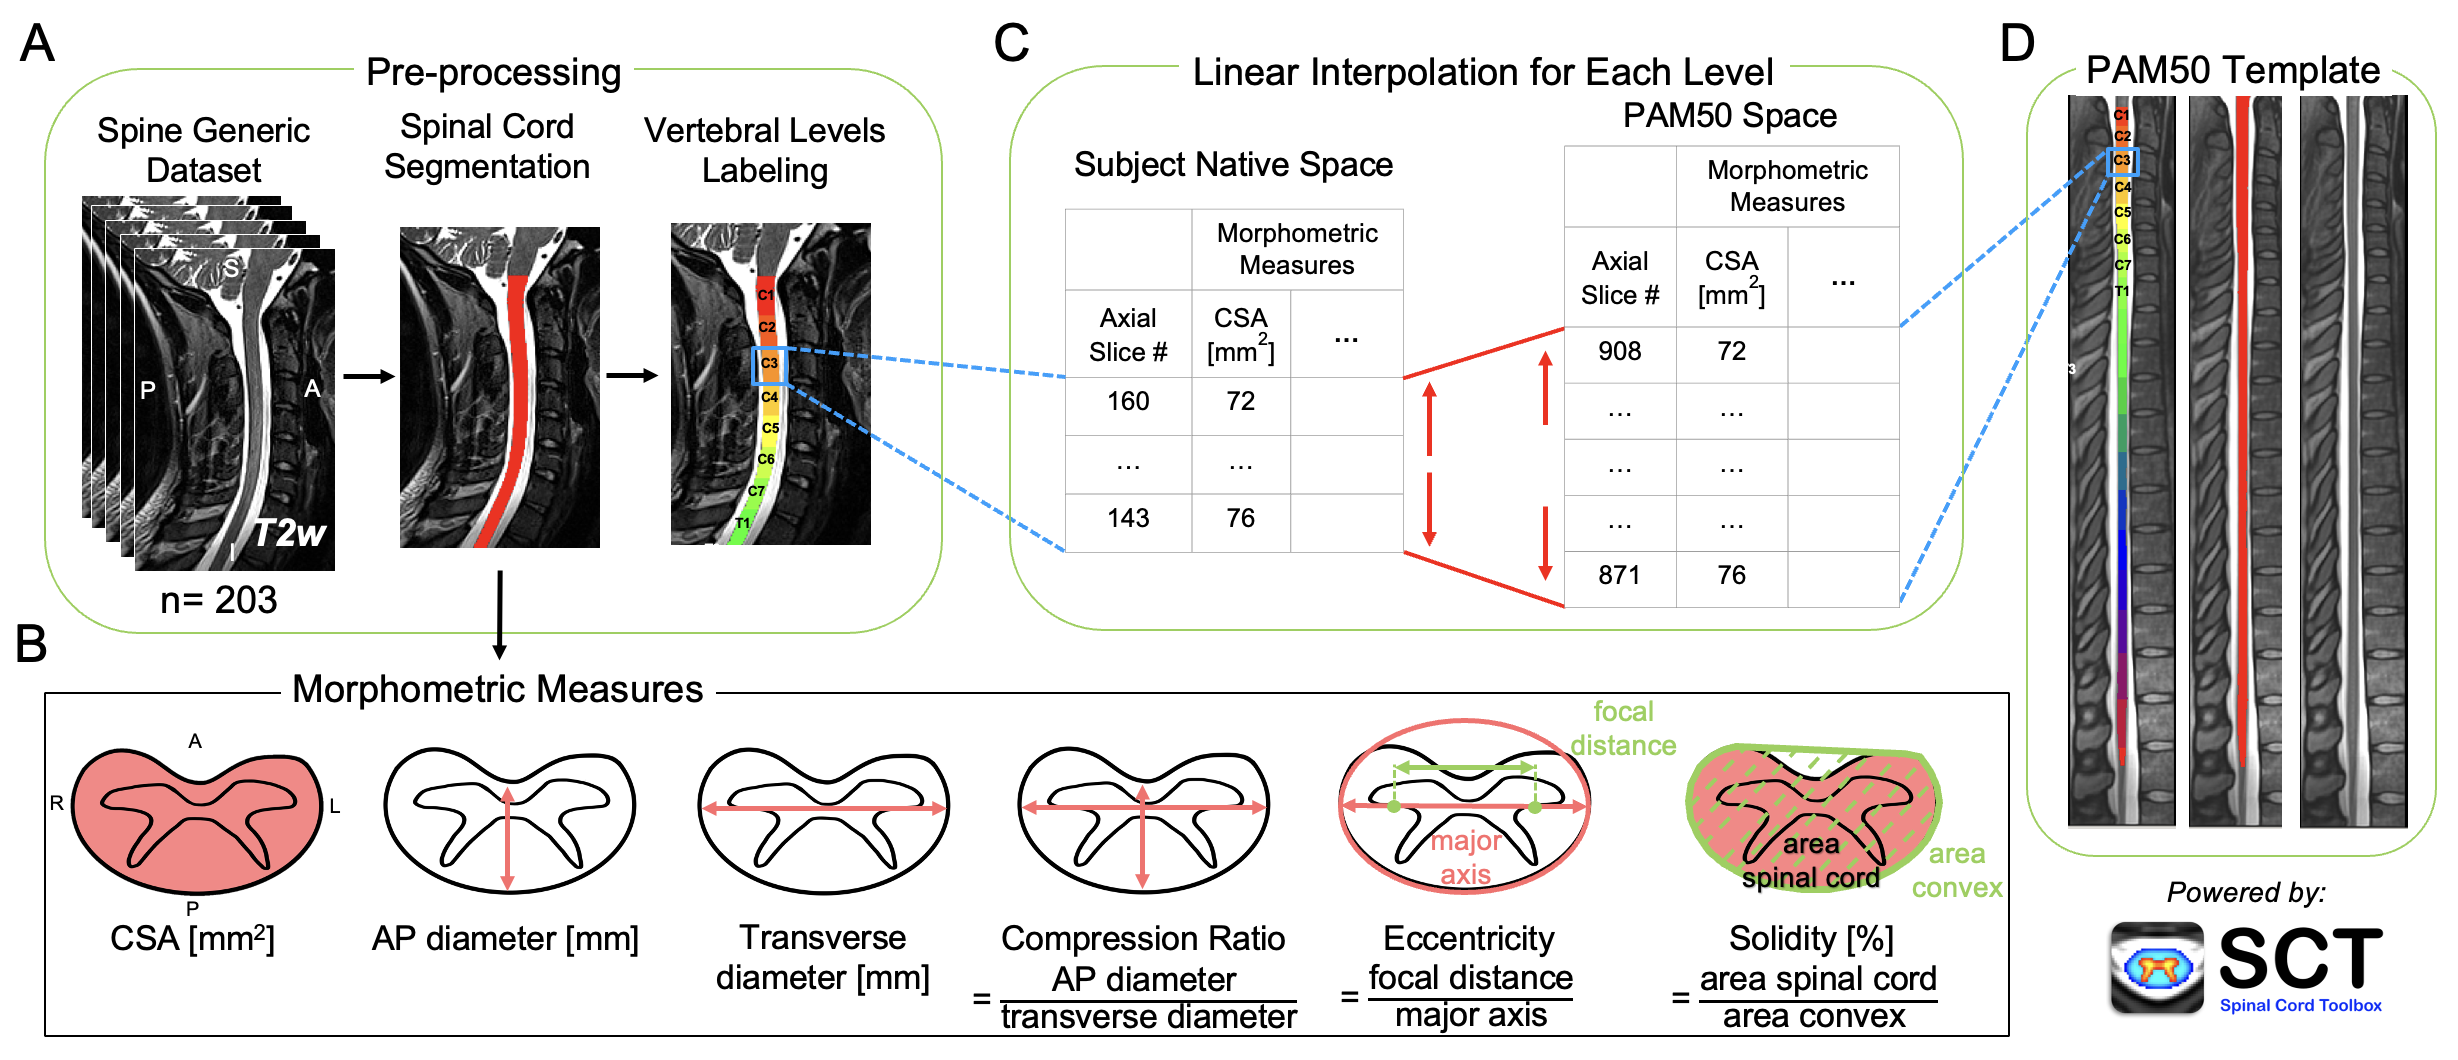
Data from the open-access spine-generic multi-subject dataset were used5,6. Two experienced radiologists reviewed MRI data and revealed mostly mild compression in 64 out of 267 participants. Those participants were excluded from further analysis. The final cohort used to build the normative database included 203 healthy adult participants (105 males and 98 females).3T T2-weighted images (0.8 mm isotropic) were automatically processed using SCT v6.04 to generate the cord segmentation labeled with vertebral levels (Figure 1A). Results were visually inspected and corrected when necessary. For each participant, the labeled segmentation was used to compute morphometric measures across individual axial slices in the participant’s native space (Figure 1B). The following morphometric measures were computed: CSA, AP diameter, transverse diameter, compression ratio, eccentricity, and solidity. Then, the number of axial slices corresponding to each vertebral level was identified in both the participant’s native space and the PAM50 template3. Finally, the computed morphometric measures were linearly interpolated to the PAM50 anatomical dimensions based on the number of slices for each vertebral level in the native space and the PAM50 template (Figure 1C).
Morphometric measures normalized to the PAM50 space were used to calculate the normative values across participants (whole cohort and separated by sex) at each intervertebral disc and at the middle of each vertebral level. Morphometric measures averaged across participants for each slice were compared between sex and MRI vendors using the Wilcoxon rank-sum test.
Results
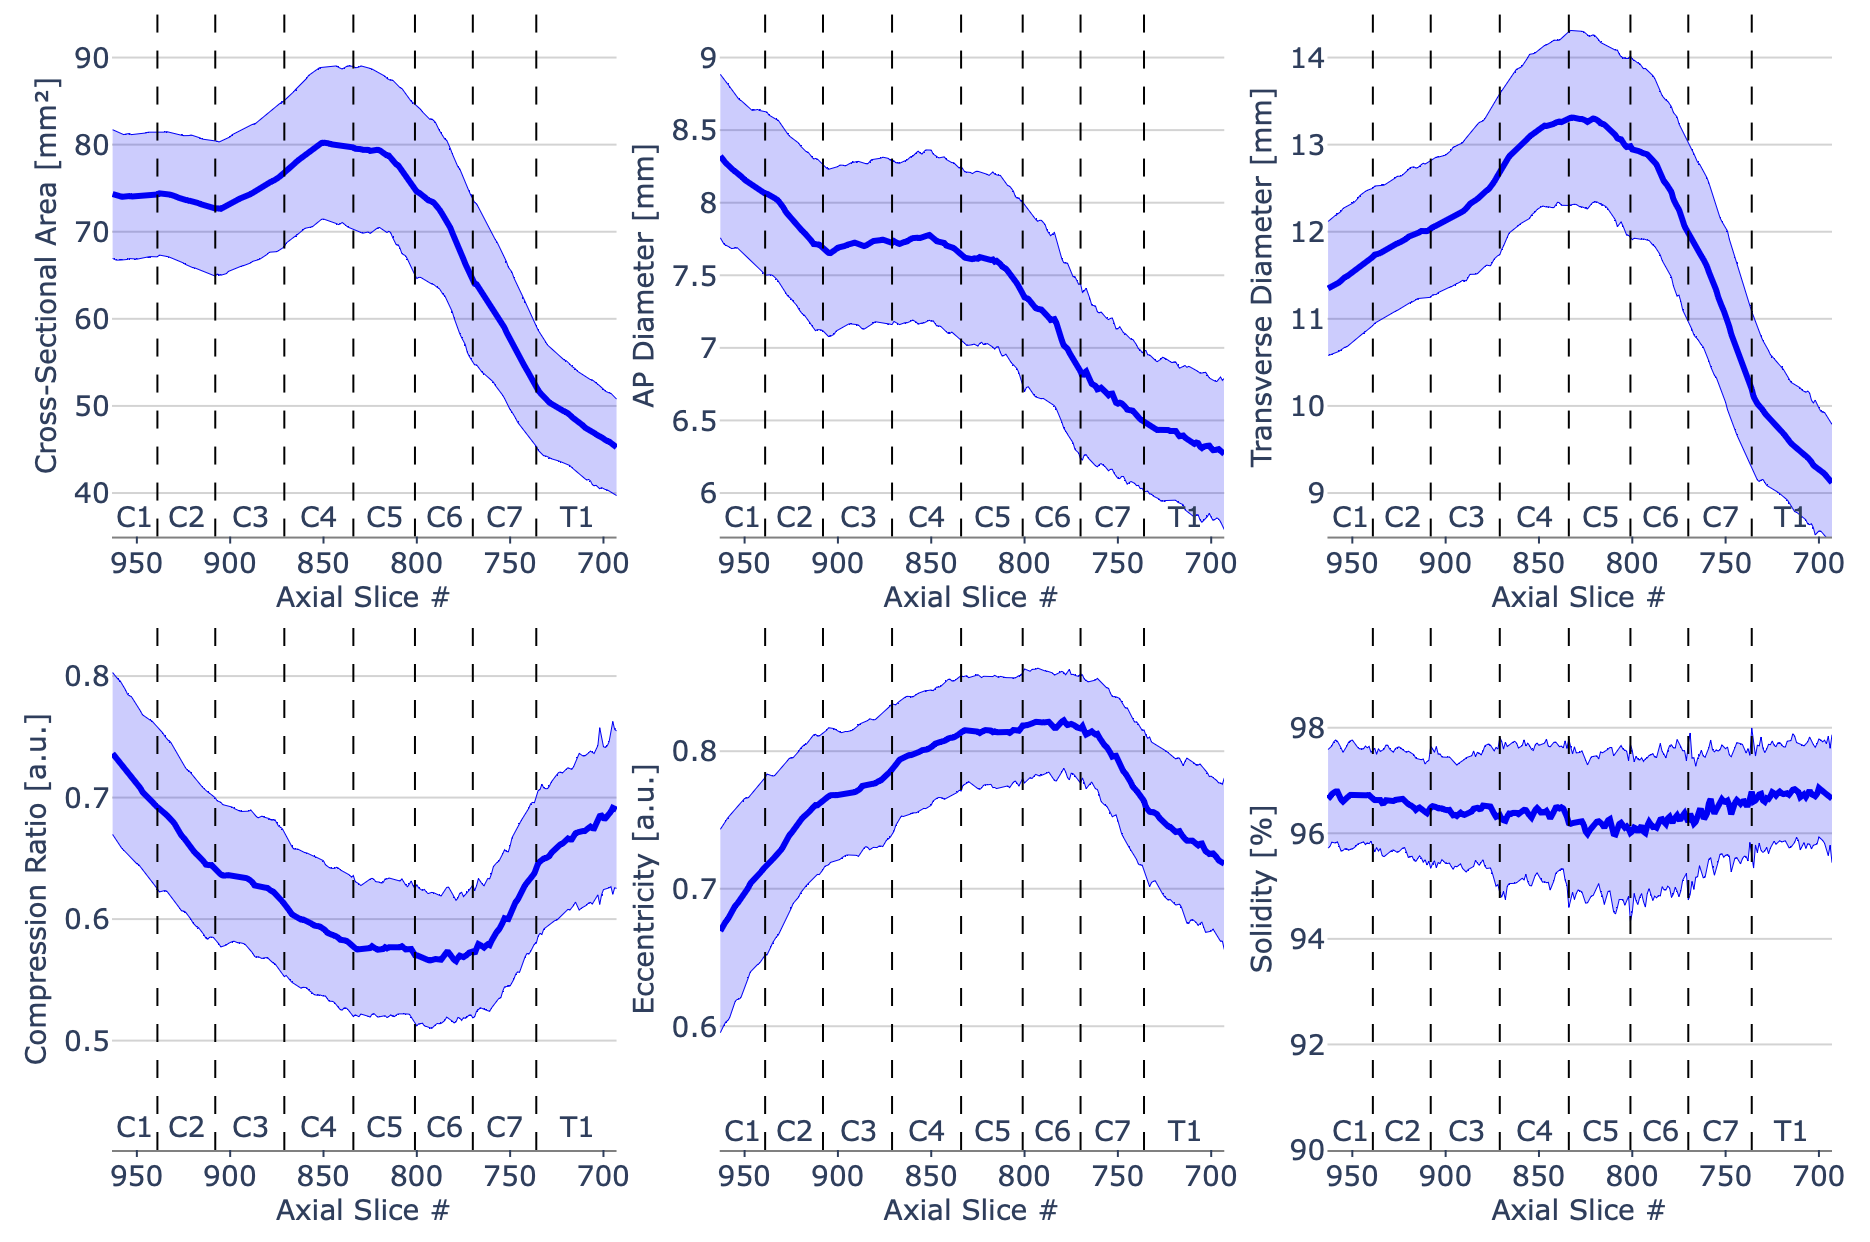
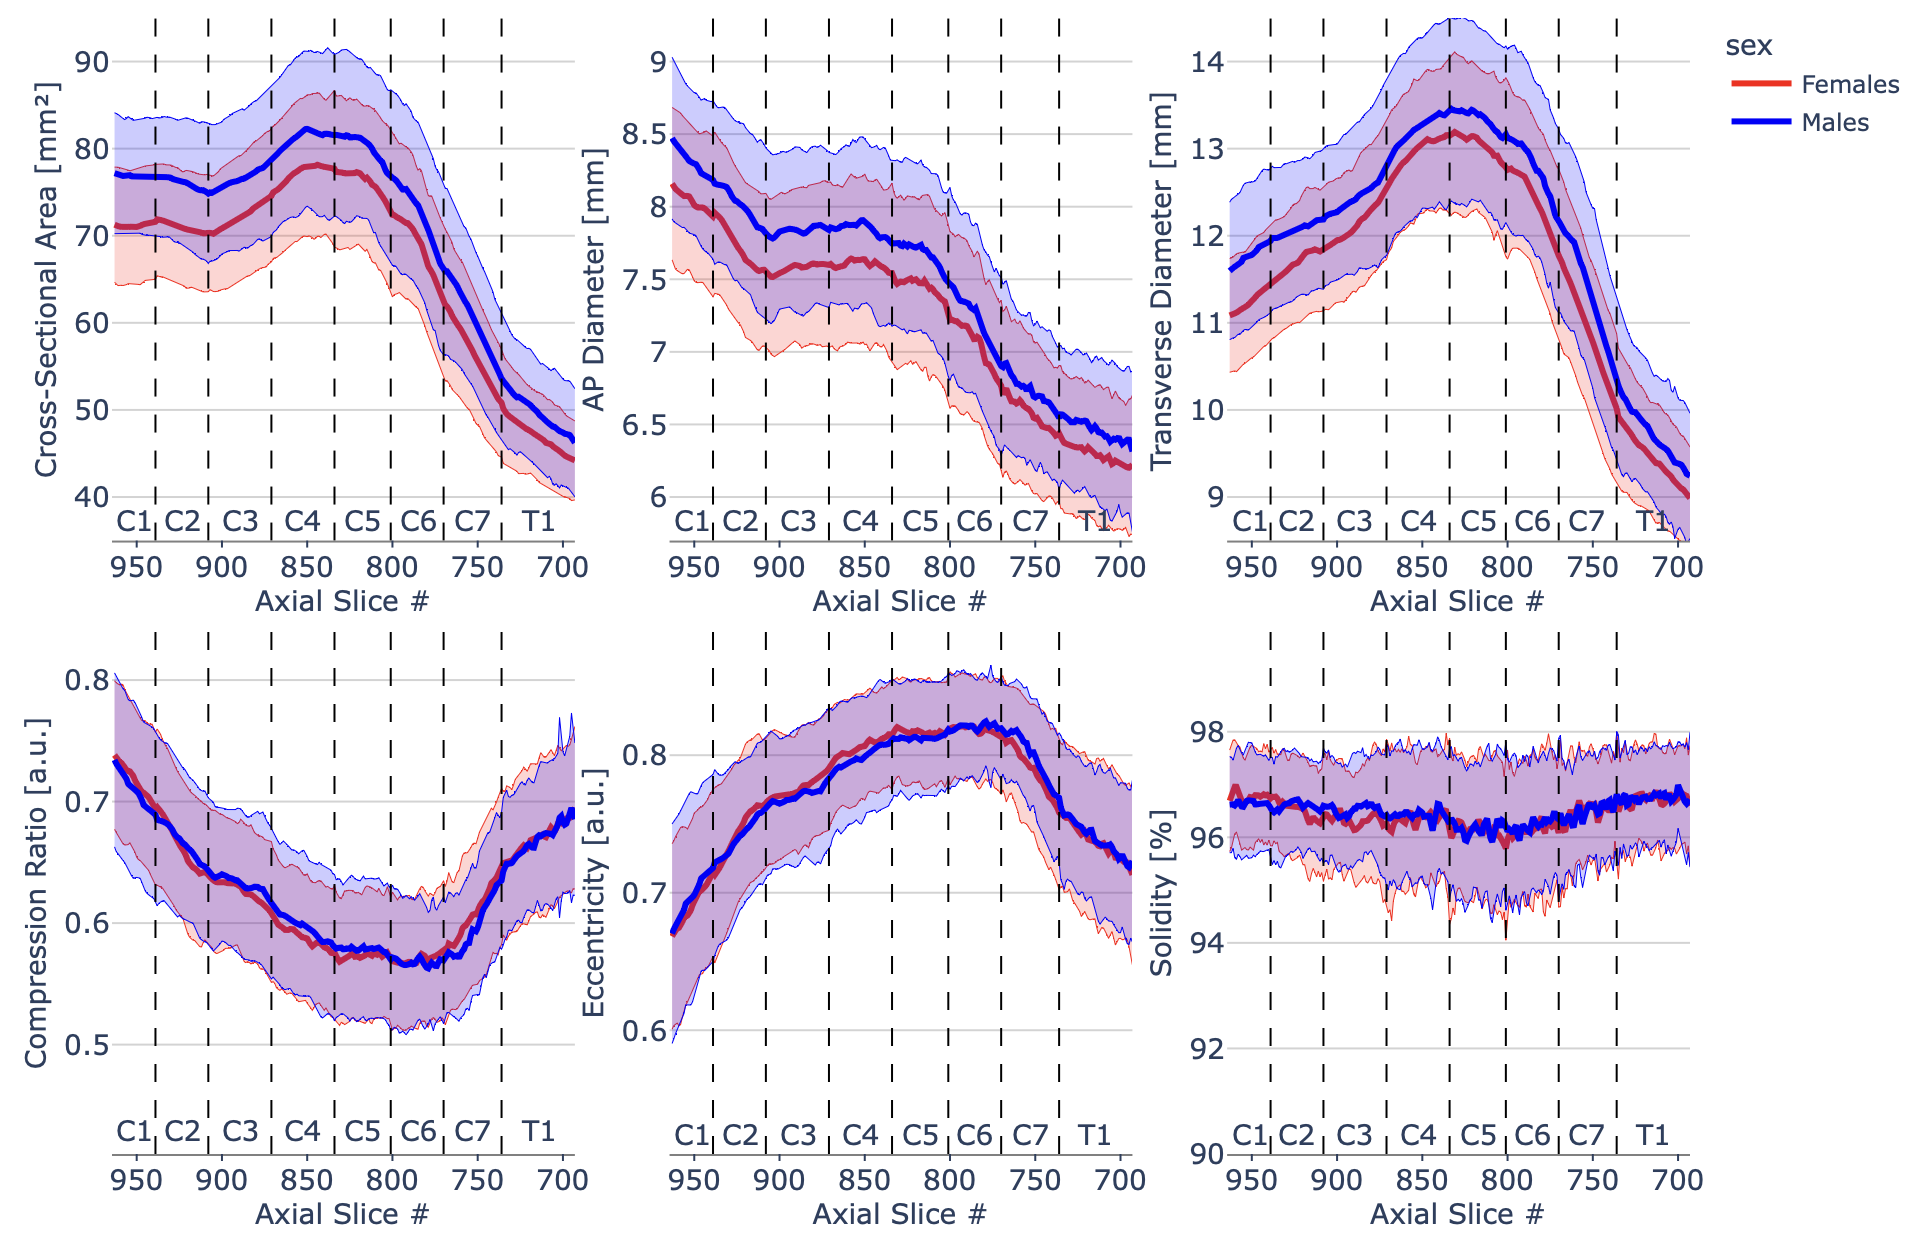
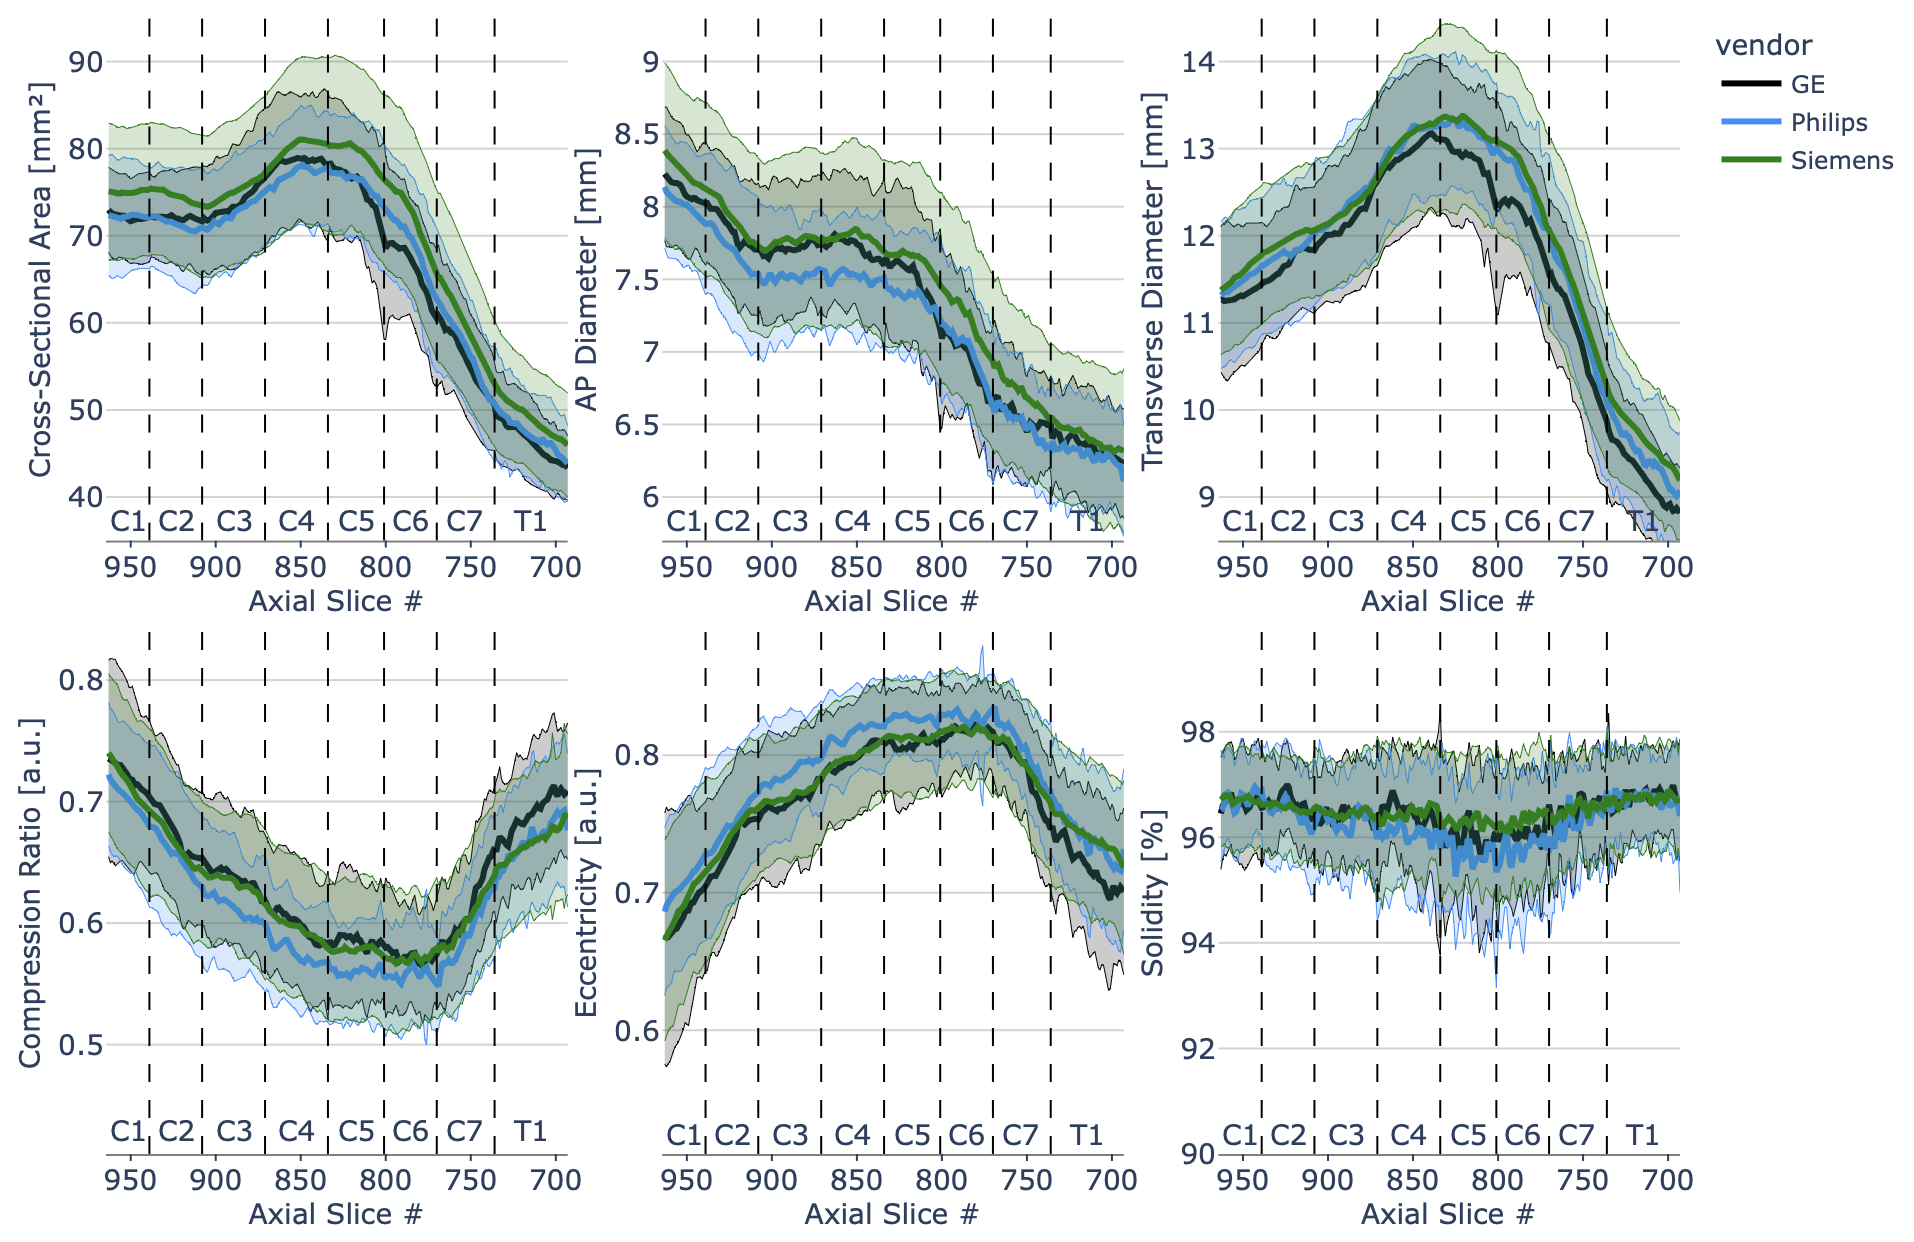
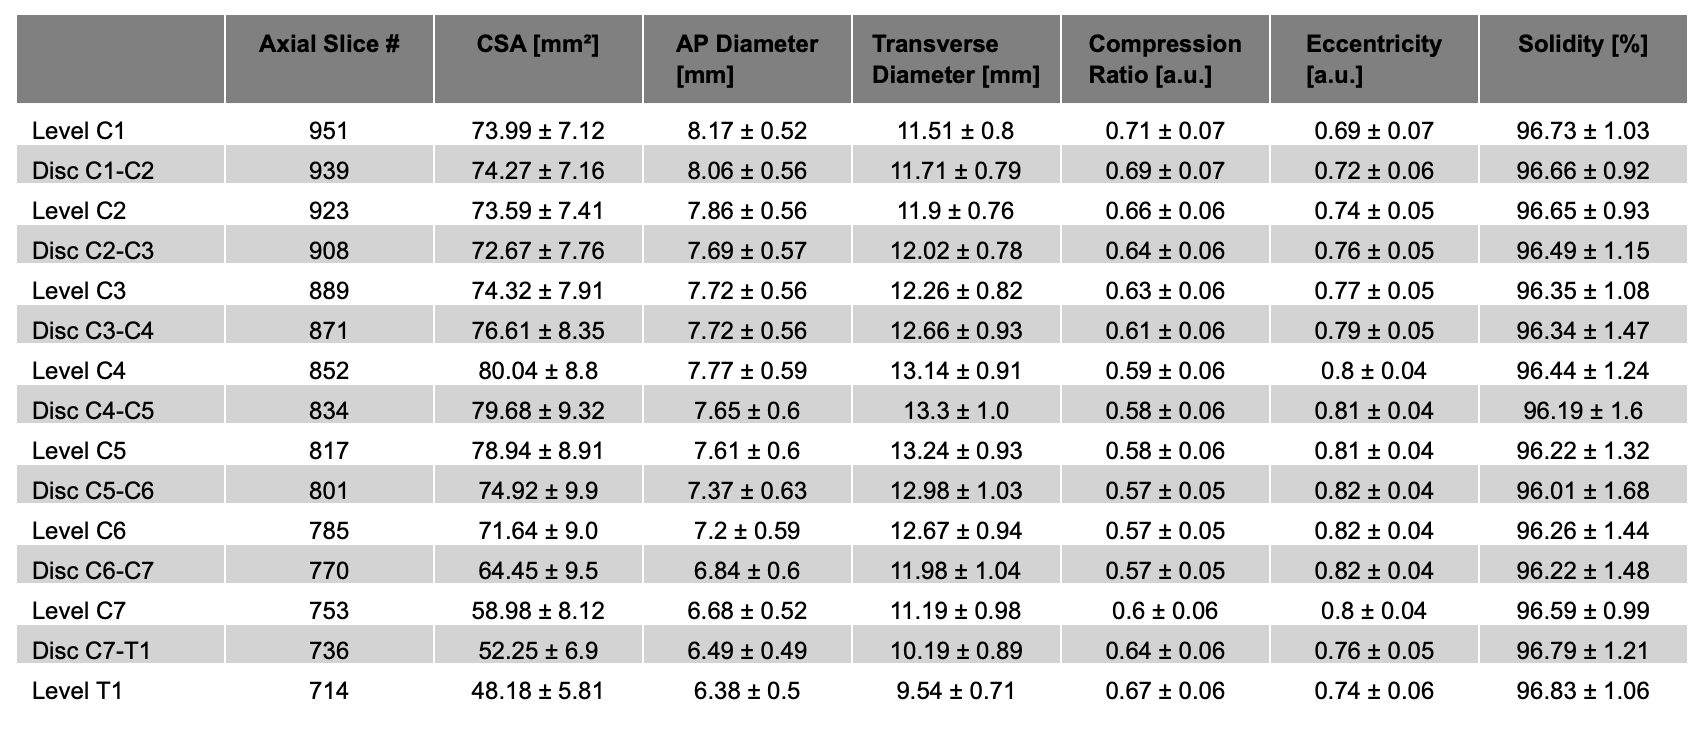
Figure 2 shows morphometric measures for the whole cohort (N=203), Figure 3 shows morphometric measures separated per sex (males: N = 105, females: N = 98), and Figure 4 shows morphometric measures separated for three MRI vendors (GE: N = 28, Philips: N = 36, Siemens: N = 139). For all figures, morphometric measures are plotted across individual slices with vertebral levels identified on the plot. Table 1 presents the normative values of the whole cohort, calculated as the mean and standard deviation across all 203 participants.Wilcoxon rank-sum test showed significant differences (p < .001) between males and females for CSA, AP diameter and transverse diameter and for the following comparisons: Siemens vs. Philips and Siemens vs. GE for CSA and AP diameter, Siemens vs. Philips for transverse diameter, and Siemens vs. Philips and Philips vs. GE for compression ratio, eccentricity and solidity.
Discussion
The proposed interactive database allows for convenient analysis of the morphometric measures for any slice in the PAM50 space. The normalization method is available as part of SCT v6.0 and higher and allows normalization based on sex, MRI vendors, and age decades. In comparison to traditional image-based registration, the proposed approach does not involve image transformations and, therefore, does not introduce distortions of spinal cord anatomy.The finding of mild spinal cord compression in 24% of spine-generic participants aligns with previous studies, which have reported the prevalence of asymptomatic spinal cord compression in up to 40% of the healthy population7,8.
The CSA measured in this study is consistent with the CSA measured in 50 healthy participants of a previous study3. Conversely, other studies reported either smaller or larger CSA9,10, which can be attributed to various factors, including differences in MRI contrast, variations in population ages, and variations in the segmentation methods used.
Conclusion
This study introduced an approach for the automatic normalization of spinal cord morphometric measures and computed normative values from a public database of healthy adults. The database and normalization method can be applied to new datasets using the Spinal Cord Toolbox (SCT) v6.0 and higher. Future research will focus on the validation of the method in pathologies, such as spinal cord injury. To promote transparency and reproducibility, the results presented in this abstract are available as interactive figures in a NeuroLibre preprint (https://preprint.neurolibre.org/10.55458/neurolibre.00017)11.Acknowledgements
Jan Valošek and Sandrine Bédard contributed equally and share co-first authorship.
Funded by the Canada Research Chair in Quantitative Magnetic Resonance Imaging [CRC-2020-00179], the Canadian Institute of Health Research [PJT-190258], the Canada Foundation for Innovation [32454, 34824], the Fonds de Recherche du Québec - Santé [322736, 324636], the Natural Sciences and Engineering Research Council of Canada [RGPIN-2019-07244], the Canada First Research Excellence Fund (IVADO and TransMedTech), the Courtois NeuroMod project, the Quebec BioImaging Network [5886, 35450], INSPIRED (Spinal Research, UK; Wings for Life, Austria; Craig H. Neilsen Foundation, USA), Mila - Tech Transfer Funding Program. Supported by the Ministry of Health of the Czech Republic, grant nr. NU22-04-00024. All rights reserved. JV has received funding from the European Union's Horizon Europe research and innovation programme under the Marie Sktodowska-Curie grant agreement No 101107932.
References
1. David, G. et al. Traumatic and nontraumatic spinal cord injury: pathological insights from neuroimaging. Nat. Rev. Neurol. 15, 718–731 (2019).
2. Mina, Y. et al. Cervical and thoracic cord atrophy in multiple sclerosis phenotypes: Quantification and correlation with clinical disability. NeuroImage: Clinical 30, 102680 (2021).
3. De Leener, B. et al. PAM50: Unbiased multimodal template of the brainstem and spinal cord aligned with the ICBM152 space. Neuroimage 165, 170–179 (2018).
4. De Leener, B. et al. SCT: Spinal Cord Toolbox, an open-source software for processing spinal cord MRI data. Neuroimage 145, 24–43 (2017).
5. Cohen-Adad, J. et al. Generic acquisition protocol for quantitative MRI of the spinal cord. Nat. Protoc. 16, 4611–4632 (2021).
6. Cohen-Adad, J. et al. Open-access quantitative MRI data of the spinal cord and reproducibility across participants, sites and manufacturers. Scientific Data 8, 219 (2021).
7. Kovalova, I. et al. Prevalence and imaging characteristics of nonmyelopathic and myelopathic spondylotic cervical cord compression. Spine 41, 1908–1916 (2016).
8. Smith, S. S., Stewart, M. E., Davies, B. M. & Kotter, M. R. N. The Prevalence of Asymptomatic and Symptomatic Spinal Cord Compression on Magnetic Resonance Imaging: A Systematic Review and Meta-analysis. Global Spine Journal 11, 597–607 (2021).
9. Horáková, M. et al. Semi-automated detection of cervical spinal cord compression with the Spinal Cord Toolbox. Quant. Imaging Med. Surg. 12, 2261–2279 (2022).
10. Kesenheimer, E. M. et al. Normalization of Spinal Cord Total Cross-Sectional and Gray Matter Areas as Quantified With Radially Sampled Averaged Magnetization Inversion Recovery Acquisitions. Front. Neurol. 12, (2021).
11. Valošek, J., Bédard, S., Keřkovský, M., Rohan, T. & Cohen-Adad, J. A database of the healthy human spinal cord morphometry in the PAM50 template space. NeuroLibre 3, 17 (2023).
Figures