2324
Neurometabolic Changes Post Stroke are Associated with Cerebral Artery Distributions: A Combined 3D 1H-MRSI and MRA Study1School of Biomedical Engineering, Shanghai Jiao Tong University, Shanghai, China, 2Radiology Department, Renji Hospital, Shanghai Jiao Tong University of Medicine, Shanghai, China, 3Department of Radiology, The First Affiliated Hospital of South China of University, South China of University, Hengyang, China, 4Beckman Institute for Advanced Science and Technology, University of Illinois at Urbana-Champaign, Urbana, IL, United States, 5Department of Electrical and Computer Engineering, University of Illinois at Urbana-Champaign, Urbana, IL, United States, 6The National Center for Supercomputing Applications, University of Illinois at Urbana-Champaign, Urbana, IL, United States
Synopsis
Keywords: Stroke, Stroke, MRSI
Motivation: Elucidating the time-dependent pathological evolution of infarction is essential for the effective management of stroke.
Goal(s): Our goal was to investigate the influence of vascular characteristics on neurometabolites changes within lesions at different times post stroke.
Approach: 3D 1H-MRSI scanning using SPICE technology (scan time: 8 minutes, resolution: 2 × 3 × 3 mm3, FOV: 240 × 240 × 72 mm3) was performed on 74 acute stroke patients. The neurometabolites maps were compared with a statistical atlas of cerebral artery.
Results: We showed the vessel distributions were related to the neurometabolites changes following ischemic stroke, collectively improving the prediction of stroke symptom onset.
Impact: Using fast high-resolution 1H-MRSI together with cerebral artery atlas, our study showed that the interdependence between vessel distribution and neurometabolites changes in ischemic stroke. The finding may help find useful biomarkers for modeling stroke lesion evolution and symptom onset prediction.
Introduction
Acute ischemic stroke due to cerebral artery occlusion leads to disrupted metabolism, compromised cellular energy supplies, post-ischemic inflammation, and the progressive demise of neurons and glial cells1. The lesion development is closely linked to patients' prognoses. For instance, stroke patients with slowly expanding infarcts experienced substantial clinical benefits from thrombectomy2. Therefore, the effective management of stroke relies on precise and efficient diagnostic tools capable of elucidating the time-dependent pathological features of ischemic tissues. Proton MR spectroscopic imaging (1H-MRSI) provides a unique tool for noninvasive mapping of neurometabolites, including N-acetylaspartate (NAA) as a marker of neuronal integrity, creatine as a marker of energy metabolism, choline as a marker of cell membrane turnover, and lactate as a marker of anaerobic glycolysis. In this study, utilizing a fast high-resolution 1H-MRSI technique, named SPICE (SPectroscopic Imaging by exploiting spatiospectral CorrElation)3-6, we obtained neurometabolites maps from acute stroke patients and compared them with a statistical atlas of cerebral artery. We investigated the influence of vascular characteristics on neurometabolites changes, and how they were related to symptom onset time of ischemic stroke patients.Methods
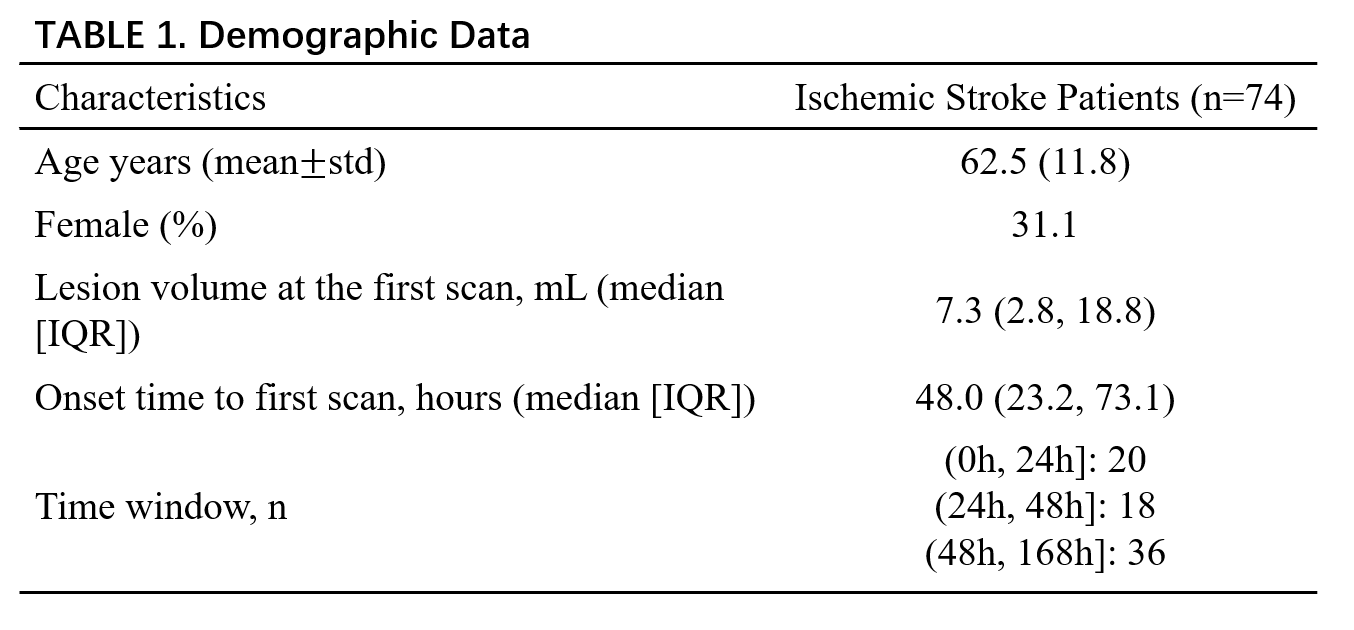
Seventy-four ischemic stroke patients were included in this study. Exclusion criteria included hemorrhage, non-stroke lesion on structural MRI or poor image quality. All stroke lesions reside in the middle cerebral artery (MCA) territory (>80% of lesion size) defined by territories atlas7. The patients were scanned at 2.25 to 151 hours post onset. Demographics is listed in Table 1. The acquisition protocol included 3D MRSI using the SPICE sequence (TR/TE=160/1.6ms, resolution = 2.0×3.0×3.0 mm3, FOV = 240×240×72 mm3, scan time = 8 min), MPRAGE (TR/TE/TI = 2400/2.13/1100 ms, resolution = 1.0×1.0×1.0 mm3, FOV = 256 mm), DWI (TR/TE = 4300/[74,125] ms, resolution = 1.3×1.3×40 mm3, FOV = 240 mm, b=0 and 1000s/mm2), and FLAIR imaging (TR/TE/TI = 9000/89/2500ms, resolution = 0.5×0.5×2.0 mm3, FOV = 240 mm). Neurometabolites maps were obtained using the standard processing pipeline of SPICE4, 6. The neurometabolites maps were normalized with z-score for each patient and registered to MNI space. To capture the vessel distributions, we used the public statistical atlas8 of cerebral arteries generated from MRA datasets. The vessel load within the lesion was defined as the mean artery probability. Patients were divided into hyperacute (0–24 hours) and acute (24 hours to 1 week) groups. We randomly chose up to ten patches (3×3×3 mm3) in the lesion of each subject. Pearson correlation analysis was performed to investigate the relationship between neurometabolites concentrations and vessel load in each group. The patches were divided into high and low vessel load groups thresholded by the median vessel probability in the atlas. The changes of neurometabolites concentrations from hyperacute to acute stage in different groups were compared using Mann-Whitney U tests. Prediction model of the symptom onset time was built by support vector regression using radiomics features derived from the neurometabolites and artery probability maps for all patients.Results
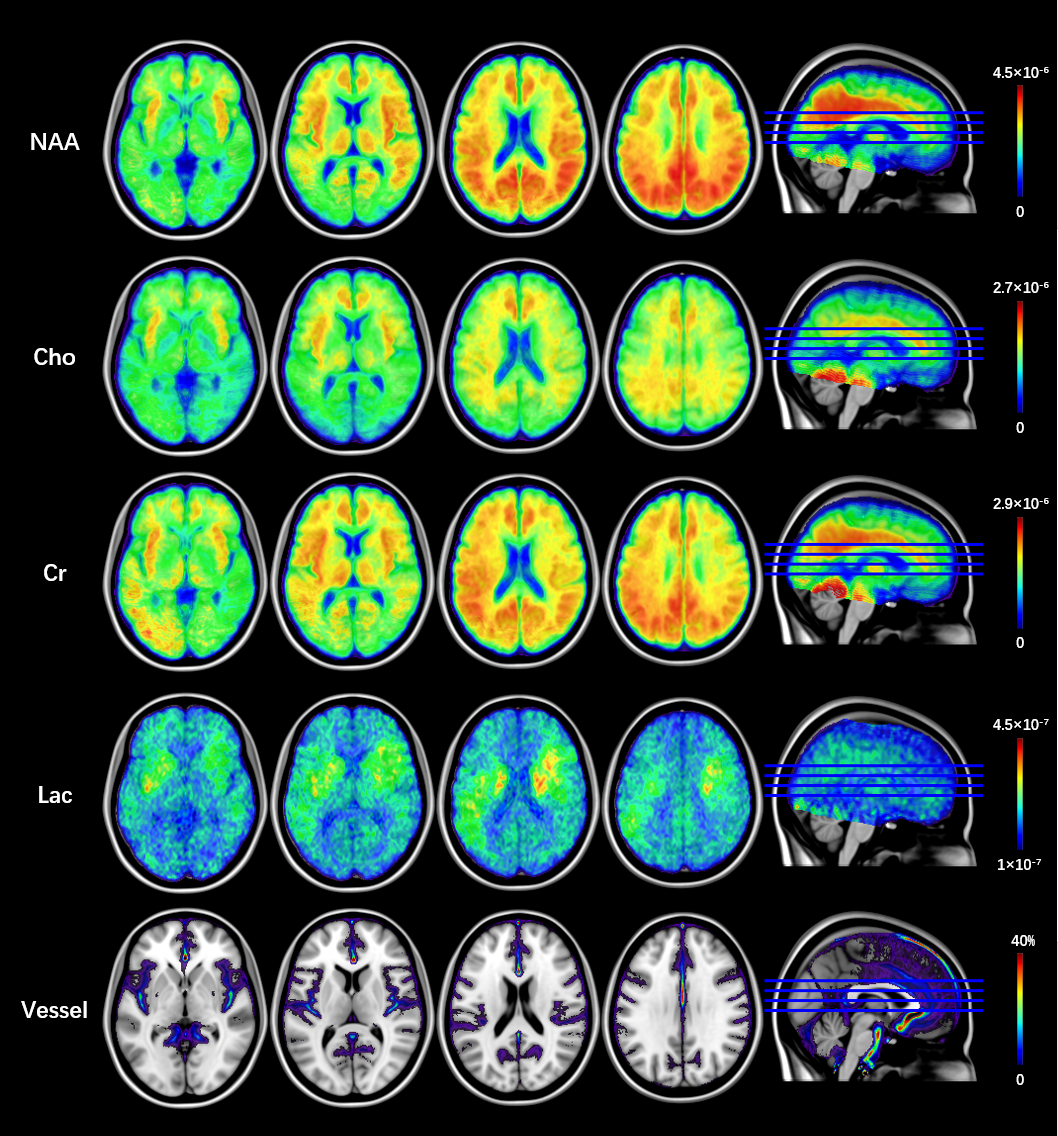
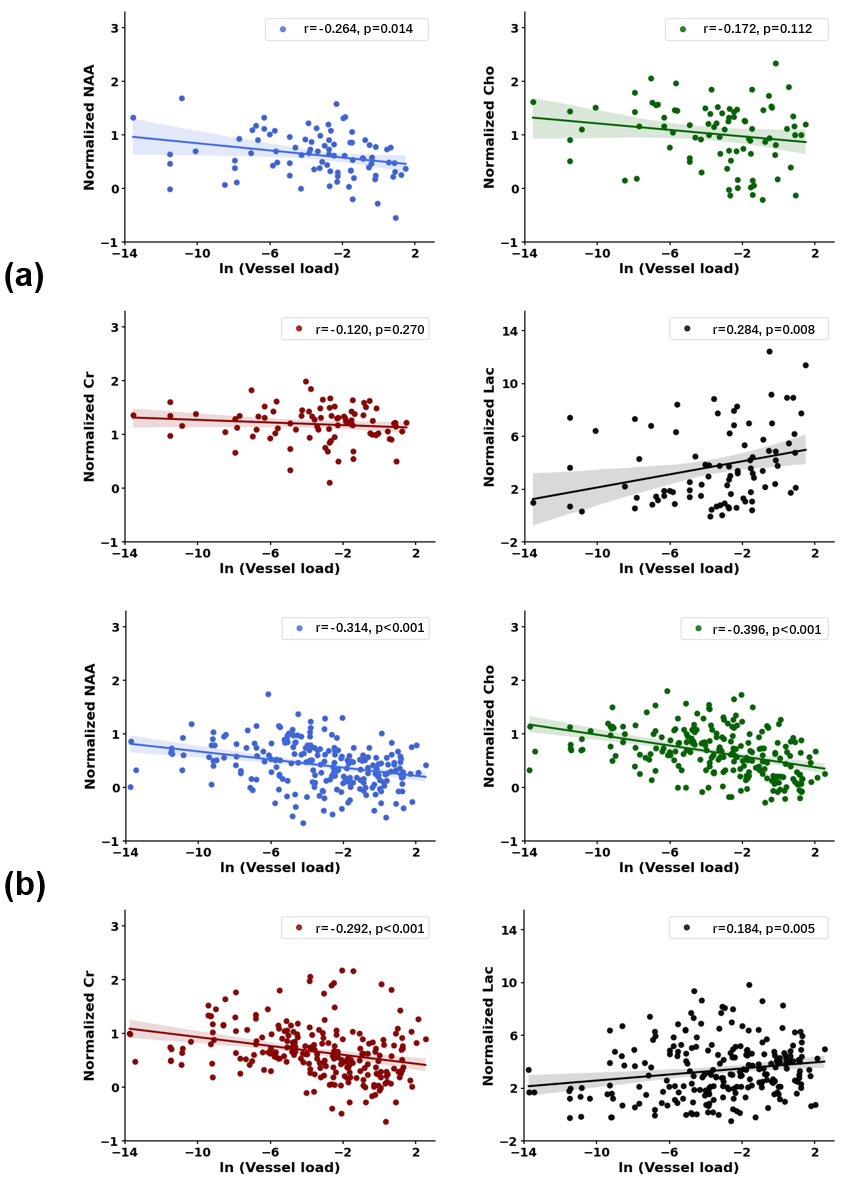
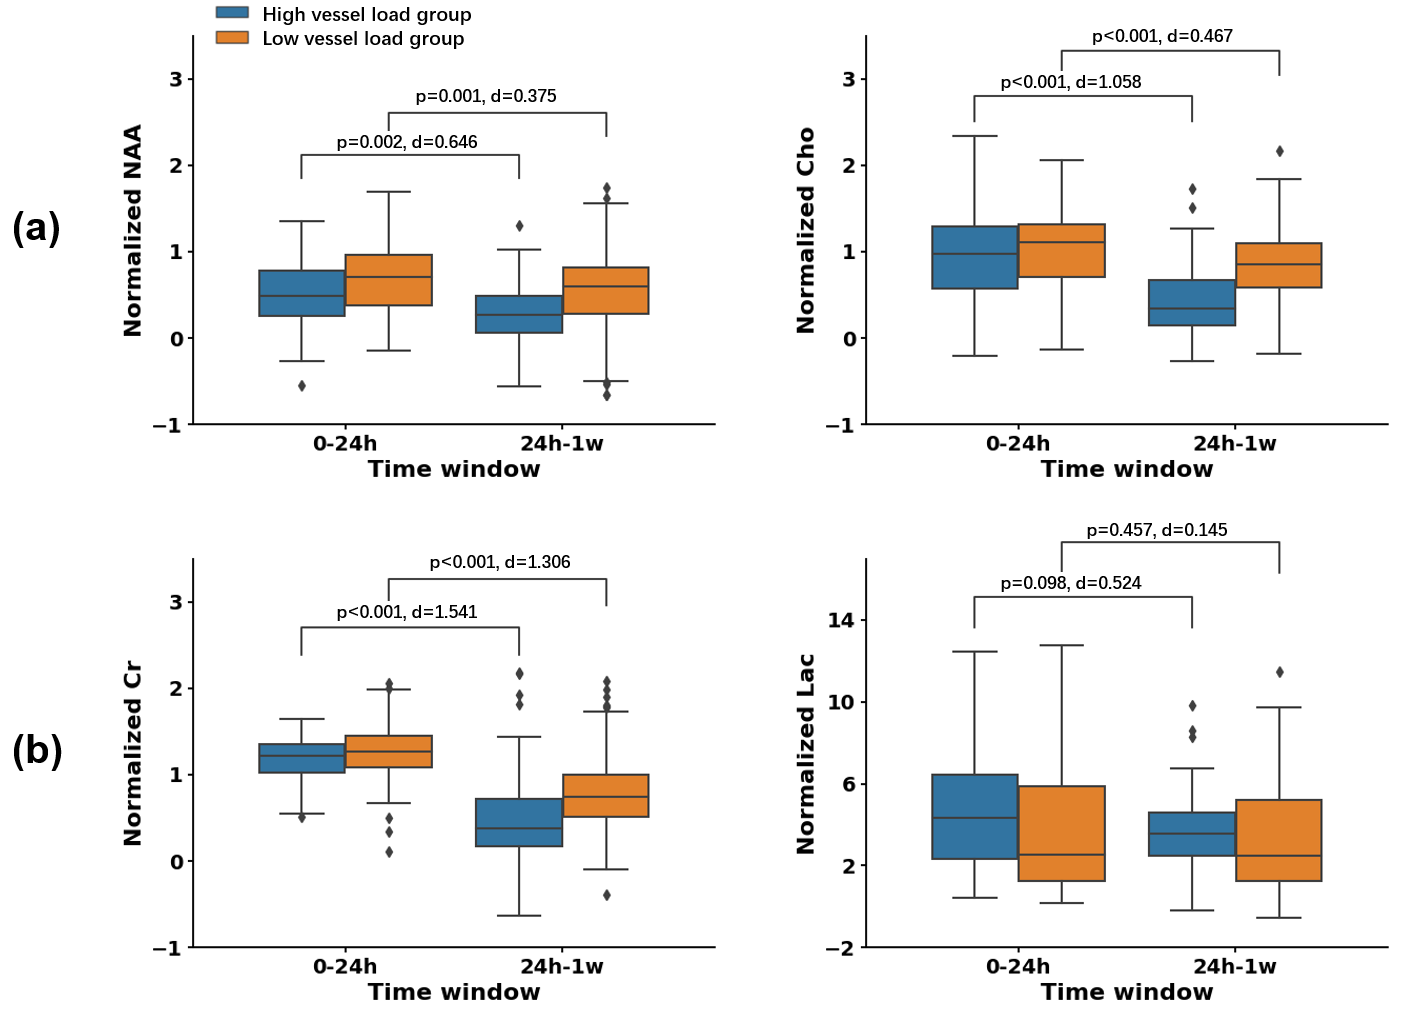
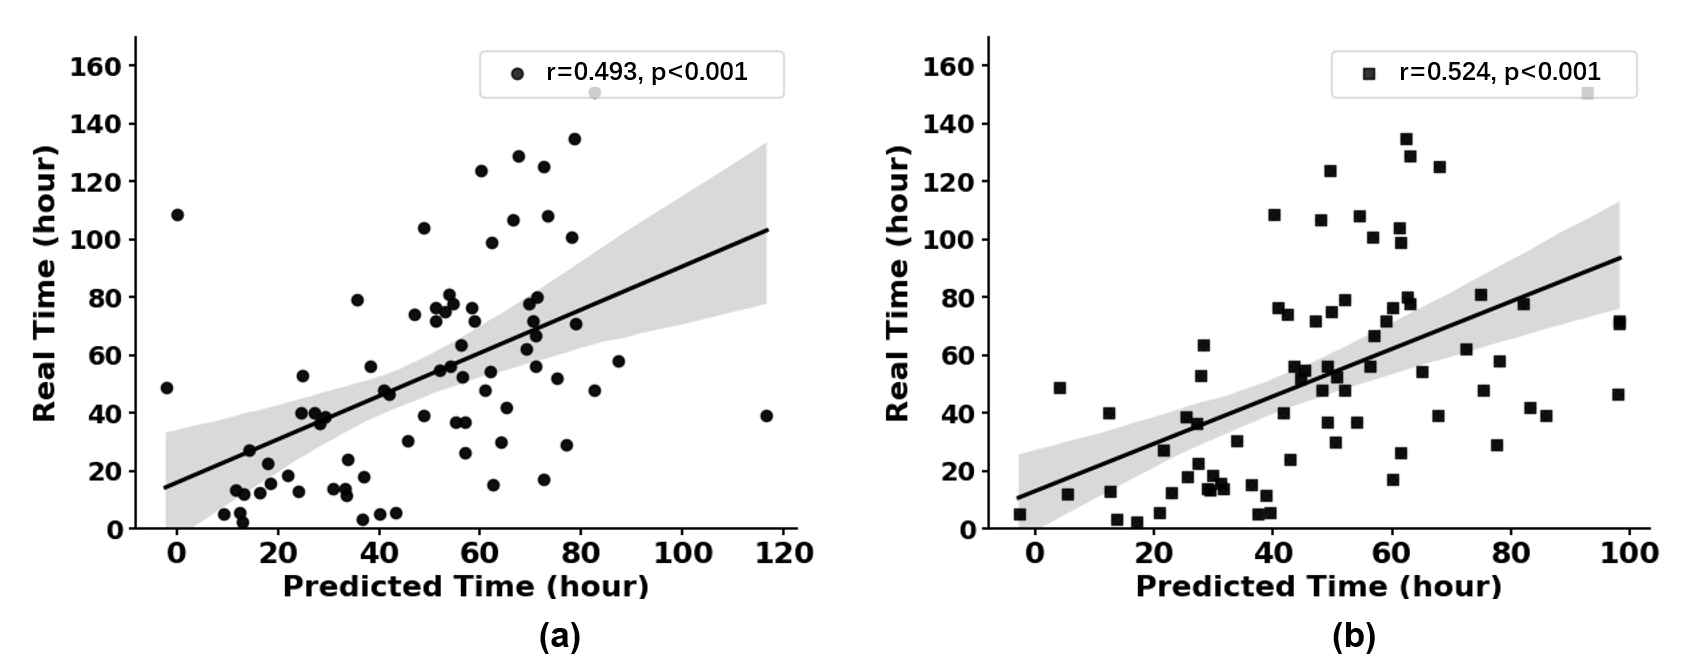
The statistical neurometabolites maps (NAA, choline, creatine, and lactate) obtained across the entire group, along with the cerebral arteries atlas are shown in Fig.1. The spatial distribution patterns for artery distribution and neurometabolic alterations could be visualized. Figure 2 shows the correlations between neurometabolites concentrations and vessel load across hyperacute and acute stroke, respectively. In the hyperacute stage, a significant decrease of NAA with the increase of vessel load was observed (r = -0.264, p = 0.014). In the acute stage, negative correlations of NAA, Cho and Cr with vessel load were shown (NAA: r = -0.314, p <0.001, Cho: r = -0.396, p <0.001, Cr: r = -0.292, p <0.001). In both hyperacute stage and acute stage, a significant increase of Lac with the increase of vessel load was observed (acute: r=0.284, p=0.008, hyperacute: r=0.184, p=0.005). As shown in Fig. 3, NAA, Cho, and Cr levels significantly decreased from hyperacute to acute stroke (NAA: p<0.01; Cho, Cr: p<0.001). The Cohen’s d values indicated that the effect size in the high vessel load group is larger than that in the low vessel load group. Figure 4 shows the prediction performance for the stroke onset time using neurometabolic and vessel maps. The model achieved improved prediction performance when we combined the vessel load map with the neurometabolites maps.Conclusion
Using fast high-resolution 1H-MRSI together with cerebral artery atlas, our study showed that the distribution of blood vessels within the affected region may impact neurometabolites changes in the region following ischemic stroke. Our findings suggest that incorporating information about both vessel and neurometabolic distributions might improve the prediction of stroke symptom onset.Acknowledgements
This work was supported by Shanghai Pilot Program for Basic Research—Shanghai Jiao Tong University (21TQ1400203), the Program for Professor of Special Appointment (Eastern Scholar) at Shanghai Institutions of Higher Learning; Key Program of Multidisciplinary Cross Research Foundation of Shanghai Jiao Tong University (YG2021ZD28, YG2023ZD22).References
1. DIRNAGL U, IADECOLA C, MOSKOWITZ M A. Pathobiology of ischaemic stroke: an integrated view. Trends Neurosci. 1999; 22: 391-397.
2. ALBERS G W, MARKS M P, KEMP S, et al. Thrombectomy for Stroke at 6 to 16 Hours with Selection by Perfusion Imaging. New England Journal of Medicine. 2018; 378: 708-718.
3. LAM F, MA C, CLIFFORD B, et al. High-resolution (1) H-MRSI of the brain using SPICE: Data acquisition and image reconstruction. Magn Reson Med. 2016; 76: 1059-1070.
4. PENG X, LAM F, LI Y, et al. Simultaneous QSM and metabolic imaging of the brain using SPICE. Magn Reson Med. 2018; 79: 13-21.
5. LI Y, LAM F, CLIFFORD B, et al. A Subspace Approach to Spectral Quantification for MR Spectroscopic Imaging. IEEE Transactions on Biomedical Engineering. 2017; 64: 2486-2489.
6. MA C, LAM F, JOHNSON C L, et al. Removal of nuisance signals from limited and sparse 1H MRSI data using a union-of-subspaces model. Magn Reson Med. 2016; 75: 488-497.
7. LIU C-F, HSU J, XU X, et al. Digital 3D Brain MRI Arterial Territories Atlas. Scientific Data. 2023; 10: 74.
8. MOUCHES P, FORKERT N D. A statistical atlas of cerebral arteries generated using multi-center MRA datasets from healthy subjects. Sci Data. 2019; 6: 29.
Figures