2319
Hemodynamic analysis of non-stenotic middle cerebral artery in patients with cerebral ischemia based on 4D Flow MRI1First Affiliated Hospital of Harbin Medical University, Harbin, China, 2Philips Healthcare, Beijing, China, Beijing, China
Synopsis
Keywords: Stroke, Quantitative Imaging, 4D flow MRI、Hemodynamics
Motivation: The change of hemodynamics in patients with symptomatic cerebral ischemia are not clear.
Goal(s): This study aims to explore the difference of hemodynamic characteristics in non-stenotic middle cerebral artery (MCA) between healthy subjects and cerebral ischemia patients.
Approach: The multiple hemodynamic parameters in the proximal, curved and distal segments of MCA were quantitatively analyzed in these two groups by using 4D flow MRI.
Results: The results showed that the peak blood flow velocity was lower and the circumferential WSS reduced in MCA, the energy loss impaired in the M1 segment of MCA when compared cerebral ischemia patients with healthy subjects.
Impact: This study was based on 4D flow MRI to explore the hemodynamic characteristics of cerebral ischemia in non-stenosis MCA, which is helpful to reveal the mechanism of cryptogenic stroke and provides a possibility for future prediction of stroke risk.
Introduction:
Hemodynamics has been proved to play a vital role in the formation and development of various vascular diseases [1,2]. Local hemodynamic environment abnormalities are associated with irregular vascular geometry [3]. 4D flow magnetic resonance imaging (4D Flow MRI) is a new method in vivo, which can be used for noninvasive evaluation of multiple hemodynamic parameters during cardiac cycle [4]. Previous studies have confirmed the feasibility of 4D flow technology in heart and aorta [5]. However, few studies focus on the evaluation of intracranial arterial hemodynamics. Therefore, this study assumes that there would be changes in the blood flow of the middle cerebral artery (MCA) in healthy subjects, and further investigate the variation in patients with cerebral ischemia of anterior circulation by utilizing 4D flow technology.Methods:
Patients with ischemic symptoms and healthy subjects without ischemic symptoms were recruited for 3.0T MRI scanning (Ingenia Elition; Philips Healthcare, Best, the Netherlands), including diffusion weighted imaging (DWI), fluid attenuated inversion recovery (Flair) and 4D Flow sequences. CVI software was used for data analysis by experienced radiologist (J.L.S.,5 years of experience and Y.C.,2 years of experience). The position was measured as follows [4]: the most curved segment of MCA is visually evaluated as the measurement plane of the curved segment on the 4D flow image. The junction of carotid artery and MCA is taken as the measurement plane of the proximal segment, then the junction of M1 segment and M2 segment of MCA considers as the distal segment. Hemodynamic parameters of the proximal segment, the curved segment and the distal segment are measured, including blood flow, peak velocity, wall shear stress (WSS), pressure, and energy loss.Results:
In this study, 21 healthy subjects (55.67±7.89 years) and 30 patients (58.93±6.63 years) with anterior circulation cerebral ischemia were recruited. A typical patient illustration is shown in Figure1. 39 and 24 MCAs were included in the healthy and cerebral ischemia population, respectively. The hemodynamic distribution of MCA within the group and the difference of blood flow parameters between these two groups were showed in Table 1. The results showed that the hemodynamic distribution of MCA in the two groups was similar, the total blood flow in the proximal segment was the largest. The max pressure and energy loss of the entire M1 segment of MCA were greater than those from proximal segment to curved section and from curved segment to distal segment (P < 0.01). In the cerebral ischemic population, the peak blood flow velocity in the proximal and curved segments of MCA was lower than that in the healthy population, and the circumferential WSS in all segments of MCA was lower than that in the healthy population . In the M1 segment of MCA, the max and average energy loss were lower than those in the control group (P < 0.05) (Table1 and Figure2).Discussion:
The results suggest that vascular geometry alters hemodynamics with regularity. In both groups, proximal blood flow achieved greatest, possibly due to a larger luminal cross-sectional area in the proximal segment [6]. The max pressure and energy loss, average energy loss within the entire M1 segment of MCA tend to surpass those of its individual segments, which could be attributed to the distance factor. It could be explained that longer segments of blood vessels exhibit greater values in these parameters. In the experimental group, although the appearance of the blood vessels was normal, there may be stiffness or positive remodeling of the vessel wall. The outcome of these phenomena is the occurrence of microstructural alterations, leading to lower peak blood flow velocities in the proximal and curved segments [7]. Additionally, WSS and flow velocity were lower in the experimental group, which may be the cause of further development of atherosclerosis [8]. The results of this study demonstrate the potential of 4D flow MRI in evaluating intracranial hemodynamics in patients with ischemic cerebrovascular disease.Conclusions:
The hemodynamic distribution of MCA in healthy subjects and cerebral ischemia subjects is similar. In patients with cerebral ischemia ,the hemodynamics of MCA is lower than that of healthy subjects in peak blood flow velocity, circumferential WSS and energy loss.Acknowledgements
NoneReferences
[1]Wu C, Schnell S, Vakil P, et al. In Vivo Assessment of the Impact of Regional Intracranial Atherosclerotic Lesions on Brain Arterial 3D Hemodynamics. AJNR Am J Neuroradiol. 2017;38(3):515-522. doi:10.3174/ajnr.A5051
[2]Zhang M, Peng F, Li Y, He L, Liu A, Li R. Associations between morphology and hemodynamics of intracranial aneurysms based on 4D flow and black-blood magnetic resonance imaging. Quant Imaging Med Surg. 2021;11(2):597-607. doi:10.21037/qims-20-440
[3]Detmer Felicitas J., Chung Bong Jae., Jimenez Carlos., Hamzei-Sichani Farid., Kallmes David., Putman Christopher., Cebral Juan R.(2019). Associations of hemodynamics, morphology, and patient characteristics with aneurysm rupture stratified by aneurysm location. Neuroradiology, 61(3), 275-284. doi:10.1007/s00234-018-2135-9
[4]Bai X, Fu M, Li Z, et al. Distribution and regional variation of wall shear stress in the curved middle cerebral artery using four-dimensional flow magnetic resonance imaging. Quant Imaging Med Surg. 2022;12(12):5462-5473. doi:10.21037/qims-22-67
[5]Bissell Malenka M., Raimondi Francesca., Ait Ali Lamia. et al. (2023). 4D Flow cardiovascular magnetic resonance consensus statement: 2023 update. J Cardiovasc Magn Reson, 25(1), 40. doi:10.1186/s12968-023-00942-z
[6]Hill Ethan C., Housh Terry J., Smith Cory M., Keller Joshua L., Schmidt Richard J., Johnson Glen O.(2018). The Contributions of Arterial Cross-Sectional Area and Time-Averaged Flow Velocity to Arterial Blood Flow. J Med Ultrasound, 26(4), 186-193. doi:10.4103/JMU.JMU_20_18
[7]Liu Jinbo., Wang Ying., An Huijie., Liu Jia., Wei Jinru., Wang Hongyu., Wang Guang.(2016). Correlation between arterial stiffness and coronary flow velocity reserve in subjects with pulse wave velocity >1400 cm/s. Clin Exp Hypertens, 38(1), 89-94. doi:10.3109/10641963.2015.1060988
[8]Soulis, J, Fytanidis, D, Seralidou, K, et al. Wall shear stress oscillation and its gradient in the normal left coronary artery tree bifurcations. HIPPOKRATIA. 2014; 18 (1): 12-6. PMID: 25125945
Figures
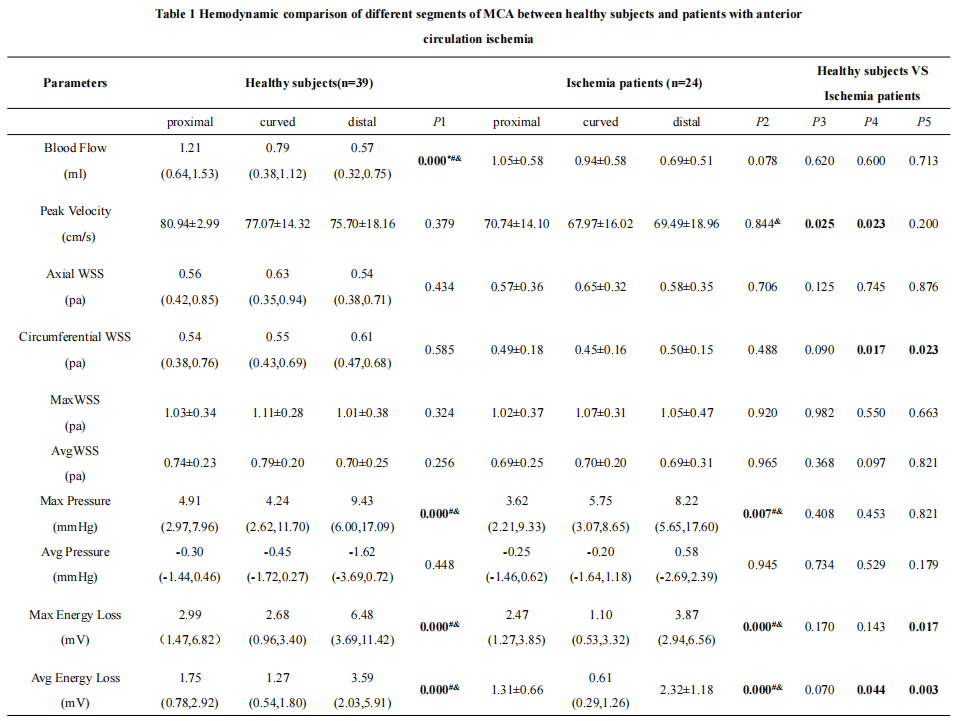
Table 1 Note: The difference between proximal segment, curved segment and distal segment in healthy people(P1)and ischemia patients(P2), respectively. * represents the difference between the proximal segment and curved segment. # represents the difference between the curved segment and distal segment. & represents the difference between the proximal segment and distal segment. The difference of parameters in proximal segment(P3),curved segment(P4),distal segment(P5)between healthy people and ischemic patients.
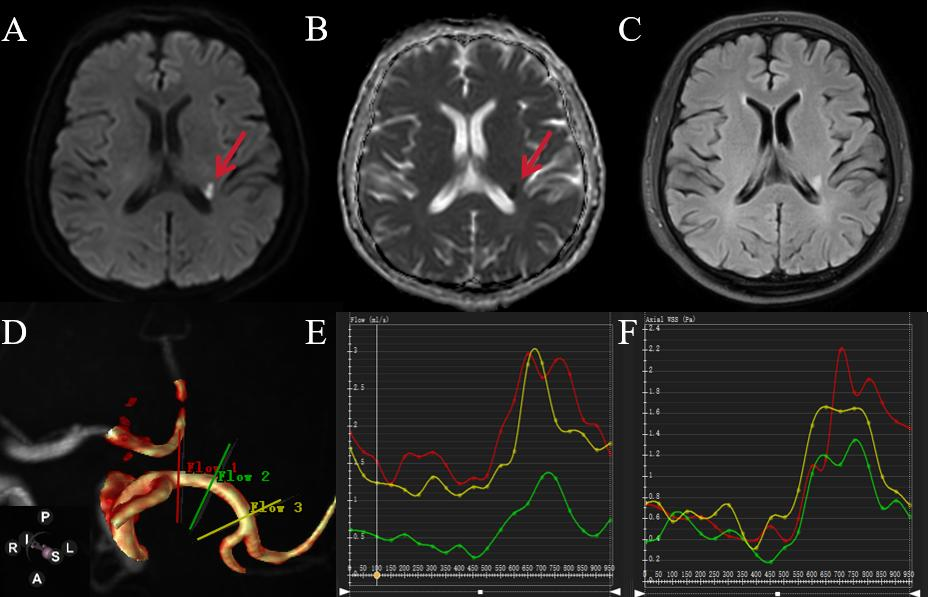
Figure1:A 61-year-old male patient was admitted to the hospital because of weakness of the right limb. DWI (A) and ADC (B) images suggest acute cerebral infarction. Flair images (C) showed that there was no old cerebral infarction in the left hemisphere.4D-Flow image (D) generates MCA simulation image, and shows that left MCA has no stenosis, and the selected measurement position is as shown in the figure (line). The blood flow parameter values automatically generated in each measurement plane are shown in Figures E and F.
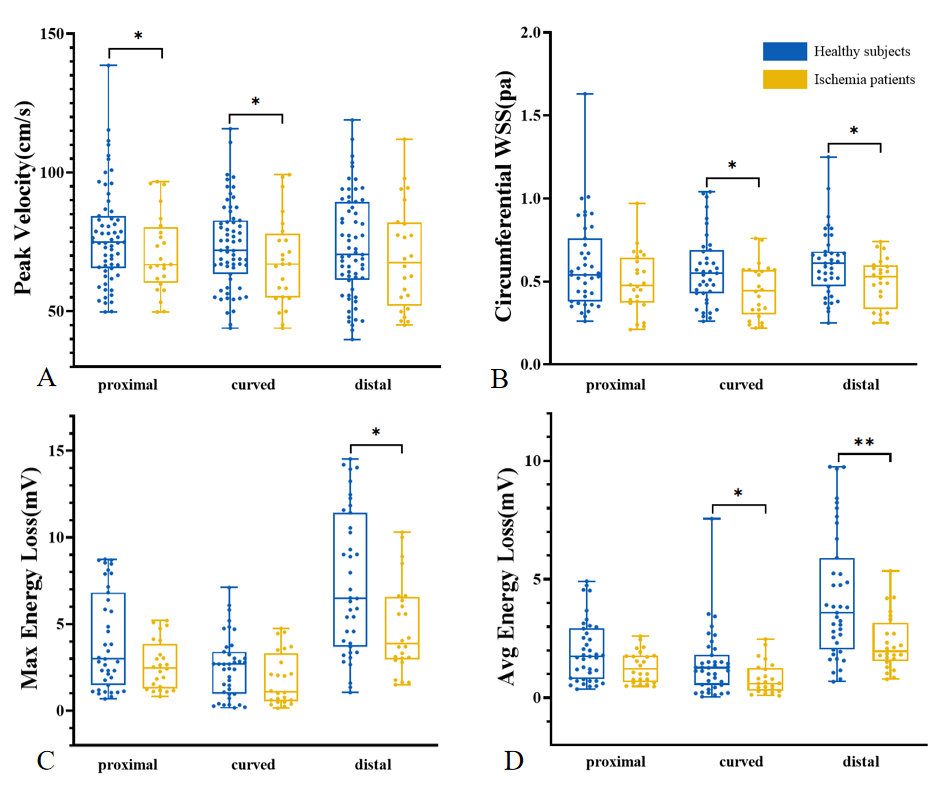
Figure2: The difference in peak velocity (A), circumferential WSS (B), Max and Avg energy loss (C and D) between healthy subjects (blue) and ischemia patients (yellow) in the proximal, curved and distal segments. * indicates p < 0.05, **indicates p < 0.01.