2317
Evaluating Inflammation in Middle Cerebral Arterial Plaques with CAIPIRINHA-Dixon-TWIST DCE-MRI1Department of Radiology Beijing Chaoyang Hospital, Capital Medical University, Beijing, China, 2Department of Magnetic Resonance Imaging, First Affiliated Hospital of Zhengzhou University, Zhengzhou, China, 3MR Research Collaboration, Siemens Healthcare, Beijing, China
Synopsis
Keywords: Stroke, Quantitative Imaging, microstructure\stroke
Motivation: Plaque inflammation is the main cause of plaque instability; thus, a convenient and noninvasive method of evaluating intracranial plaque inflammation is needed.
Goal(s): Noninvasive CDT DCE-MRI enables evaluating the inflammation of MCA culprit plaques in patients with IS.
Approach: We compared the CDT DCE-MRI parameters of MCA culprit plaques between patients with acute and non-acute ischemic stroke (IS) and assessed the correlations between these parameters and stroke time.
Results: Ktrans of the CDT DCE-MRI was higher in patients with acute IS than in patients with non-acute IS. Ktrans was significantly negatively correlated with stroke time.
Impact: Ktrans allows non-invasively distinguishing responses to MCA plaque inflammation between patients with acute and non-acute IS. CDT DCE-MRI may be a promising noninvasive tool for accurately assessing large intracranial arterial plaque inflammation.
Introduction:
Atherosclerotic plaques of middle cerebral artery (MCA) are the main cause of ischemic stroke (IS). Plaque inflammation is a leading cause of plaque instability. CAIPIRINHA-Dixon-TWIST(CDT) dynamic contrast-enhanced (DCE) magnetic resonance imaging (MRI) offers better temporal-spatial resolution than gradient-recalled-echo DCE-MRI1. This study aims to analyze the ability of CDT DCE-MRI to assess the MCA culprit plaques inflammation in patients with IS.Methods
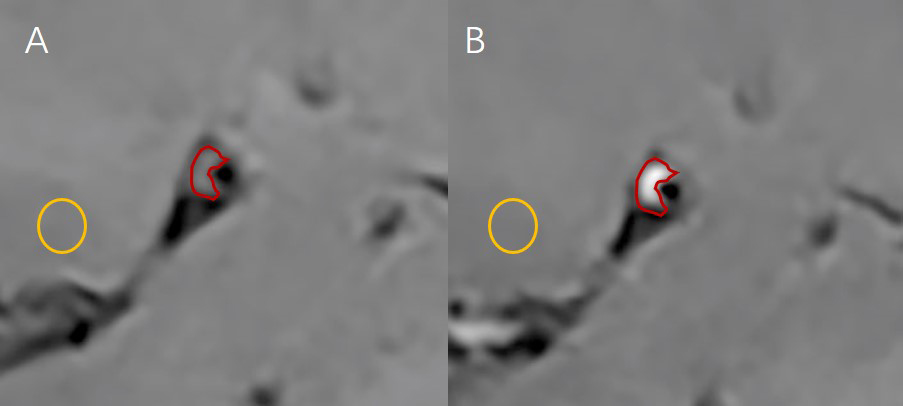
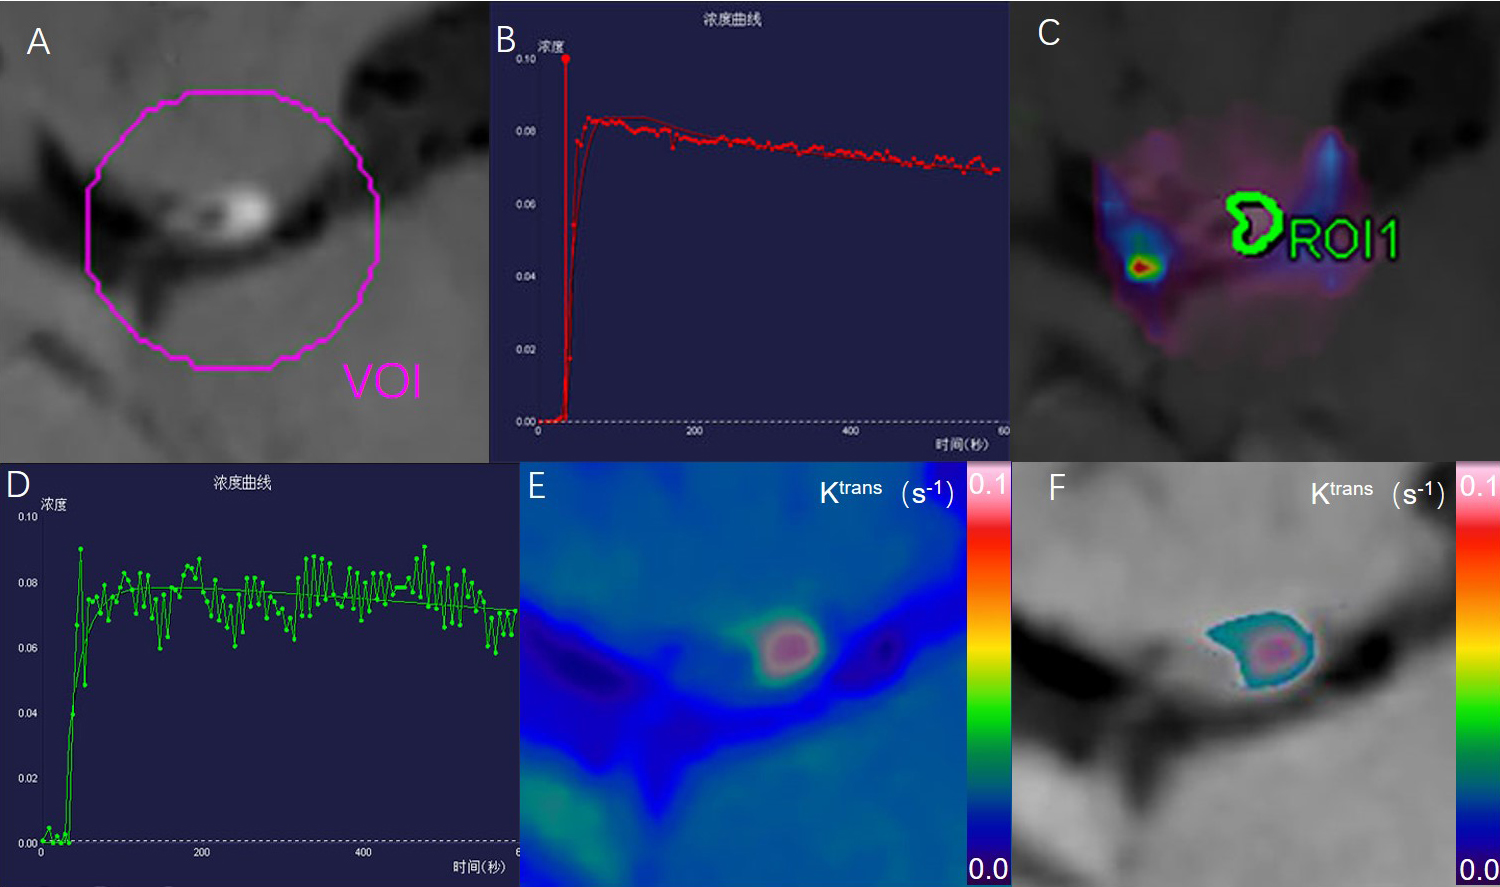
Ninety-four patients who underwent MRI within 3 months of their first IS were included. Stroke time was the duration between the first appearance of IS and MRI. Patients were classified as having acute IS (AIS; stroke time ≤14 days) or non-acute IS (non-AIS; stroke time >14 days and ≤3 months). All patients underwent high-resolution MRI of vascular walls (HR-VW-MRI) and CDT DCE-MRI in a 3T MR scanner (MAGNETOM Prisma Siemens Healthcare, Erlangen, Germany). All subjects gave written informed consent. The HR-VW-MRI sequence was a black-blood three-dimensional Sampling Perfection with Application-optimized Contrast using different flip angle Evolutions (3D-SPACE) T1-weighted imaging (T1WI). The 3D-SPACE-T1WI parameters (pre- and post-contrast) were repetition time (TR): 900.0 ms; echo time (TE): 15.0 ms; field of view (FOV): 200 × 200 mm2; slice thickness: 0.6 mm; 224 slices; voxel size: 0.6 × 0.6 × 0.5 mm3; number of excitations (NEX): 2; acquisition time: 7 min 36 s. The CDT DCE-MRI parameters were TR: 4.9 ms; TE: 1.9 ms; FOV: 220 × 220 mm2; slice thickness: 2.0 mm; 26 slices; voxel size: 1.1 × 1.1 × 2.0 mm3; NEX: 2; temporal resolution: 4.9 s; acquisition time: 8 min 16 s. A single dose (0.1 mmol/kg) of T1-shortening gadolinium contrast (gadopentetate dimeglumine, Magnevist; Bayer HealthCare Pharmaceuticals, Wayne, NJ, USA) was injected at 4 mL/s during DCE acquisition. Two neuroradiologists with 5 years of experience each observed the post-contrast 3D-SPACE-T1WI at picture archiving and communication system, selected three layers with the most significant plaque enhancement, matched the pre- and post-contrast images, and measured the signal intensity (SI). The average pre- and post-contrast SIs were obtained using the three-layer SIs. The mean pre- and post-contrast SIs of the gray matter were also measured (Figure 1). The enhancement ratio (ER) was calculated using the formula: ER=(〖SIplaque〗_post/〖SIgray matter〗_post-〖SIplaque〗_pre/〖SIgray〗_pre)/(〖SIplaque〗_pre/〖SIgray〗_pre )×100%. Two neuroradiologists loaded the HR-VM-MRI and CDT DCE-MRI into TISSUE 4D software (Siemens Healthcare, Erlangen, Germany), corrected the motion, registered and fused the imaging, located the plaque areas, selected the volume of interest, converted the time-signal curve into the time-contrast agent concentration curve, selected the Tofts pharmacokinetic model, manually outlined the target plaque as the region of interest, and obtained Ktrans (Figure 2). The intraclass correlation coefficient (ICC) was used to evaluate the inter-reader variabilities of Ktrans and ER. Continuous variables were compared using independent-sample t-tests or Mann-Whitney U test. The efficacy of statistically significant variables was assessed via receiver operating characteristic curves and compared using Delong’s test. Spearman rank correlation analysis was used to assess the associations of Ktrans and ER with stroke time. P<0.05 was considered statistically significant.Results
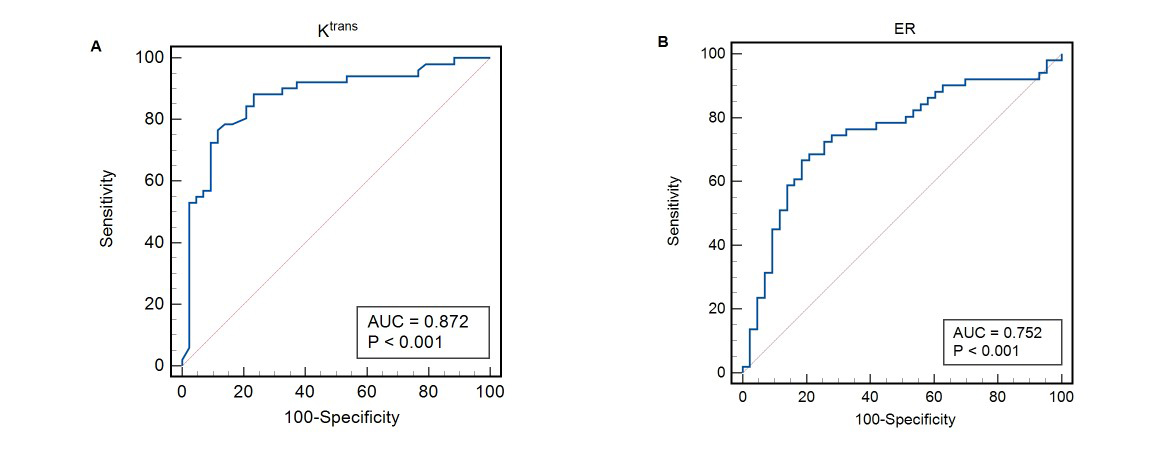
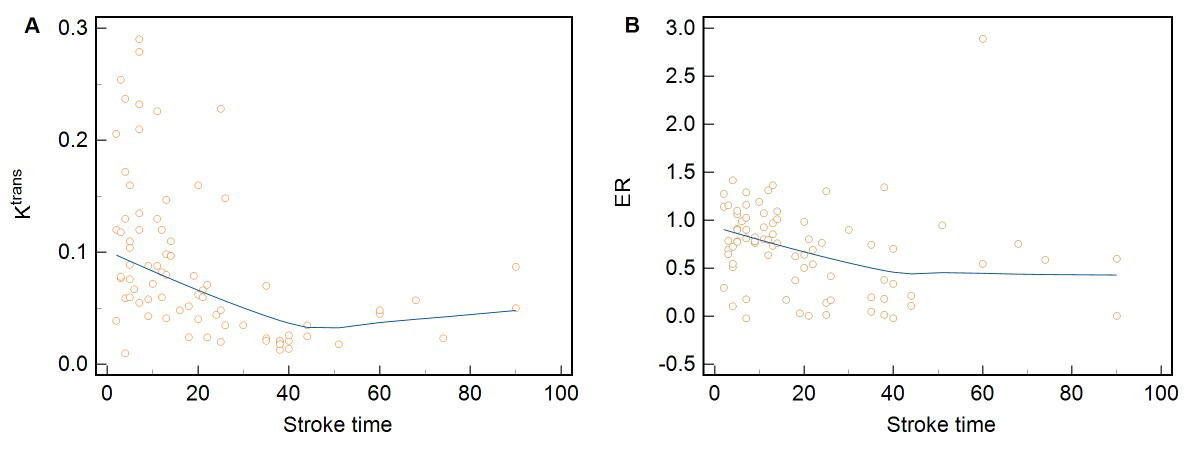
Inter-reader agreements for Ktrans and ER were excellent (ICCs >0.80). Ktrans (0.098s-1 vs. 0.037s-1, P<0.001) and ER (0.86 vs. 0.54, P<0.001) differed significantly between the AIS and non-AIS groups (P<0.001). The area of the curve (AUC) of Ktrans was 0.87 (95% confidence interval [95%CI]: 0.79–0.93); the AUC of the ER was 0.75 (95%CI: 0.65–0.85; Figure 3). Delong’s test showed that Ktrans performed better than did the ER (P=0.034). ER was negatively correlated with stroke time (r= −0.34), and Ktrans was more strongly negatively correlated with stroke time (r= −0.60; Figure 4).Discussion
Chen et al. pathologically confirmed the existence of neovascularization and inflammation in MCA plaques2. Vakil et al. found that DCE-MRI was suitable for assessing intracranial plaque inflammation3. Ktrans reflects the penetration rate of the contrast agent from the vascular to the extracellular space and is closely related to plaque inflammation4. We found that the Ktrans was higher in the AIS group than in the non-AIS group, indicating that plaques inflammation was more active in the AIS group than in the non-AIS group. The efficacy of Ktrans was superior to that of the ER, and Ktrans was more strongly correlated with stroke time than was the ER. Previous studies have shown that the correlation between ER and stroke time is uncertain5-8, possibly due to contrast agent leaking through the loose fiber cap to plaques9. Ktrans connects to the permeability of neovascularization and is unrelated to the fiber cap.Conclusion
CDT DCE-MRI is a promising noninvasive tool for evaluating MCA culprit plaque inflammation in IS.Acknowledgements
We thank our patients, their family and our hospital colleagues for their
support.
References
[1] Hao W, Peng W, Wang C, et al. Image quality of the CAIPIRINHA-Dixon-TWIST-VIBE technique for ultra-fast breast DCE-MRI: Comparison with the conventional GRE technique. Eur J Radiol. 2020;129:109108.
[2] Chen XY, Wong KS, Lam WW, et al. Middle cerebral artery atherosclerosis: histological comparison between plaques associated with and not associated with infarct in a postmortem study. Cerebrovasc Dis. 2008;25(1-2):74-80.
[3] Vakil P, Elmokadem AH, Syed FH, et al. Quantifying Intracranial Plaque Permeability with Dynamic Contrast-Enhanced MRI: A Pilot Study. AJNR Am J Neuroradiol. 2017;38 (2):243-249.
[4] van Hoof RHM, Vöö SA, Sluimer JC, et al. Vessel wall and adventitial DCE-MRI parameters demonstrate similar correlations with carotid plaque microvasculature on histology. J Magn Reson Imaging. 2017;46(4):1053-1059.
[5] Skarpathiotakis M, Mandell DM, Swartz RH, Tomlinson G, Mikulis DJ. Intracranial atherosc lerotic plaque enhancement in patients with ischemic stroke. AJNR Am J Neuroradiol. 2013;34(2):299-304.
[6] Qiao Y, Zeiler SR, Mirbagheri S, et al. Intracranial plaque enhancement in patients with cerebrovascular events on high-spatial-resolution MR images. Radiology. 2014;271(2): 534-542.
[7] van der Kolk AG, Zwanenburg JJ, Brundel M, et al. Distribution and natural course of intracranial vessel wall lesions in patients with ischemic stroke or TIA at 7.0 Tesla MR. Eur Radiol. 2015;25(6):1692-1700.
[8] Abe A, Sekine T, Sakamoto Y, et al. Contrast-Enhanced High-Resolution MRI for Evaluating Time Course Changes in Middle Cerebral Artery Plaques. J Nippon Med Sch. 2018;85(1):28-33.
[9] Millon A, Boussel L, Brevet M, et al. Clinical and histological significance of gadolinium enhancement in carotid atherosclerotic plaque. Stroke. 2012;43(11):3023-3028.
Figures